


 |
市場調查報告書
商品編碼
1692141
美國零擔運輸 (LTL):市場佔有率分析、產業趨勢、成長預測(2025-2030 年)United States Less than-Truck-Load (LTL) - Market Share Analysis, Industry Trends & Statistics, Growth Forecasts (2025 - 2030) |
||||||
價格
※ 本網頁內容可能與最新版本有所差異。詳細情況請與我們聯繫。
簡介目錄
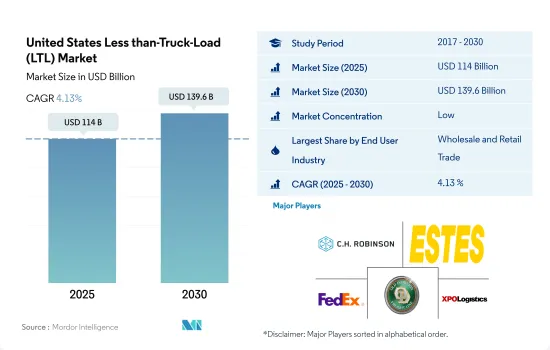
預計 2025 年美國零擔運輸 (LTL) 市場規模將達到 1,140 億美元,到 2030 年將達到 1,396 億美元,預測期內(2025-2030 年)的複合年成長率為 4.13%。
電子商務的蓬勃發展和網路消費者數量的增加將支持零擔運輸市場的成長
- 2024 年 6 月,挪威太陽能公司 NorSun 宣布將向奧克拉荷馬州,美國製造業因此獲得重大推動。這是 Norsan在美國的第一家製造工廠,專注於生產 5GW 的矽錠和太陽能晶片。這項投資凸顯了市場對美國製造的可再生能源零件日益成長的需求,並將極大地促進該行業的發展。製造業的這些發展正在推動對零擔運輸服務的需求。
- 未來幾年,包裹運輸市場的建築部分預計將顯著成長,因為美國建築業預計在 2024 年至 2028 年期間的複合年成長率為 4.7%。對交通、電力和寬頻基礎設施計劃的投資增加將推動這一成長。此外,美國政府的新基礎設施政策和促進國內製造業的努力預計將推動製造業終端用戶領域的發展。
美國零擔貨運 (LTL) 市場趨勢
美國在基礎設施和供應鏈投資的推動下,對該地區 GDP 的貢獻率高達 86%,位居榜首
- 2024年9月,美國運輸部下屬的聯邦航空管理局向519個計劃撥款19億美元。這些計劃遍及 48 個州、關島、波多黎各和其他地區,都是機場改善計畫 (AIP) 的一部分。此外,2023 年還將額外撥款 2.69 億美元,用於支持美國 56 個機場的 62 個計劃。這項競爭舉措將支持機場所有者和營運商加強美國機場系統。第五輪 AIP 資助是迄今為止最大的一輪,將資助廣泛的計劃,從改善機場安全和永續性到降低噪音。美國各地的機場,無論規模大小,都可以獲得津貼。
- 在基礎設施建設和電子商務繁榮的推動下,運輸和倉儲行業的就業機會預計將激增。美國勞工統計局 (BLS) 預測 2022 年至 2032 年期間年增率為 0.8%,相當於新增約 57 萬個就業機會。值得注意的是,除了倉儲和儲存之外,宅配和信使服務預計將推動約 80% 的就業成長。
2022年美國仍將是原油淨進口國,從80個國家進口約628萬桶/天原油。
- 預計到 2024 年 10 月,也就是總統大選前,美國汽油價格將三年多來首次跌破每加侖 3 美元。燃料價格下跌主要是由於需求減弱和原油價格下跌,這為面臨高成本加劇通貨膨脹的消費者提供了緩解。這也可能有助於副總統卡馬拉·哈里斯和其他民主黨人反擊共和黨對高油價的批評。 2024年9月,一般汽油平均價格為每加侖3.25美元,比上月下降19美分,比去年下降58美分。
- 根據美國能源資訊署 (EIA) 的數據,2024 年原油價格將與 2023 年持平,2025 年則將下降。美國將在 2023 年安裝新的精製能力,從而運作並減少 2024 年和 2025 年石油產品價格的扭曲。此外,中東,特別是科威特,正在增加新的國際精製能力,這將有助於緩解全球汽油和柴油的價格壓力。此外,預計 2024 年裂解價差縮小將導致 2024 年和 2025 年美國平均零售燃料價格下降。預計 2024 年汽油價格為 3.36 美元/加侖,2025 年為 3.24 美元/加侖。
美國零擔運輸 (LTL) 產業概況
美國零擔貨運(LTL)市場較為分散,市場上主要有五主要企業(按字母順序排列):C.H. Robinson、Estes Express Lines、聯邦快遞、Old Dominion Freight Line 和 XPO, Inc.
其他福利:
- Excel 格式的市場預測 (ME) 表
- 3個月的分析師支持
目錄
第1章執行摘要和主要發現
第2章 報告要約
第3章 引言
- 研究假設和市場定義
- 研究範圍
- 調查方法
第4章 產業主要趨勢
- 按經濟活動分類的GDP分佈
- 按經濟活動分類的GDP成長
- 經濟表現及概況
- 電子商務產業趨勢
- 製造業趨勢
- 交通運輸倉儲業GDP
- 物流績效
- 道路長度
- 出口趨勢
- 進口趨勢
- 燃油價格趨勢
- 卡車運輸成本
- 卡車持有量(按類型)
- 主要卡車供應商
- 公路貨運噸位趨勢
- 公路貨運價格趨勢
- 模態共享
- 通貨膨脹率
- 法律規範
- 價值鍊和通路分析
第5章市場區隔
- 最終用戶產業
- 農業、漁業和林業
- 建設業
- 製造業
- 石油和天然氣、採礦和採石
- 批發和零售
- 其他
- 匯出目的地
- 國內的
- 國外
第6章競爭格局
- 關鍵策略趨勢
- 市場佔有率分析
- 商業狀況
- 公司簡介
- A. Duie Pyle, Inc.
- ArcBest
- Averitt Express, Inc.
- CH Robinson
- Day & Ross
- Daylight Transport, LLC
- Dayton Freight Lines, Inc.
- DHL Group
- Estes Express Lines
- Fastfrate Inc.
- FedEx
- Knight-Swift Transportation Holdings Inc.
- Landstar System Inc.
- Oak Harbor Freight Lines, Inc.
- Old Dominion Freight Line
- Pitt Ohio Transportation Group
- R+L Carriers, Inc.
- Roadrunner Freight
- Saia Inc.
- Schneider National, Inc.
- Southeastern Freight Lines
- TFI International Inc.
- United Parcel Service of America, Inc.(UPS)
- Ward Transport and Logistics Corporation
- Werner Enterprises Inc.
- XPO, Inc.
第7章:CEO面臨的關鍵策略問題
第 8 章 附錄
- 全球物流市場概覽
- 概述
- 五力分析框架
- 全球價值鏈分析
- 市場動態(市場促進因素、限制因素、機會)
- 資訊來源及延伸閱讀
- 圖片列表
- 關鍵見解
- 數據包
- 詞彙表
- 外匯
簡介目錄
Product Code: 90837
The United States Less than-Truck-Load (LTL) Market size is estimated at 114 billion USD in 2025, and is expected to reach 139.6 billion USD by 2030, growing at a CAGR of 4.13% during the forecast period (2025-2030).
E-commerce boom and rising online buyers supporting the growth of the LTL market
- In June 2024, the United States manufacturing sector saw significant developments, highlighted by Norwegian solar company NorSun's announcement of a USD 620 million investment in Tulsa, Oklahoma. This marks NorSun's first U.S. manufacturing plant, focused on producing 5 GW of silicon ingots and solar wafers. This investment underscores the increasing demand for American-made renewable energy components and significantly boosts the sector. These developments in the manufacturing sector are driving the demand for LTL services.
- In the coming years, the construction segment of the less-than-truckload market is projected to experience significant growth, driven by the United States construction sector's expected CAGR of 4.7% from 2024 to 2028. Increased investments in transport, electricity, and broadband infrastructure projects bolster this growth. Also, the US government's new infrastructure policies and efforts to boost domestic manufacturing are expected to boost the manufacturing end-user segment.
United States Less than-Truck-Load (LTL) Market Trends
United States leads regional GDP with 86% contribution, driven by infrastructure and supply chain investments
- In September 2024, the FAA, under the US Department of Transportation, allocated USD 1.9 billion in grants for 519 projects. These projects span 48 states, Guam, Puerto Rico, and other territories, all part of the Airport Improvement Program (AIP). Additionally, USD 269 million in Supplemental Discretionary Grants for 2023 will back 62 projects at 56 U.S. airports. This competitive initiative aids airport owners and operators in enhancing the U.S. airport system. Marking its largest round yet, this fifth AIP grant cycle funds diverse projects, from airport safety and sustainability upgrades to noise reduction. The grants cater to airports nationwide, regardless of size.
- With infrastructure development and the e-commerce boom, the transportation and storage sector is set for a job surge. The Bureau of Labor Statistics (BLS) projects a 0.8% annual growth rate from 2022 to 2032, translating to nearly 570,000 new jobs. Notably, the couriers and messengers industry, alongside warehousing and storage, is expected to drive about 80% of this job growth.
The United States remained a net crude oil importer in 2022, importing about 6.28 million bpd of crude oil from 80 countries
- Gasoline prices in the US are expected to drop below USD 3 a gallon for the first time in over three years by October 2024, just before the presidential election. Lower fuel prices are mainly due to weaker demand and falling oil prices, providing relief to consumers who have faced high costs that fueled inflation. This could also help Vice President Kamala Harris and other Democrats counter Republican criticism over high gas prices. In September 2024, the average price for regular gas was USD 3.25 a gallon, down 19 cents from last month and 58 cents from last year.
- According to US Energy Information Administration (EIA), crude oil prices will stay steady in 2024 compared to 2023, then decrease in 2025. The US' introduction of new refining capacities in 2023 will boost its operable capacity, alleviating price strain on oil products in 2024 and 2025. Furthermore, the Middle East, particularly Kuwait, will add new international refining capacities, which will help ease global price pressure on gasoline and diesel. Also, it is expected, narrowing crack spreads in 2024 are likely to lead to lower average US retail fuel prices in both 2024 and 2025. Gasoline prices are projected to USD 3.36/gal in 2024 and USD 3.24/gal in 2025.
United States Less than-Truck-Load (LTL) Industry Overview
The United States Less than-Truck-Load (LTL) Market is fragmented, with the major five players in this market being C.H. Robinson, Estes Express Lines, FedEx, Old Dominion Freight Line and XPO, Inc. (sorted alphabetically).
Additional Benefits:
- The market estimate (ME) sheet in Excel format
- 3 months of analyst support
TABLE OF CONTENTS
1 EXECUTIVE SUMMARY & KEY FINDINGS
2 REPORT OFFERS
3 INTRODUCTION
- 3.1 Study Assumptions & Market Definition
- 3.2 Scope of the Study
- 3.3 Research Methodology
4 KEY INDUSTRY TRENDS
- 4.1 GDP Distribution By Economic Activity
- 4.2 GDP Growth By Economic Activity
- 4.3 Economic Performance And Profile
- 4.3.1 Trends in E-Commerce Industry
- 4.3.2 Trends in Manufacturing Industry
- 4.4 Transport And Storage Sector GDP
- 4.5 Logistics Performance
- 4.6 Length Of Roads
- 4.7 Export Trends
- 4.8 Import Trends
- 4.9 Fuel Pricing Trends
- 4.10 Trucking Operational Costs
- 4.11 Trucking Fleet Size By Type
- 4.12 Major Truck Suppliers
- 4.13 Road Freight Tonnage Trends
- 4.14 Road Freight Pricing Trends
- 4.15 Modal Share
- 4.16 Inflation
- 4.17 Regulatory Framework
- 4.18 Value Chain & Distribution Channel Analysis
5 MARKET SEGMENTATION (includes market size in Value in USD, Forecasts up to 2030 and analysis of growth prospects)
- 5.1 End User Industry
- 5.1.1 Agriculture, Fishing, and Forestry
- 5.1.2 Construction
- 5.1.3 Manufacturing
- 5.1.4 Oil and Gas, Mining and Quarrying
- 5.1.5 Wholesale and Retail Trade
- 5.1.6 Others
- 5.2 Destination
- 5.2.1 Domestic
- 5.2.2 International
6 COMPETITIVE LANDSCAPE
- 6.1 Key Strategic Moves
- 6.2 Market Share Analysis
- 6.3 Company Landscape
- 6.4 Company Profiles
- 6.4.1 A. Duie Pyle, Inc.
- 6.4.2 ArcBest
- 6.4.3 Averitt Express, Inc.
- 6.4.4 C.H. Robinson
- 6.4.5 Day & Ross
- 6.4.6 Daylight Transport, LLC
- 6.4.7 Dayton Freight Lines, Inc.
- 6.4.8 DHL Group
- 6.4.9 Estes Express Lines
- 6.4.10 Fastfrate Inc.
- 6.4.11 FedEx
- 6.4.12 Knight-Swift Transportation Holdings Inc.
- 6.4.13 Landstar System Inc.
- 6.4.14 Oak Harbor Freight Lines, Inc.
- 6.4.15 Old Dominion Freight Line
- 6.4.16 Pitt Ohio Transportation Group
- 6.4.17 R+L Carriers, Inc.
- 6.4.18 Roadrunner Freight
- 6.4.19 Saia Inc.
- 6.4.20 Schneider National, Inc.
- 6.4.21 Southeastern Freight Lines
- 6.4.22 TFI International Inc.
- 6.4.23 United Parcel Service of America, Inc. (UPS)
- 6.4.24 Ward Transport and Logistics Corporation
- 6.4.25 Werner Enterprises Inc.
- 6.4.26 XPO, Inc.
7 KEY STRATEGIC QUESTIONS FOR ROAD FREIGHT CEOS
8 APPENDIX
- 8.1 Global Logistics Market Overview
- 8.1.1 Overview
- 8.1.2 Porter's Five Forces Framework
- 8.1.3 Global Value Chain Analysis
- 8.1.4 Market Dynamics (Market Drivers, Restraints & Opportunities)
- 8.2 Sources & References
- 8.3 List of Tables & Figures
- 8.4 Primary Insights
- 8.5 Data Pack
- 8.6 Glossary of Terms
- 8.7 Currency Exchange Rate
02-2729-4219
+886-2-2729-4219
 小包裹市場:按運輸重量、最終用途行業和地區分類
 高壓氣體運輸卡車:全球市場佔有率和排名、總收入和需求預測(2025-2031 年)
 零擔負載容量市場規模、佔有率和成長分析(按服務、運能、營運模式、最終用途和地區分類)-產業預測,2025-2032年
 交通運輸即服務市場分析及預測(至 2034 年):類型、產品、服務、技術、組件、應用、部署、最終使用者、模式與解決方案
 臂架式卡車市場按應用、有效載荷能力、臂架類型、推進動力和最終用戶分類-2025-2032年全球預測
 全球鏟鬥卡車市場全球箱型貨車市場
 全球鬥車市場研究報告 - 產業分析、規模、佔有率、成長、趨勢及 2025 年至 2033 年預測
 吊臂卡車市場-全球產業規模、佔有率、趨勢、機會和預測,按安裝、按起重能力、按吊臂長度、按應用、按地區和競爭進行細分,2020-2030 年工業油輪市場:未來預測(2025-2030)
▼