


 |
市場調查報告書
商品編碼
1690770
太陽能-市場佔有率分析、產業趨勢與統計、成長預測(2025-2030)Solar Energy - Market Share Analysis, Industry Trends & Statistics, Growth Forecasts (2025 - 2030) |
||||||
價格
※ 本網頁內容可能與最新版本有所差異。詳細情況請與我們聯繫。
簡介目錄
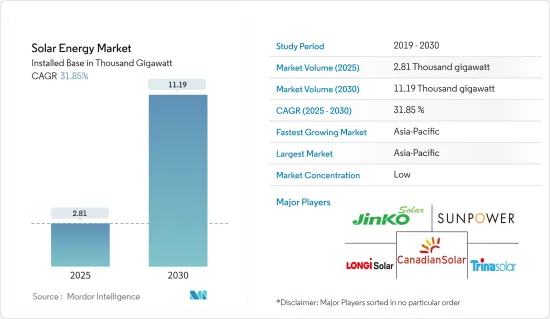
預計太陽能市場安裝基數將從 2025 年的 2,810 吉瓦成長到 2030 年的 11,190 吉瓦,預測期間(2025-2030 年)的複合年成長率為 31.85%。
關鍵亮點
- 從中期來看,預計預測期內,政府的有利措施和太陽能發電系統價格的下降,以及太陽能板價格和安裝成本的下降,將支持全球太陽能市場的成長。
- 另一方面,在研究期間,擴大採用替代清潔能源(例如燃氣發電廠以及陸上和離岸風力發電計劃)可能會阻礙市場成長。
- 預計太陽能和能源儲存系統的整合將為未來市場創造許多機會。
- 在預測期內,由於中國、印度和其他國家的太陽能發電裝置不斷增加,亞太地區預計將成為太陽能市場規模最大、成長最快的地區。
太陽能市場趨勢
光伏(PV)領域預計將佔據市場主導地位
- 光伏系統使用由矽等半導體材料製成的太陽能板將陽光直接轉化為電能。當陽光照射到太陽能電池時,它會激發電子並產生直流電 (DC)。然後,這種直流電透過家庭、企業和電網中的逆變器轉換為交流電。
- 預計未來五年太陽能光電(PV)領域將佔年度再生能源新增產能的最大佔有率,大大超過水力和風能。根據國際可再生能源機構(IRENA 2024)的數據,太陽能光電裝置容量為1,412.093 GW,相對高於2020年的721.989 GW。
- 此外,由於人口成長、都市化以及交通運輸等各領域的電氣化,全球對電力的需求不斷增加。太陽能光電系統提供了一種可擴展的分散式解決方案,以滿足日益成長的能源需求,特別是在電網基礎設施有限或不可靠的地區。
- 預計2023年全球太陽能光電年安裝量將比2022年成長80%以上,併網裝置容量將達到417 GWdc。在政府雄心勃勃的目標、政策支持和競爭加劇的推動下,未來對太陽能發電的投資預計將進一步成長。
- 根據國際能源總署 (IEA) 的數據,預計到 2024 年全球太陽能光電產能將達到約 1,000 吉瓦,足以滿足 IEA 淨零排放情境到 2050 年的年度需求(2030 年約為 650 吉瓦)。
- 美國、歐洲和印度政府都將太陽能供應鏈多元化作為優先事項,實施印度生產連結獎勵計畫計劃(PLI)和美國通膨削減法案(IRA)等舉措,為國內製造商提供直接財政獎勵,以更好地與中國製造商競爭。因此,預計 2022 年至 2023 年間將宣布超過 120% 的新太陽能製造計劃,這有可能導致在每個地區建立產能超過 20GW 的國家太陽能供應鏈。
- 同時,印度在太陽能發電發展方面也取得了長足進展。 2023年,該國的太陽能發電容量將達到971萬千瓦,比2022年增加15.4%。隨著將競標太陽能發電容量增加到每年40吉瓦的新目標以及國內供應鏈的蓬勃發展,預計太陽能成長將很快進一步加速。
- 此外,世界各國政府正在推出支持政策和財政獎勵來鼓勵採用太陽能。這些措施包括上網電價、稅額扣抵、補貼和淨計量計劃。這些措施將降低前期成本、提高投資收益、促進電網整合,進而促進太陽能光電系統的普及。
- 例如,澳洲設定了2030年82%的電力來自太陽能和風能等可再生能源的目標,預計太陽能將對實現這一目標做出重大貢獻。
- 因此,由於上述因素,預計公共產業部門將在預測期內主導太陽能市場。
亞太地區可望主導市場
- 包括中國、印度和日本在內的亞太地區許多國家都制定了雄心勃勃的可再生能源目標和支持政策,以鼓勵採用太陽能。這些措施包括上網電價、可再生能源組合標準以及太陽能發電設施補貼。強而有力的政府支持和穩定的政策框架為該地區太陽能市場的成長創造了有利的環境。
- 根據國家能源局統計,2019年,全國風電累積設備容量約292萬千瓦,與前一年同期比較成長13.9%,其中太陽能發電裝置容量6094萬千瓦,與前一年同期比較成長55.2%。此外,根據國家發展和改革委員會(NDRC)和國家能源局(NEA)的新指南,中國計劃在2025年將分散式可再生能源容量擴大到500吉瓦。
- 此外,亞太國家正在經歷快速人口成長和經濟擴張,這也增加了對電力的需求。太陽能為日益成長的能源需求提供了可擴展、永續的解決方案。因此,該地區太陽能應用的市場潛力巨大。
- 此外,亞太地區的幾個國家正在實施雄心勃勃的大規模太陽能計劃。例如,中國在公用事業規模的太陽能發電裝置方面處於領先地位,擁有大型太陽能發電場和太陽能園區。這些大型計劃將增加該地區的累積太陽能光電容量,並使其在全球太陽能光電市場中佔據參與企業地位。
- 2024年4月,韋丹塔集團旗下的Serentica Renewables表示,計畫投資高達3,000億印度盧比(約35.9億美元)。該公司的目標是到 2030 年實現 17 吉瓦的可再生能源。此外,印度跨國集團阿達尼集團宣布,計劃在 2030 年之前投資約 23 億印度盧比(約 275.5 億美元),用於印度最雄心勃勃的可再生能源擴張以及太陽能和風能發電能力。
- 此外,亞太國家,尤其是中國,也正在成為太陽能光電模組和系統的主要製造地。該地區受益於規模經濟、高效的供應鏈和具有競爭力的生產成本,大大降低了太陽能光電系統的總成本。這種成本優勢正在幫助亞太地區主導全球太陽能市場。
- 因此,預計亞太地區將在預測期內主導太陽能市場。
太陽能產業概況
太陽能市場是細分的。市場上的主要企業(不分先後順序)包括阿特斯太陽能公司、晶科能源控股、天合光能、SunPower Corporation 和隆基綠色能源科技。
其他福利
- Excel 格式的市場預測 (ME) 表
- 3個月的分析師支持
目錄
第1章 引言
- 研究範圍
- 市場定義
- 調查前提
第2章執行摘要
第3章調查方法
第4章 市場概述
- 介紹
- 2029年太陽能裝置容量及預測(單位:吉瓦)
- 全球可再生能源結構(2023年)
- 近期趨勢和發展
- 政府法規和政策
- 市場動態
- 驅動程式
- 政府獎勵和政策
- 太陽能發電系統價格與安裝成本下降
- 限制因素
- 越來越多採用替代清潔能源
- 驅動程式
- 供應鏈分析
- 產業吸引力-波特五力分析
- 供應商的議價能力
- 消費者議價能力
- 新進入者的威脅
- 替代品的威脅
- 競爭對手之間的競爭強度
第5章市場區隔
- 技術部門
- 光伏(PV)
- 概述
- 光伏(PV)裝置容量及2029年預測
- 2023年太陽能發電出貨量(單位:GW)
- 2023年太陽能光電出貨量佔有率(依技術分類)
- 截至2023年太陽能電池組件平均售價(單位:美元/瓦)
- 主要計劃資訊
- 聚光型太陽熱能發電(CSP)
- 概述
- 聚光型太陽熱能發電(CSP)裝置容量及2029年預測
- 2023年投入營運的太陽熱能發電運作(吉瓦)
- 按集熱器類型分類的太陽熱能發電裝置容量佔有率(%)(2023年)
- 主要計劃資訊
- 光伏(PV)
- 市場分析:按地區分類的市場規模及至2028年的需求預測(按地區分類)
- 北美洲
- 美國
- 墨西哥
- 加拿大
- 北美其他地區
- 歐洲
- 德國
- 西班牙
- 義大利
- 英國
- 法國
- 北歐的
- 土耳其
- 俄羅斯
- 其他歐洲國家
- 亞太地區
- 中國
- 印度
- 日本
- 澳洲
- 越南
- 韓國
- 馬來西亞
- 泰國
- 印尼
- 其他亞太地區
- 南美洲
- 巴西
- 阿根廷
- 智利
- 哥倫比亞
- 南美洲其他地區
- 中東和非洲
- 沙烏地阿拉伯
- 阿拉伯聯合大公國
- 埃及
- 奈及利亞
- 南非
- 中東和非洲
- 北美洲
第6章 競爭格局
- 併購、合資、合作與協議
- 主要企業策略
- 公司簡介
- Canadian Solar Inc.
- JinkoSolar Holding Co. Ltd
- Trina Solar Co. Ltd
- SunPower Corporation
- LONGi Green Energy Technology Co. Ltd
- First Solar Inc.
- JA Solar Holding
- Abengoa SA
- Acciona SA
- Brightsource Energy Inc.
- Engie SA
- NextEra Energy Inc.
- ACWA Power
- Sharp Corporation
- REC Solar Holdings AS
- Hanwha Corporation
- 市場排名分析
第7章 市場機會與未來趨勢
- 能源儲存系統系統整合
簡介目錄
Product Code: 71528
The Solar Energy Market size in terms of installed base is expected to grow from 2.81 thousand gigawatt in 2025 to 11.19 thousand gigawatt by 2030, at a CAGR of 31.85% during the forecast period (2025-2030).
Key Highlights
- Over the medium term, favorable government policies and declining prices and installation costs of solar PV systems, along with the declining price of solar panels and installation costs, are likely to support the global solar energy market's growth during the forecast period.
- On the other hand, factors such as the rising adoption of alternate clean power sources, such as gas-fired power plants and onshore and offshore wind projects, are likely to hinder the market growth during the study period.
- Nevertheless, the integration of solar energy with energy storage systems is expected to create several opportunities for the market in the future.
- During the forecast period, Asia-Pacific is expected to be the largest and fastest-growing region in the solar energy market due to the increasing solar installations in China, India, and other countries.
Solar Energy Market Trends
Solar Photovoltaic (PV) Segment Expected to Dominate the Market
- Solar PV systems convert sunlight directly into electricity using solar panels made up of semiconductor materials, typically silicon. When sunlight strikes the solar cells, it excites electrons, generating a flow of direct current (DC) electricity. This DC electricity is converted into alternating current (AC) using an inverter in homes, businesses, and the electrical grid.
- The solar photovoltaic (PV) segment is expected to account for the most significant yearly capacity additions for renewables, well above hydro and wind, for the next five years. According to the International Renewable Energy Agency (IRENA 2024), Solar PV installed capacity accounted for 1412.093 GW, comparatively higher than the 721.989 GW installed in 2020.
- Additionally, the global electricity demand is continuously increasing due to population growth, urbanization, and the electrification of various sectors, including transportation. Solar PV systems offer a scalable and decentralized solution to meet this growing energy demand, particularly in regions with limited or unreliable grid infrastructure.
- Global solar PV annual installations grew by over 80% in 2023 compared to 2022, reaching 417 GWdc of grid-connected installed capacity. Due to ambitious government targets, policy support, and increasing competitiveness, investments in PVs are expected to grow further in the coming years.
- According to the International Energy Agency (IEA), global solar PV manufacturing capacity is expected to reach almost 1,000 GW in 2024, adequate to meet the annual demand for IEA Net Zero Emissions by 2050 scenario of almost 650 GW in 2030.
- Governments in the United States, Europe, and India have started to prioritize solar PV supply chain diversification, implementing policies such as India's Production Linked Incentive (PLI) scheme and the US Inflation Reduction Act (IRA) to provide direct financial incentives for domestic manufacturers to increase their competitiveness with Chinese ones. As a result, over 120% more new solar PV manufacturing projects were announced from 2022 to 2023 to potentially create national PV supply chains with over 20 GW of capacity in each region.
- On the other hand, India is witnessing significant developments in solar PV deployments. The country installed 9.71 GW of solar PV in 2023, 15.4% more than in 2022. A new target to increase PV capacity auctioned to 40 GW annually, and the dynamic development of the domestic supply chain is expected to result in a further acceleration in PV growth shortly.
- Moreover, governments worldwide have introduced supportive policies and financial incentives to promote solar PV installations. These measures include feed-in tariffs, tax credits, grants, and net metering programs. Such policies encourage the adoption of solar PV systems by reducing upfront costs, improving investment returns, and facilitating grid integration.
- For instance, Australia has set a goal of generating 82% of its electricity through renewable sources like solar PV and wind by 2030, and solar PV is expected to be a significant contributor to achieving this target.
- Therefore, based on the abovementioned factors, the utility sector is expected to dominate the solar energy market during the forecast period.
Asia-Pacific Expected to Dominate the Market
- Many countries in Asia-Pacific, such as China, India, and Japan, have implemented ambitious renewable energy targets and supportive policies to encourage solar energy adoption. These policies include feed-in tariffs, renewable portfolio standards, and subsidies for solar installations. Strong government support and stable policy frameworks have created a conducive environment for the region's solar energy market growth.
- According to the China National Energy Agency, China's cumulative installed power capacity reached approximately 2.92 TW, a 13.9% increase year over year, with solar power accounting for 609.49 GW, a 55.2% jump year over year. Also, according to the new guidelines from the National Development and Reform Commission (NDRC) and the National Energy Administration (NEA), China plans to expand its distributed renewable energy capacity to 500 GW by 2025.
- Furthermore, the countries in Asia-Pacific have a rapidly growing population and expanding economies, leading to an increasing demand for electricity. Solar energy offers a scalable and sustainable solution to this growing energy demand. As a result, there is a strong market potential for solar energy deployment in the region.
- Moreover, several countries in Asia-Pacific have undertaken ambitious large-scale solar energy projects. For instance, China has been a leader in utility-scale solar installations, with extensive solar farms and solar parks. These large-scale projects have boosted the region's cumulative solar capacity and positioned it as a dominant player in the global solar market.
- In April 2024, Serentica Renewables, part of Vedanta Group, announced that it plans to invest up to INR 30,000 crore (~USD 3.59 billion). The company aims to achieve 17 GW of renewable energy by 2030. Also, Adani Group, an Indian multinational conglomerate, announced that it is planning to invest around INR 2.3 lakh crore (~USD 27.55 billion) through 2030 in India's most ambitious renewable energy expansion and solar and wind manufacturing capacity addition.
- Moreover, Asia-Pacific countries, particularly China, have also emerged as major manufacturing hubs for solar PV components and systems. The region benefits from economies of scale, efficient supply chains, and competitive production costs, significantly reducing the overall cost of solar energy systems. This cost advantage has contributed to the dominance of Asia-Pacific in the global solar energy market.
- Therefore, Asia-Pacific is expected to dominate the solar energy market during the forecast period.
Solar Energy Industry Overview
The solar energy market is fragmented. Some of the key players in the market (in no particular order) include Canadian Solar Inc., JinkoSolar Holding Co. Ltd, Trina Solar Co. Ltd, SunPower Corporation, and LONGi Green Energy Technology Co. Ltd.
Additional Benefits:
- The market estimate (ME) sheet in Excel format
- 3 months of analyst support
TABLE OF CONTENTS
1 INTRODUCTION
- 1.1 Scope of the Study
- 1.2 Market Definition
- 1.3 Study Assumptions
2 EXECUTIVE SUMMARY
3 RESEARCH METHODOLOGY
4 MARKET OVERVIEW
- 4.1 Introduction
- 4.2 Solar Energy Installed Capacity and Forecast in GW, till 2029
- 4.3 Global Renewable Energy Mix, 2023
- 4.4 Recent Trends and Developments
- 4.5 Government Policies and Regulations
- 4.6 Market Dynamics
- 4.6.1 Drivers
- 4.6.1.1 Government Incentives and Policies
- 4.6.1.2 Declining Price and Installation Cost of Solar PV Systems
- 4.6.2 Restraints
- 4.6.2.1 Rising Adoption of Alternate Clean Power Sources
- 4.6.1 Drivers
- 4.7 Supply Chain Analysis
- 4.8 Industry Attractiveness - Porter's Five Forces Analysis
- 4.8.1 Bargaining Power of Suppliers
- 4.8.2 Bargaining Power of Consumers
- 4.8.3 Threat of New Entrants
- 4.8.4 Threat of Substitute Products and Services
- 4.8.5 Intensity of Competitive Rivalry
5 MARKET SEGEMENTATION
- 5.1 Technology
- 5.1.1 Solar Photovoltaic (PV)
- 5.1.1.1 Overview
- 5.1.1.2 Solar Photovoltaic (PV) Installed Capacity and Forecast, till 2029
- 5.1.1.3 Annual Solar PV Shipments, in GW, till 2023
- 5.1.1.4 Share of Solar PV Shipments (%), by Technology, 2023
- 5.1.1.5 Average Selling Price of Solar PV Module, in USD/W, till 2023
- 5.1.1.6 Key Projects Information
- 5.1.2 Concentrated Solar Power (CSP)
- 5.1.2.1 Overview
- 5.1.2.2 Concentrated Solar Power (CSP) Installed Capacity and Forecast, till 2029
- 5.1.2.3 Solar Thermal Capacity in Operation, in GW, till 2023
- 5.1.2.4 Solar Thermal Installed Capacity Share (%), by Collector Type, 2023
- 5.1.2.5 Key Projects Information
- 5.1.1 Solar Photovoltaic (PV)
- 5.2 Geography Regional Market Analysis {Market Size and Demand Forecast till 2028 (for regions only)}
- 5.2.1 North America
- 5.2.1.1 United States
- 5.2.1.2 Mexico
- 5.2.1.3 Canada
- 5.2.1.4 Rest of North America
- 5.2.2 Europe
- 5.2.2.1 Germany
- 5.2.2.2 Spain
- 5.2.2.3 Italy
- 5.2.2.4 United Kingdom
- 5.2.2.5 France
- 5.2.2.6 NORDIC
- 5.2.2.7 Turkey
- 5.2.2.8 Russia
- 5.2.2.9 Rest of Europe
- 5.2.3 Asia-Pacific
- 5.2.3.1 China
- 5.2.3.2 India
- 5.2.3.3 Japan
- 5.2.3.4 Australia
- 5.2.3.5 Vietnam
- 5.2.3.6 South Korea
- 5.2.3.7 Malaysia
- 5.2.3.8 Thailand
- 5.2.3.9 Indonesia
- 5.2.3.10 Rest of Asia-pacific
- 5.2.4 South America
- 5.2.4.1 Brazil
- 5.2.4.2 Argentina
- 5.2.4.3 Chile
- 5.2.4.4 Colombia
- 5.2.4.5 Rest of South America
- 5.2.5 Middle East and Africa
- 5.2.5.1 Saudi Arabia
- 5.2.5.2 United Arab Emirates
- 5.2.5.3 Egypt
- 5.2.5.4 Nigeria
- 5.2.5.5 South Africa
- 5.2.5.6 Middle East and Africa
- 5.2.1 North America
6 COMPETITIVE LANDSCAPE
- 6.1 Mergers and Acquisitions, Joint Ventures, Collaborations, and Agreements
- 6.2 Strategies Adopted by Leading Players
- 6.3 Company Profiles
- 6.3.1 Canadian Solar Inc.
- 6.3.2 JinkoSolar Holding Co. Ltd
- 6.3.3 Trina Solar Co. Ltd
- 6.3.4 SunPower Corporation
- 6.3.5 LONGi Green Energy Technology Co. Ltd
- 6.3.6 First Solar Inc.
- 6.3.7 JA Solar Holding
- 6.3.8 Abengoa SA
- 6.3.9 Acciona SA
- 6.3.10 Brightsource Energy Inc.
- 6.3.11 Engie SA
- 6.3.12 NextEra Energy Inc.
- 6.3.13 ACWA Power
- 6.3.14 Sharp Corporation
- 6.3.15 REC Solar Holdings AS
- 6.3.16 Hanwha Corporation
- 6.4 Market Ranking Analysis
7 MARKET OPPORTUNITIES AND FUTURE TRENDS
- 7.1 Energy Storage Systems Integration
02-2729-4219
+886-2-2729-4219
 太陽能市場-全球產業規模、佔有率、趨勢、機會和預測:按技術、太陽能組件、應用、最終用途、地區和競爭格局分類,2021-2031年
 太陽能市場規模、佔有率和成長分析:按產品/組件、技術、安裝類型、併網類型、最終用途、電源和地區分類-2026-2033年產業預測
 太陽能發電系統市場:2026-2032年全球市場預測(依產品、系統規模、安裝類型及應用分類)
 2026年全球太陽能市場報告
 太陽能發電系統市場分析及預測(至2035年):依類型、產品類型、服務、技術、組件、應用、安裝類型、最終用戶、功能及設備分類
 東南亞太陽能:市場佔有率分析、產業趨勢與統計、成長預測(2026-2031)泰國太陽能:市場佔有率分析、產業趨勢與統計、成長預測(2026-2031)西班牙太陽能:市場佔有率分析、行業趨勢和統計數據、成長預測(2026-2031 年)越南太陽能市場:市場佔有率分析、產業趨勢與統計、成長預測(2026-2031年)太陽能解決方案市場 - 全球產業規模、佔有率、趨勢、機會及預測(按類型、應用、地區和競爭格局分類,2021-2031年)
▼