


 |
市場調查報告書
商品編碼
1690741
日本資料中心:市場佔有率分析、產業趨勢、成長預測(2025-2030 年)Japan Data Center - Market Share Analysis, Industry Trends & Statistics, Growth Forecasts (2025 - 2030) |
||||||
※ 本網頁內容可能與最新版本有所差異。詳細情況請與我們聯繫。
日本資料中心市場規模預估2025年達到2,320兆瓦,2030年達到3,660兆瓦,預估複合年成長率為9.51%。
預計主機託管收益將在 2025 年達到 25.115 億美元,到 2030 年將達到 49.815 億美元,預測期內(2025-2030 年)的複合年成長率為 14.68%。
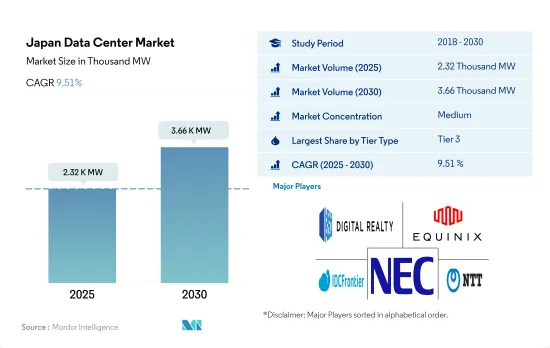
到 2023 年, 層級 3資料中心將佔據大部分佔有率,而層級 4 資料中心在整個預測期內將實現最快的成長。
- 3層級資料中心最受 SMB(中小型企業)的青睞,因為它們提供更好的冗餘保護。執行時間比第 2層級顯著增加,層級3 層每年提供 99.982% 的執行時間。預計該部分將從 2022 年的 1,309.25 兆瓦成長到 2029 年的 1,905.47 兆瓦,複合年成長率為 5.51%。這些資料中心主要由大型企業選擇。
- 由於其效能、低停機時間和 99.99% 的執行時間, 層級 4 設施是大型企業下一個最受歡迎的資料中心。然而,由於其長期財務和營運永續性,大多數設施仍然青睞層級 3資料中心。 層級 3 是各行業採用最廣泛的標準。然而,預計最大的成長率將來自層級 4 設施。
- 由於停機時間較長且冗餘度較低,層級和層級資料中心最不受歡迎,但新興企業通常更喜歡這些資料中心。不過,在日本,新興企業也更青睞層級資料中心。目前,日本還沒有層級 1 或層級 2 認證設施,預計這一趨勢在預測期內仍將持續下去。
日本資料中心的趨勢
智慧型手機普及率的提高和新電子商務平台的出現正在推動市場
- 預計到 2022 年,日本智慧型手機用戶數量將達到 1.071 億。預計到 2029 年,人口將達到 1.1777 億,預測期內複合年成長率為 1.3%。
- 到2021年,日本家庭的智慧型手機普及率將接近89%。近年來,人們使用行動網際網路的平均長度不斷增加,為電子商務等相關行業帶來了機會。
- 隨著網路購物平台的出現,中小型企業也開始轉向線上付款並在電子商務領域實現數位化存在。規模更大、老字型大小企業也將電子商務平台與傳統商業模式結合使用。例如,2022年4月,總部位於東京的PVC產業領先特種穩定劑供應商Westlake Akishima推出了一個新的電子商務平台,為買家提供安全且方便的線上購買體驗。這些發展正在塑造電子商務和線上付款生態系統,影響日本的行動付款。
主要行動電話營運商擴大 5G 部署以及政府對該領域的支援將推動資料中心市場的發展。
- 2019 年 4 月,日本政府向三家行動電話業者(NTT Docomo、KDDI au 和 SoftBank)以及新進業者樂天行動分配了 5G 頻率。未來幾年,日本四大通訊業者預計將投入超過140億美元的資本支出來建設5G網路,包括對基地台、伺服器和光纖的投資。
- 自2021年初以來,日本行動通訊業者一直在加速推出5G。軟銀的目標是到2022年3月底部署超過5萬個5G基地台,達到90%的人口覆蓋率。 KDDI au 的目標是將基地台從 2021 年 3 月的 10,000 個增加到一年後的 50,000 個。 NTT Docomo 將在 2021 年期間擴展其 5G 網路,目標到 6 月達到 10,000 個基地台,到 2022 年 3 月底達到基地台,使用新的高速 5G 頻段實現 55% 的人口覆蓋率。
- 內務部的目標是繼續推動日本的5G體驗。目標是到2024年3月底實現98%人口的5G覆蓋。總體而言,日本正在尋求為5G服務提供更多頻譜。
日本資料中心產業概況
日本資料中心市場適度整合,前五大公司佔41.74%。市場的主要企業包括 Digital Realty Trust Inc.、Equinix Inc.、IDC Frontier Inc.(軟銀集團)、NEC Corporation 和 NTT Ltd。
其他福利
- Excel 格式的市場預測 (ME) 表
- 3個月的分析師支持
目錄
第1章執行摘要和主要發現
第2章 報告要約
第3章 引言
- 研究假設和市場定義
- 研究範圍
- 調查方法
第4章 市場展望
- 負載能力
- 占地面積
- 主機代管收入
- 安裝的機架數量
- 機架空間利用率
- 海底電纜
第5章 產業主要趨勢
- 智慧型手機用戶數量
- 每部智慧型手機的資料流量
- 行動資料速度
- 寬頻資料速度
- 光纖連接網路
- 法律規範
- 日本
- 價值鍊和通路分析
第6章市場區隔
- 熱點
- 大阪
- 東京
- 其他中東和非洲地區
- 資料中心規模
- 大規模
- 超大規模
- 中等規模
- 超大規模
- 小規模
- 層級類型
- 1層級和2級
- 層級
- 層級
- 吸收量
- 未使用
- 使用
- 按主機託管類型
- 超大規模
- 零售
- 批發的
- 按最終用戶
- BFSI
- 雲
- 電子商務
- 政府
- 製造業
- 媒體與娛樂
- 電信
- 其他
第7章競爭格局
- 市場佔有率分析
- 商業狀況
- 公司簡介.
- AirTrunk Operating Pty Ltd
- Arteria Networks Corporation
- Colt Technology Services
- Digital Edge (Singapore) Holdings Pte Ltd
- Digital Realty Trust Inc.
- Equinix Inc.
- IDC Frontier Inc.(SoftBank Group)
- NEC Corporation
- netXDC(SCSK Corporation)
- NTT Ltd
- Telehouse(KDDI Corporation)
- Zenlayer Inc.
第8章:CEO面臨的關鍵策略問題
第9章 附錄
- 世界概況
- 概述
- 五力分析框架
- 全球價值鏈分析
- 全球市場規模和DRO
- 資訊來源及延伸閱讀
- 圖表清單
- 關鍵見解
- 資料包
- 詞彙表
The Japan Data Center Market size is estimated at 2.32 thousand MW in 2025, and is expected to reach 3.66 thousand MW by 2030, growing at a CAGR of 9.51%. Further, the market is expected to generate colocation revenue of USD 2,511.5 Million in 2025 and is projected to reach USD 4,981.5 Million by 2030, growing at a CAGR of 14.68% during the forecast period (2025-2030).
Tier 3 data center accounted for majority share in terms of volume in 2023, Tier 4 is fastest growing through out the forecasted period
- Tier 3 data centers are mostly preferred by SMBs (small and medium businesses) for their far superior redundancy protection offerings. There is a significant jump in uptime from tier 2, with tier 3 offering annual uptime of 99.982%. The segment is expected to grow from 1,309.25 MW in 2022 to 1,905.47 MW by 2029, registering a CAGR of 5.51%. These data centers are mainly opted for by large companies.
- Tier 4 facilities are the next most preferred data centers by large businesses due to their performance, lower downtime, and 99.99% uptime. However, the majority of facilities still prefer tier 3 data centers due to their long-term financial and operational sustainability. Tier 3 is the most widely adopted standard across the industry. However, the growth rate for tier 4 facilities is expected to be the largest.
- Tier 1 & 2 data centers are the least preferred due to their higher downtime durations and low redundancies, but start-up companies usually prefer these data centers. However, in Japan, start-up companies also prefer tier 3 data center facilities. Currently, in Japan, there are no facilities certified with Tier 1 and Tier 2, and this trend is expected to continue during the forecast period.
Japan Data Center Market Trends
Rising smartphone penetration rate and emergence of new e-commerce platform in the country would drive the market
- The total number of smartphone users in Japan was 107.1 million in 2022. It is expected to witness a CAGR of 1.3% during the forecast period, reaching 117.77 million by 2029.
- In 2021, the smartphone penetration rate among households in Japan was close to 89%. The average time people spend on mobile internet use has increased in recent years, offering business opportunities to related industries, such as e-commerce.
- With the emergence of online shopping platforms, small businesses are also switching to online modes of payment and digital presence in the e-commerce world. The big and well-established companies also incorporate e-commerce platforms and the traditional form of business. For instance, in April 2022, Westlake Akishima, a Tokyo-based major supplier of specialty stabilizers for the PVC industry, announced a new e-commerce platform, extending the online buying experience to its buyer with security and convenience. Such developments are shaping the e-commerce and online payment ecosystem, impacting mobile payments in Japan.
Expansion of 5G roll out by major mobile operators coupled with government support in same segment would drive the data center market
- The Japanese government assigned the three mobile operators in Japan - NTT Docomo, KDDI au, and Softbank, as well as the new arrival Rakuten Mobile, with 5G spectrum in April 2019. In the coming years, the four Japanese carriers are expected to spend more than USD 14 billion in capital expenditures, including investments in base stations, servers, and fiber optics, to build their 5G networks.
- Since the start of 2021, Japan's mobile operators have been accelerating their 5G rollout. SoftBank aimed to deploy over 50,000 5G base stations and reach 90% population coverage by the end of March 2022. KDDI au aims to boost from just 10,000 base stations in March 2021 to 50,000 a year later. NTT DoCoMo was expanding its 5G network during 2021, aiming to reach 10,000 base stations by June and 20,000 by the end of March 2022, with 55% population coverage using the new high-speed 5G spectrum.
- The Ministry of International Affairs and Communications aims to continue moving the Japanese 5G experience forward. It set a target of 98% 5G population coverage by the end of March 2024. Overall, Japan aims to boost the amount of spectrum available for 5G services.
Japan Data Center Industry Overview
The Japan Data Center Market is moderately consolidated, with the top five companies occupying 41.74%. The major players in this market are Digital Realty Trust Inc., Equinix Inc., IDC Frontier Inc. (SoftBank Group), NEC Corporation and NTT Ltd (sorted alphabetically).
Additional Benefits:
- The market estimate (ME) sheet in Excel format
- 3 months of analyst support
TABLE OF CONTENTS
1 EXECUTIVE SUMMARY & KEY FINDINGS
2 REPORT OFFERS
3 INTRODUCTION
- 3.1 Study Assumptions & Market Definition
- 3.2 Scope of the Study
- 3.3 Research Methodology
4 MARKET OUTLOOK
- 4.1 It Load Capacity
- 4.2 Raised Floor Space
- 4.3 Colocation Revenue
- 4.4 Installed Racks
- 4.5 Rack Space Utilization
- 4.6 Submarine Cable
5 Key Industry Trends
- 5.1 Smartphone Users
- 5.2 Data Traffic Per Smartphone
- 5.3 Mobile Data Speed
- 5.4 Broadband Data Speed
- 5.5 Fiber Connectivity Network
- 5.6 Regulatory Framework
- 5.6.1 Japan
- 5.7 Value Chain & Distribution Channel Analysis
6 MARKET SEGMENTATION (INCLUDES MARKET SIZE IN VOLUME, FORECASTS UP TO 2030 AND ANALYSIS OF GROWTH PROSPECTS)
- 6.1 Hotspot
- 6.1.1 Osaka
- 6.1.2 Tokyo
- 6.1.3 Rest of Japan
- 6.2 Data Center Size
- 6.2.1 Large
- 6.2.2 Massive
- 6.2.3 Medium
- 6.2.4 Mega
- 6.2.5 Small
- 6.3 Tier Type
- 6.3.1 Tier 1 and 2
- 6.3.2 Tier 3
- 6.3.3 Tier 4
- 6.4 Absorption
- 6.4.1 Non-Utilized
- 6.4.2 Utilized
- 6.4.2.1 By Colocation Type
- 6.4.2.1.1 Hyperscale
- 6.4.2.1.2 Retail
- 6.4.2.1.3 Wholesale
- 6.4.2.2 By End User
- 6.4.2.2.1 BFSI
- 6.4.2.2.2 Cloud
- 6.4.2.2.3 E-Commerce
- 6.4.2.2.4 Government
- 6.4.2.2.5 Manufacturing
- 6.4.2.2.6 Media & Entertainment
- 6.4.2.2.7 Telecom
- 6.4.2.2.8 Other End User
7 COMPETITIVE LANDSCAPE
- 7.1 Market Share Analysis
- 7.2 Company Landscape
- 7.3 Company Profiles (includes Global Level Overview, Market Level Overview, Core Business Segments, Financials, Headcount, Key Information, Market Rank, Market Share, Products and Services, and Analysis of Recent Developments).
- 7.3.1 AirTrunk Operating Pty Ltd
- 7.3.2 Arteria Networks Corporation
- 7.3.3 Colt Technology Services
- 7.3.4 Digital Edge (Singapore) Holdings Pte Ltd
- 7.3.5 Digital Realty Trust Inc.
- 7.3.6 Equinix Inc.
- 7.3.7 IDC Frontier Inc. (SoftBank Group)
- 7.3.8 NEC Corporation
- 7.3.9 netXDC (SCSK Corporation)
- 7.3.10 NTT Ltd
- 7.3.11 Telehouse (KDDI Corporation)
- 7.3.12 Zenlayer Inc.
- 7.4 LIST OF COMPANIES STUDIED
8 KEY STRATEGIC QUESTIONS FOR DATA CENTER CEOS
9 APPENDIX
- 9.1 Global Overview
- 9.1.1 Overview
- 9.1.2 Porter's Five Forces Framework
- 9.1.3 Global Value Chain Analysis
- 9.1.4 Global Market Size and DROs
- 9.2 Sources & References
- 9.3 List of Tables & Figures
- 9.4 Primary Insights
- 9.5 Data Pack
- 9.6 Glossary of Terms
 2025年全球資料中心資訊技術(IT)設備市場報告2025年全球資料中心遷移市場報告2025年全球配置自動化市場報告
 全球配電中心市場:依類型、應用和地區劃分 - 市場規模、行業趨勢、機會分析和預測(2025-2033 年)
 資料中心 IT 資產處置市場規模、佔有率、成長及全球產業分析:依類型、應用和地區劃分的洞察,以及 2024 年至 2032 年的預測
 資料中心設備及基礎設施市場:2025-2030
 高階主管簡報:2025 年第四季資料中心遷移市場-2025-2030 年預測
 AI資料中心的設備投資的明細和未來預測
 全球資料中心服務市場按服務類型、設施服務、IT 服務、專業諮詢與認證、層級類型、資料中心規模與容量、資料中心類型、企業資料中心和地區分類 - 預測至 2030 年