


 |
市場調查報告書
商品編碼
1690080
美國資料中心 -市場佔有率分析、產業趨勢與統計、成長預測(2025-2030 年)United States Data Center - Market Share Analysis, Industry Trends & Statistics, Growth Forecasts (2025 - 2030) |
||||||
※ 本網頁內容可能與最新版本有所差異。詳細情況請與我們聯繫。
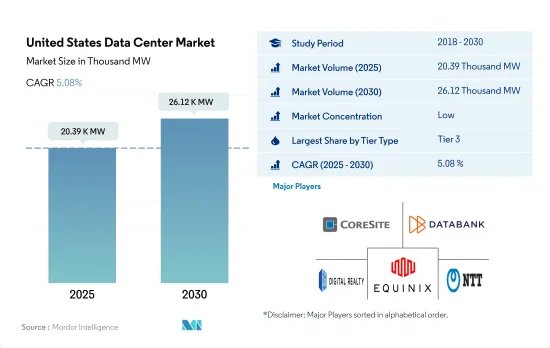
預計 2025 年美國資料中心市場規模為 20,390 千瓦,到 2030 年將達到 26,120 千瓦,複合年成長率為 5.08%。
預計 2025 年主機託管收益將達到 240.364 億美元,2030 年將達到 386.753 億美元,預測期內(2025-2030 年)的複合年成長率為 9.98%。
2023 年, 層級 3資料中心將佔據大部分市場佔有率
- 3層級資料中心是國內最受歡迎的。 2022年的IT負載容量為5,319.6MW。 3層級資料中心擁有冗餘和雙電源伺服器、儲存、網路鏈路和其他 IT 元件。截至 2022 年,全國共有 399 個層級 3資料中心。約有 73 個資料中心正在依照層級 3 標準建置中。
- 小型企業通常喜歡層級設施。小型企業佔活躍企業的99.9%,是美國經濟的重要組成部分。 BFSI 和電訊等最終用戶正在轉向超大規模主機託管服務。
- 4層級資料中心主要受到大型企業的青睞,因為它們可提供 99.995% 的執行時間。然而,成本高是這些設施採用率低的主要原因。隨著資料流量的增加,未來的資料中心可望遵循層級 4標準。在美國,IP 流量將從 2016 年的 376.2 Exabyte成長到 2021 年的 955.7 Exabyte ,這意味著對更多冗餘和高效設施的需求不斷增加。因此,預計 2029 年 4層級資料中心將佔據最大的市場佔有率,達到 48.9%,其次是 3層級設施,佔 45.4%。
- 層級 1 和層級 2資料中心是最不受歡迎的,因為層級 1 的預期運作為 99.671%(每年停機時間為 28.8 小時),而層級 2 的預期運作為 99.741%(每年停機時間為 22 小時)。這些資料中心受到尋求經濟高效的資料儲存方案的中小型企業的歡迎。然而,由於其功能性較低,即使是中小企業也傾向於採用層級 3 認證的批發主機託管服務。因此,預計層級和層級資料中心的成長率最慢。
美國資料中心市場的趨勢
視訊通話使用量的增加、店內購物體驗的增強、遠端醫療服務以及行動遊戲的改進將推動市場成長
- 隨著 5G 等更快的替代網路以及 FWA 等支援技術的廣泛光纖連接的推出,智慧型手機的資料消費量將從 2018 年的 1.8GB 成長到 2022 年的約 8.5GB,複合年成長率為 24.7%。預計這一消費量將進一步成長,到 2029 年將超過 64GB,複合年成長率為 33.6%。隨著 5G 加速智慧型手機的普及和升級,市場將看到資料生成點的增加,從而由於無線網路速度更快而導致資料消耗增加。
- 網際網路速度的提高以及隨之而來的可訪問設備的普及對於確定和估計一個地區的資料消耗起著至關重要的作用。資料顯示,美國5G行動連線數量將從2021年的15%成長到2025年的約68%,顯示美國5G行動普及率很高。用戶發現增強的視訊通話、擴展的店內購物體驗、遠端醫療服務和改進的手機遊戲非常有吸引力,因為 5G 網路上的一些活動會增加資料使用量。
- 其次是 YouTube,約佔 74%,Gmail,佔 61%,Facebook,佔 59%,以及 Google搜尋應用程式,佔 58%。儘管 Android 和 iOS 用戶之間存在分歧,但這些智慧型手機應用程式的廣泛普及表明應用程式在美國具有深刻的滲透力和使用率。這凸顯了資料儲存需要提供此類媒體運行和儲存使用者資料所需的記憶體平台,從而對資料處理設備提出了更高的要求。
智慧型手機的普及和 5G 連接的增加將推動市場成長
- 美國是我們北美和全球智慧型手機產品組合的關鍵市場。預計智慧型手機普及率將從 2021 年的 83% 成長到 2025 年的 85%,這將對用戶普及率的成長做出重大貢獻,從 2021 年的 85% 成長到 2025 年的 86%。這一成長將導致智慧型手機銷量增加以及該國智慧型手機總數的增加。在美國智慧型手機產業,較長的更換速度和缺乏引人注目的功能導致 2018 年銷量下滑,然而,在競爭激烈的智慧型手機市場中,5G 的推出和通訊業者的採用顯著提振了市場。
- 此外,2022 年 1 月發布的資料顯示,智慧型手機銷售額將增加 17 億美元,到 2022 年達到約 747 億美元,而 2021 年約為 730 億美元。儘管新冠疫情期間市場放緩,但 5G 一直是美國智慧型手機普及和滲透的關鍵驅動力。疫情使得 2025 年 5G 連線數預測從 2.05 億增加到 2.18 億左右,顯示 5G 將如何推動該地區的智慧型手機銷售。
- 智慧型手機數量的成長體現在該國行動無線用戶連線數量的增加,從 2019 年的約 4.425 億增加到 2021 年的約 4.9891 億。這一趨勢表明高普及率將有助於銷售。在預測期內,5G 將透過增加資料點對資料產生做出重大貢獻,從而需要更多的資料中心來儲存和處理資料。
美國資料中心產業概況
美國資料中心市場較為分散,前五大企業佔比為16.24%。該市場的主要企業有:CoreSite(美國塔公司)、Databank Holdings Ltd、Digital Realty Trust, Inc.、Equinix, Inc. 和 NTT Ltd.(按字母順序排列)。
其他福利
- Excel 格式的市場預測 (ME) 表
- 3個月的分析師支持
目錄
第1章執行摘要和主要發現
第2章 報告要約
第3章 引言
- 研究假設和市場定義
- 研究範圍
- 調查方法
第4章 市場展望
- 負載能力
- 占地面積
- 主機代管收入
- 安裝的機架數量
- 機架空間利用率
- 海底電纜
第5章 產業主要趨勢
- 智慧型手機用戶數量
- 每部智慧型手機的資料流量
- 行動資料速度
- 寬頻資料速度
- 光纖連接網路
- 法律規範
- 美國
- 價值鍊和通路分析
第6章市場區隔
- 熱點
- 亞特蘭大
- 奧斯汀
- 波士頓
- 芝加哥
- 達拉斯
- 休士頓
- 洛杉磯
- 紐澤西州
- 紐約
- 北加州
- 北維吉尼亞
- 西北
- 鳳凰
- 鹽湖城
- 美國其他地區
- 資料中心規模
- 大規模
- 超大規模
- 中等規模
- 百萬
- 小規模
- 層級類型
- 1層級和2級
- 層級
- 層級
- 吸收量
- 未使用
- 使用
- 按主機託管類型
- 超大規模
- 零售
- 批發的
- 按最終用戶
- BFSI
- 雲
- 電子商務
- 政府
- 製造業
- 媒體與娛樂
- 電信
- 其他最終用戶
第7章競爭格局
- 市場佔有率分析
- 商業狀況
- 公司簡介.
- CoreSite(America Tower Corporation)
- CyrusOne Inc.
- Cyxtera Technologies
- Databank Holdings Ltd
- Digital Realty Trust, Inc.
- Equinix, Inc.
- Flexential Corp.
- H5 Data Centers LLC
- NTT Ltd.
- Quality Technology Services
- Switch
- Vantage Data Centers, LLC
- LIST OF COMPANIES STUDIED
第8章:CEO面臨的關鍵策略問題
第9章 附錄
- 世界概況
- 概述
- 五力分析框架
- 全球價值鏈分析
- 全球市場規模和DRO
- 資訊來源及延伸閱讀
- 圖表清單
- 關鍵見解
- 資料包
- 詞彙表
The United States Data Center Market size is estimated at 20.39 thousand MW in 2025, and is expected to reach 26.12 thousand MW by 2030, growing at a CAGR of 5.08%. Further, the market is expected to generate colocation revenue of USD 24,036.4 Million in 2025 and is projected to reach USD 38,675.3 Million by 2030, growing at a CAGR of 9.98% during the forecast period (2025-2030).
Tier 3 data center accounted for majority share in terms of volume in 2023
- Tier 3 data centers are the most preferred in the country. They operated at an IT load capacity of 5,319.6 MW in 2022. Tier 3 data centers have redundant and dual-powered servers, storage, network links, and other IT components. As of 2022, the country had 399 tier 3 data centers. Around 73 data centers are under construction with Tier 3 standards.
- SMEs generally prefer a Tier 3-rated facility. SMEs are a vital component of the US economy, as they comprise 99.9% of active enterprises. End users such as BFSI and telecom are focusing on hyperscale colocation services.
- Tier 4 data centers are the next most preferred, mainly by large enterprises, as they provide 99.995% uptime. However, high cost is the major factor for the low adoption of these facilities. With the data traffic generation, upcoming data centers are expected to follow Tier 4 standards. In the United States, IP traffic reached an annual run rate of 955.7 exabytes in 2021, up from an annual run rate of 376.2 exabytes in 2016, suggesting the growing demand for more redundant and efficient facilities. As a result, tier 4 data centers are expected to hold the highest market share of 48.9% in 2029, followed by tier 3 facilities with a share of 45.4%.
- Tier 1 & 2 data centers are the least preferred as tier 1 has an expected uptime of 99.671% (28.8 hours of downtime annually), while tier 2 has an expected uptime of 99.741% (22 hours of downtime annually). These data centers are commonly utilized by small businesses looking for a cost-effective option for their data storage needs. However, due to lower functionality, even SMEs are focusing on adopting wholesale colocation services with a Tier 3 certification. Therefore, tier 1 & 2 DCs are expected to showcase the lowest growth.
United States Data Center Market Trends
Increase use of video calling, augmented in-store shopping experiences, remote health services, and improved mobile gaming to drive market growth
- With the introduction of faster network alternatives, such as 5G and extensive fiber connectivity supporting technologies like FWA, data consumption through smartphones increased from 1.8 GB in 2018 to about 8.5 GB in 2022 at a CAGR of 24.7%. This consumption is expected to further increase to more than 64 GB by 2029, at a CAGR of 33.6%. As 5G drives smartphone adoption and upgrades, the market will witness more data generating points, leading to increased data consumption that leverages higher wireless network speeds.
- Faster internet and the subsequent penetration of devices capable of accessing it play a crucial role in determining and estimating data consumption in a region. Data suggests that the number of 5G mobile connections in the United States will increase from 15% in 2021 to about 68% by 2025, signifying high 5G mobile penetration in the country. Users find enhanced video calling, augmented in-store shopping experiences, remote health services, and improved mobile gaming as some of the activities through 5G networks to be very or extremely appealing, which contributes to data usage.
- Several apps account for considerable smartphone reach across audiences, with YouTube accounting for about 74% audience reach, followed by 61% for Gmail, 59% for Facebook, and 58% for the Google Search app. The extensive reach of such smartphone apps, despite the Android and iOS division among the audience, signifies deep app penetration and usage in the United States. This highlights the need for data storage to provide the required memory platforms for such media to perform and store user data, thereby creating a greater demand for data processing facilities.
Smartphone adoption and increasing 5G connections to drive market growth
- The United States is a significant market in both North America and the global smartphone portfolio. With smartphone adoption expected to grow from 83% in 2021 to 85% by 2025, it will substantially contribute to the growth of subscriber penetration rates, increasing from 85% in 2021 to 86% by 2025. This growth will result in a rise in smartphone sales and the overall number of smartphones in the country. Although longer replacement rates and a lack of compelling features in the US smartphone industry led to a decrease in sales in 2018, the market received a major boost with the 5G rollout and adoption by operators in the highly competitive smartphone market.
- Additionally, data released in January 2022 indicated a USD 1.7 billion increase in smartphone sales value, totaling approximately USD 74.7 billion in 2022, compared to about USD 73 billion in 2021. Despite the market slowdown during COVID-19, 5G has been a key driver of smartphone adoption and penetration in the United States. The pandemic increased the anticipated number of 5G connections in 2025 from 205 million to about 218 million, signifying how 5G would drive better smartphone sales in the region.
- The increase in the number of smartphones was observed through the growth of mobile wireless subscriber connections in the country, rising from about 442.5 million in 2019 to approximately 498.91 million by 2021. This trend indicates the high penetration rates contributing to sales. Over the forecast period, 5G will heavily contribute to data generation through increased data points, generating demand for more data centers to store and process the data.
United States Data Center Industry Overview
The United States Data Center Market is fragmented, with the top five companies occupying 16.24%. The major players in this market are CoreSite (America Tower Corporation), Databank Holdings Ltd, Digital Realty Trust, Inc., Equinix, Inc. and NTT Ltd. (sorted alphabetically).
Additional Benefits:
- The market estimate (ME) sheet in Excel format
- 3 months of analyst support
TABLE OF CONTENTS
1 EXECUTIVE SUMMARY & KEY FINDINGS
2 REPORT OFFERS
3 INTRODUCTION
- 3.1 Study Assumptions & Market Definition
- 3.2 Scope of the Study
- 3.3 Research Methodology
4 MARKET OUTLOOK
- 4.1 It Load Capacity
- 4.2 Raised Floor Space
- 4.3 Colocation Revenue
- 4.4 Installed Racks
- 4.5 Rack Space Utilization
- 4.6 Submarine Cable
5 Key Industry Trends
- 5.1 Smartphone Users
- 5.2 Data Traffic Per Smartphone
- 5.3 Mobile Data Speed
- 5.4 Broadband Data Speed
- 5.5 Fiber Connectivity Network
- 5.6 Regulatory Framework
- 5.6.1 United States
- 5.7 Value Chain & Distribution Channel Analysis
6 MARKET SEGMENTATION (INCLUDES MARKET SIZE IN VOLUME, FORECASTS UP TO 2030 AND ANALYSIS OF GROWTH PROSPECTS)
- 6.1 Hotspot
- 6.1.1 Atlanta
- 6.1.2 Austin
- 6.1.3 Boston
- 6.1.4 Chicago
- 6.1.5 Dallas
- 6.1.6 Houston
- 6.1.7 Los Angeles
- 6.1.8 New Jersey
- 6.1.9 New York
- 6.1.10 Northern California
- 6.1.11 Northern Virginia
- 6.1.12 Northwest
- 6.1.13 Phoenix
- 6.1.14 Salt Lake City
- 6.1.15 Rest of United States
- 6.2 Data Center Size
- 6.2.1 Large
- 6.2.2 Massive
- 6.2.3 Medium
- 6.2.4 Mega
- 6.2.5 Small
- 6.3 Tier Type
- 6.3.1 Tier 1 and 2
- 6.3.2 Tier 3
- 6.3.3 Tier 4
- 6.4 Absorption
- 6.4.1 Non-Utilized
- 6.4.2 Utilized
- 6.4.2.1 By Colocation Type
- 6.4.2.1.1 Hyperscale
- 6.4.2.1.2 Retail
- 6.4.2.1.3 Wholesale
- 6.4.2.2 By End User
- 6.4.2.2.1 BFSI
- 6.4.2.2.2 Cloud
- 6.4.2.2.3 E-Commerce
- 6.4.2.2.4 Government
- 6.4.2.2.5 Manufacturing
- 6.4.2.2.6 Media & Entertainment
- 6.4.2.2.7 Telecom
- 6.4.2.2.8 Other End User
7 COMPETITIVE LANDSCAPE
- 7.1 Market Share Analysis
- 7.2 Company Landscape
- 7.3 Company Profiles (includes Global Level Overview, Market Level Overview, Core Business Segments, Financials, Headcount, Key Information, Market Rank, Market Share, Products and Services, and Analysis of Recent Developments).
- 7.3.1 CoreSite (America Tower Corporation)
- 7.3.2 CyrusOne Inc.
- 7.3.3 Cyxtera Technologies
- 7.3.4 Databank Holdings Ltd
- 7.3.5 Digital Realty Trust, Inc.
- 7.3.6 Equinix, Inc.
- 7.3.7 Flexential Corp.
- 7.3.8 H5 Data Centers LLC
- 7.3.9 NTT Ltd.
- 7.3.10 Quality Technology Services
- 7.3.11 Switch
- 7.3.12 Vantage Data Centers, LLC
- 7.4 LIST OF COMPANIES STUDIED
8 KEY STRATEGIC QUESTIONS FOR DATA CENTER CEOS
9 APPENDIX
- 9.1 Global Overview
- 9.1.1 Overview
- 9.1.2 Porter's Five Forces Framework
- 9.1.3 Global Value Chain Analysis
- 9.1.4 Global Market Size and DROs
- 9.2 Sources & References
- 9.3 List of Tables & Figures
- 9.4 Primary Insights
- 9.5 Data Pack
- 9.6 Glossary of Terms
 全球資料中心能源儲存市場
 亞太地區資料中心備份HVO市場(按資料中心類型、材料類型和國家)分析與預測(2025-2034年)
 歐洲HVO資料中心備份市場:按資料中心類型、材料類型和國家的分析和預測(2025-2034年)
 2025-2029年全球人工智慧資料中心市場
 2025年全球資料中心市場
 美國資料中心專案規劃:2025 年第二季度
 衛星網路地面站和資料中心市場-全球產業規模、佔有率、趨勢、機會和預測(按組件、按技術、按行業垂直、按地區和競爭),2020-2030 年預測全球資料中心基礎設施管理軟體市場
 資料中心備用電源 HVO 的全球和區域市場:HVO 製造商、供應商、發電機製造商和資料中心營運商的分析和預測(2025-2034 年)資料中心儲能市場規模、佔有率、趨勢分析報告:按類型、技術、容量範圍、資料中心類型、應用、產業垂直、地區、細分市場預測,2025-2030 年