


 |
市場調查報告書
商品編碼
1689956
二氧化矽 -市場佔有率分析、產業趨勢與統計、成長預測(2025-2030 年)Silica - Market Share Analysis, Industry Trends & Statistics, Growth Forecasts (2025 - 2030) |
||||||
※ 本網頁內容可能與最新版本有所差異。詳細情況請與我們聯繫。
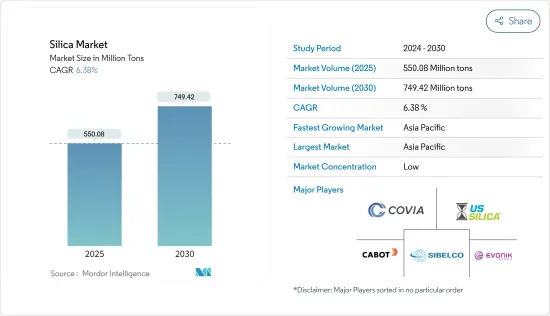
預計 2025 年二氧化矽市場規模為 5.5008 億噸,到 2030 年將達到 7.4942 億噸,預測期內(2025-2030 年)的複合年成長率為 6.38%。
建設產業是二氧化矽的主要消費者,該行業在新冠疫情期間受到供應鏈中斷、停工和其他挑戰的負面影響。然而,隨著疫情後一些建設活動的恢復,對二氧化矽的需求開始成長,使建設產業的二氧化矽市場恢復平衡。預計未來幾年優質混凝土使用量的增加也將推動市場的發展。二氧化矽在電子設備中的使用也是推動市場發展的主要因素。
主要亮點
- 各類終端用戶對沉澱二氧化矽的需求不斷成長以及建設活動的快速擴張可能會推動二氧化矽市場的成長。
- 另一方面,來自替代產品的競爭預計將阻礙市場成長。
- 綠色輪胎的興起以及電動和自動駕駛汽車的日益普及預計將為二氧化矽市場帶來新的機會。
- 由於中國、日本和印度的需求量大,預計亞太地區將主導二氧化矽市場。
二氧化矽市場趨勢
建築和建設產業的需求增加
- 二氧化矽是許多建築產品的關鍵成分。為了提高耐用性和結構完整性,全穀二氧化矽用於地板材料、砂漿、特殊水泥、屋頂瓦片、瀝青混合物、防滑表面和其他工業材料。
- 亞太地區主導全球建設活動。該地區正經歷快速經濟成長,中國、印度、日本和印尼等國家的建設也在增加。根據牛津經濟研究院預測,2020年至2030年間,全球建築業規模預計將成長4.5兆美元(42%),達到15.2兆美元。
- 根據仲量聯行印度分公司(JLL India)統計,2023年上半年印度住宅銷售達1,51,138套,較2022年同期成長24.4%,為近年來最高增幅。根據印度品牌股權基金會 (IBEF) 的數據,2023 年上半年印度住宅銷售量預計將比 2022 年同期激增 130%。
- 由於人口成長、中等收入群體的增加和都市化,亞太地區的建築業正在健康成長。在亞太地區,中國是購物中心建設領先的國家之一。中國目前約有 4,000 家購物中心,預計到 2025 年還將有 7,000 家購物中心開幕。
- 根據美國人口普查局的數據,2023年公共和私人建築總支出將達到1.9787兆美元,比2022年的1.8487兆美元高出7%。 2023年私人建築支出將達到1.541兆美元,比2022年的1.4724兆美元高出4.7%。這樣的建築趨勢很可能在預測期內提振市場。
- 城市事務部長賈達·菲略表示,巴西已訂定「我的家,我的生活」計畫新規,降低利率並增加購屋補貼。該計劃將有助於實現2026年建造200萬套住宅的目標。 2023年7月,巴西總統路易斯·伊納西奧·盧拉·達席爾瓦宣布了未來四年投資2,000億美元的基礎設施、能源和交通發展計畫。
- 所有這些因素都可能推動預測期內對矽砂的需求。
亞太地區佔市場主導地位
- 由於中國和印度在建築、電子和玻璃製造等終端用戶行業的需求中佔據主導地位,預計亞太地區將成為二氧化矽消費的主要市場。
- 根據中國國家統計局的數據,中國建築業正在快速擴張。預計到2023年,中國建築業產出將達到約31.59兆元(4.44兆美元),高於2022年的31.2兆元(4.39兆美元)。
- 2020年,中國宣布計劃在2025年前的五年內投資1.43兆美元用於重大建設計劃。據國家發展和改革委員會(NDRC)稱,上海計劃在未來三年內共投資387億美元。同時,廣州簽約新基建計劃16個,總投資80.9億美元。這些舉措將為中國及全部區域的市場帶來巨大的推動力。
- 印度建築業是該國第二大產業,佔其GDP的很大一部分。例如,根據印度統計和計畫實施部的數據,建設業對印度 GDP 的貢獻約為 8.2%(2022-2023 年)。
- 根據印度品牌股權基金會估計,到2030年,印度房地產產業的規模將達到1兆美元,到2025年將為該國的GDP貢獻13%。
- 印度政府的「全民住宅」計畫預計到 2025 年住宅產業投資將達到 1.3 兆美元。到 2024 年,經濟適用住宅供應量預計將增加約 70%。
- 預計2025年大阪世博會前夕日本建設產業將會蓬勃發展。八重洲重建計劃包括一座 61 層樓、390 公尺高的辦公大樓,預計分別於 2023 年和 2027 年完工。
- 由於這些因素,預計亞太地區將在預測期內佔據市場主導地位。
二氧化矽產業概況
二氧化矽市場較為分散,既有國際參與者,也有國內參與者。研究涉及的市場主要企業(不分先後順序)包括 Covia Holdings LLC、 美國 Silica、Sibelco、Cabot Corporation 和 Evonik Industries AG。
其他福利
- Excel 格式的市場預測 (ME) 表
- 3個月的分析師支持
目錄
第1章 引言
- 調查前提條件
- 研究範圍
第2章調查方法
第3章執行摘要
第4章 市場動態
- 驅動程式
- 各種最終用途對沉澱二氧化矽的需求不斷增加
- 建設活動快速擴張
- 限制因素
- 來自替代產品的競爭
- 價值鏈分析
- 波特五力分析
- 供應商的議價能力
- 買家的議價能力
- 新進入者的威脅
- 替代品的威脅
- 競爭程度
- 技術簡介
第5章市場區隔
- 類型
- 非晶質
- 熱原/燻蒸
- 水合物
- 結晶質
- 石英
- 鱗石英
- 方矽石
- 非晶質
- 最終用戶產業
- 建築與施工
- 頁岩油和天然氣
- 玻璃製造
- 水處理
- 其他最終用戶產業
- 地區
- 亞太地區
- 中國
- 印度
- 日本
- 韓國
- 馬來西亞
- 泰國
- 印尼
- 越南
- 其他亞太地區
- 北美洲
- 美國
- 加拿大
- 墨西哥
- 歐洲
- 德國
- 英國
- 義大利
- 法國
- 俄羅斯
- 西班牙
- 北歐的
- 土耳其
- 其他歐洲國家
- 南美洲
- 巴西
- 阿根廷
- 南美洲其他地區
- 中東和非洲
- 沙烏地阿拉伯
- 南非
- 奈及利亞
- 卡達
- 阿拉伯聯合大公國
- 埃及
- 其他中東和非洲地區
- 亞太地區
第6章 競爭格局
- 併購、合資、合作與協議
- 市場佔有率(%)**/排名分析
- 主要企業策略
- 公司簡介
- AGSCO Corp.
- AMS Applied Material Solutions
- Cabot Corporation
- China-Henan Huamei Chemical Co. Ltd
- Covia Holdings LLC
- Denka Company Limited
- Evonik Industries AG
- Heraeus Holding
- Kemitura Group AS
- Merck KGaA
- Madhu Silica Pvt. Ltd
- Mitsubishi Chemical Corporation
- Nouryon
- OCI COMPANY Ltd
- PPG Industries Inc.
- Sibelco
- Tokuyama Corporation
- US Silica
- Wacker Chemie AG
- WR Grace & Co.-Conn.
第7章 市場機會與未來趨勢
- 綠色輪胎的興起
- 電動車和自動駕駛汽車的普及率不斷提高
The Silica Market size is estimated at 550.08 million tons in 2025, and is expected to reach 749.42 million tons by 2030, at a CAGR of 6.38% during the forecast period (2025-2030).
The primary consumer for silica is the construction industry, which was negatively impacted by supply chain disruptions, lockdowns, and other challenges during the COVID-19 pandemic. However, with the restart of a few construction activities after the pandemic, the demand for silica started to gain momentum, leading to a balanced market for silica in the construction industry. Increasing high-quality concrete usage is also expected to drive the market in the upcoming years. The use of silica in electronics is another major factor that is likely to drive the market.
Key Highlights
- The rising demand for precipitated silica for different end users and rapidly expanding construction activities are likely to drive the growth of the silica market.
- On the flip side, competition from substitute products is expected to hinder the market's growth.
- The growing emergence of green tires and the increasing adoption of electric and self-driving cars are expected to unveil new opportunities for the market studied.
- Asia-Pacific is expected to dominate the silica market due to the high demand from China, Japan, and India.
Silica Market Trends
Increasing Demand from the Building and Construction Industry
- Silica is one of the primary components in various building and construction products. For improved durability and structural integrity, whole-grain silica is used in flooring, mortars, specialty cement, roofing shingles, asphalt mixtures, skid-resistant surfaces, and other industrial materials.
- Asia-Pacific is dominating construction activities worldwide. The area is registering fast economic growth and increasing construction in China, India, Japan, and Indonesia, among others. According to Oxford Economics, the global construction industry is expected to grow by USD 4.5 trillion, or 42%, between 2020 and 2030 to reach USD 15.2 trillion.
- The housing sales in India reached 151,138 units in the first half of 2023, which increased by 24.4% compared to the same period in 2022, as per the Jones Lang LaSalle IP (JLL India). The growth has been the highest over the last couple of years. The sales of luxury homes in the country sharply increased by 130% in the first half of 2023 compared to the same period in 2022, as per the India Brand Equity Foundation (IBEF).
- The construction sector in Asia-Pacific is growing at a healthy rate, owing to the rising population, increasing income of the middle-income groups, and urbanization. In Asia-Pacific, China is one of the leading countries in terms of shopping center construction. China has almost 4,000 shopping centers, while 7,000 more are estimated to open by 2025.
- According to the United States Census Bureau, the value or spending on the total public and private constructions in 2023 was USD 1,978.7 billion, 7% higher than the USD 1,848.7 billion spent in 2022. The spending on private construction in 2023 was USD 1,541.0 billion, 4.7% more than USD 1,472.4 billion in 2022. Such trends in construction may boost the market during the forecast period.
- In Brazil, according to Urban Affairs Minister Jader Filho, the new rules of the Minha Casa, Minha Vida (My Home, My Life) program have been introduced to reduce interest rates and increase subsidies for property purchases. Thus, the program will contribute to the goal of building 2 million housing units by 2026. In July 2023, Brazilian President Luiz Inacio Lula da Silva introduced a development plan worth USD 200 billion for infrastructure, energy, and transportation over the next four years.
- All such factors will likely propel the demand for silica sand during the forecast years.
Asia-Pacific to Dominate the Market
- Asia-Pacific is expected to be the dominant market for silica consumption, as China and India dominate the demand from end-user industries such as building and construction, electronics, and glass manufacturing.
- According to the National Bureau of Statistics of China, the country's building industry is expanding at a rapid pace. China's construction output was valued at around CNY 31.59 trillion (USD 4.44 trillion) in 2023, increasing from CNY 31.2 trillion (USD 4.39 trillion) in 2022.
- In 2020, China unveiled its plans to invest USD 1.43 trillion in key construction projects for five years till 2025. According to the National Development and Reform Commission (NDRC), the Shanghai plan calls for a total investment of USD 38.7 billion over the next three years. Guangzhou, on the other hand, signed 16 new infrastructure projects for USD 8.09 billion. Such initiatives can significantly propel the market in China and the overall region.
- India's construction industry is the second-largest industry in the country, accounting for a significant share of its GDP. For instance, according to the Ministry of Statistics & Programme Implementation, the construction industry accounted for a share of about 8.2% of India's GDP (2022-2023).
- According to the India Brand Equity Foundation, the real estate sector in India is expected to reach USD 1 trillion by 2030, and by 2025, it is estimated to contribute 13% to the country's GDP.
- The Government of India's Housing for All initiative is expected to bring USD 1.3 trillion in investment in the housing industry by 2025. In 2024, the rate of affordable housing availability is projected to increase by roughly 70%.
- The Japanese construction industry is projected to boom as the country prepares to host the World Expo in Osaka, Japan, in 2025. The Yaesu redevelopment project, which includes a 61-story, 390-meter-tall office tower, was scheduled to be completed in 2023 and 2027, respectively.
- Due to such factors, Asia-Pacific is expected to dominate the market during the forecast period.
Silica Industry Overview
The silica market is fragmented, with both international and domestic players. The major companies (not in any particular) in the market studied include Covia Holdings LLC, US Silica, Sibelco, Cabot Corporation, and Evonik Industries AG.
Additional Benefits:
- The market estimate (ME) sheet in Excel format
- 3 months of analyst support
TABLE OF CONTENTS
1 INTRODUCTION
- 1.1 Study Assumptions
- 1.2 Scope of the Study
2 RESEARCH METHODOLOGY
3 EXECUTIVE SUMMARY
4 MARKET DYNAMICS
- 4.1 Drivers
- 4.1.1 Increasing Demand of Precipitated Silica for Different End Uses
- 4.1.2 Rapidly Expanding Construction Activities
- 4.2 Restraints
- 4.2.1 Competition from Substitute Products
- 4.3 Industry Value Chain Analysis
- 4.4 Porter's Five Forces Analysis
- 4.4.1 Bargaining Power of Suppliers
- 4.4.2 Bargaining Power of Buyers
- 4.4.3 Threat of New Entrants
- 4.4.4 Threat of Substitute Products and Services
- 4.4.5 Degree of Competition
- 4.5 Technological Snapshot
5 MARKET SEGMENTATION (Market Size in Volume)
- 5.1 Type
- 5.1.1 Amorphous
- 5.1.1.1 Pyrogenic/Fumed
- 5.1.1.2 Hydrated
- 5.1.2 Crystalline
- 5.1.2.1 Quartz
- 5.1.2.2 Tridymite
- 5.1.2.3 Cristobalite
- 5.1.1 Amorphous
- 5.2 End-user Industry
- 5.2.1 Building and Construction
- 5.2.2 Shale Oil and Gas
- 5.2.3 Glass Manufacturing
- 5.2.4 Water Treatment
- 5.2.5 Other End-user Industries
- 5.3 Geography
- 5.3.1 Asia-Pacific
- 5.3.1.1 China
- 5.3.1.2 India
- 5.3.1.3 Japan
- 5.3.1.4 South Korea
- 5.3.1.5 Malaysia
- 5.3.1.6 Thailand
- 5.3.1.7 Indonesia
- 5.3.1.8 Vietnam
- 5.3.1.9 Rest of Asia-Pacific
- 5.3.2 North America
- 5.3.2.1 United States
- 5.3.2.2 Canada
- 5.3.2.3 Mexico
- 5.3.3 Europe
- 5.3.3.1 Germany
- 5.3.3.2 United Kingdom
- 5.3.3.3 Italy
- 5.3.3.4 France
- 5.3.3.5 Russia
- 5.3.3.6 Spain
- 5.3.3.7 NORDIC
- 5.3.3.8 Turkey
- 5.3.3.9 Rest of Europe
- 5.3.4 South America
- 5.3.4.1 Brazil
- 5.3.4.2 Argentina
- 5.3.4.3 Rest of South America
- 5.3.5 Middle East and Africa
- 5.3.5.1 Saudi Arabia
- 5.3.5.2 South Africa
- 5.3.5.3 Nigeria
- 5.3.5.4 Qatar
- 5.3.5.5 United Arab Emirates
- 5.3.5.6 Egypt
- 5.3.5.7 Rest of Middle East and Africa
- 5.3.1 Asia-Pacific
6 COMPETITIVE LANDSCAPE
- 6.1 Mergers and Acquisitions, Joint Ventures, Collaborations, and Agreements
- 6.2 Market Share (%)**/Ranking Analysis
- 6.3 Strategies Adopted by Leading Players
- 6.4 Company Profiles
- 6.4.1 AGSCO Corp.
- 6.4.2 AMS Applied Material Solutions
- 6.4.3 Cabot Corporation
- 6.4.4 China-Henan Huamei Chemical Co. Ltd
- 6.4.5 Covia Holdings LLC
- 6.4.6 Denka Company Limited
- 6.4.7 Evonik Industries AG
- 6.4.8 Heraeus Holding
- 6.4.9 Kemitura Group AS
- 6.4.10 Merck KGaA
- 6.4.11 Madhu Silica Pvt. Ltd
- 6.4.12 Mitsubishi Chemical Corporation
- 6.4.13 Nouryon
- 6.4.14 OCI COMPANY Ltd
- 6.4.15 PPG Industries Inc.
- 6.4.16 Sibelco
- 6.4.17 Tokuyama Corporation
- 6.4.18 US Silica
- 6.4.19 Wacker Chemie AG
- 6.4.20 WR Grace & Co.-Conn.
7 MARKET OPPORTUNITIES AND FUTURE TRENDS
- 7.1 Growing Emergence of Green Tires
- 7.2 Growth in the Adoption of Electric Cars and Self-driving Cars
 二氧化矽微球-全球市佔率及排名、總收入及需求預測(2025-2031年)高純度有機二氧化矽溶膠:全球市佔率及排名、總收入及需求預測(2025-2031年)有機矽溶膠:全球市佔率排名、總銷售額和需求預測(2025-2031年)
 二氧化矽粉末市場按來源類型、等級、功能、粒徑、純度、分銷管道和應用分類-2025-2032年全球預測
 全球有機矽溶膠市場(2025年)二氧化矽市場按產品類型、形狀、粒度、等級、應用和最終用戶產業分類-2025-2030 年全球預測
 介孔二氧化矽的全球市場
 全球中孔二氧化矽市場研究報告-產業分析、規模、佔有率、成長、趨勢及2025年至2033年預測全球綠色二氧化矽市場二氧化矽粉市場規模、佔有率、趨勢分析報告:按類型、最終用途、地區、細分市場預測,2025-2030 年