


 |
市場調查報告書
商品編碼
1689898
活性漂白土:市場佔有率分析、產業趨勢與統計、成長預測(2025-2030 年)Activated Bleaching Earth - Market Share Analysis, Industry Trends & Statistics, Growth Forecasts (2025 - 2030) |
||||||
※ 本網頁內容可能與最新版本有所差異。詳細情況請與我們聯繫。
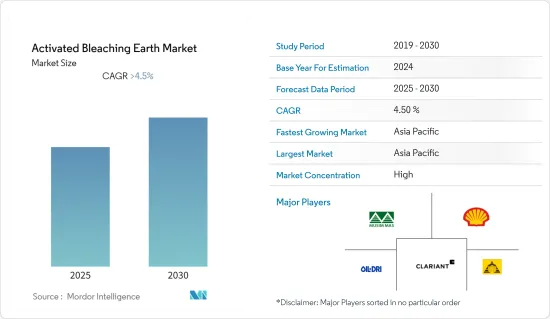
預計預測期內活性漂白土市場將以超過 4.5% 的複合年成長率成長。
COVID-19 對活性漂白土市場產生了負面影響。全球封鎖和嚴格的政府規定導致大多數生產基地關閉,造成了毀滅性的打擊。儘管如此,自 2021 年以來業務一直在復甦,預計未來幾年將大幅成長。
主要亮點
- 市場成長的主要因素是食用油脂需求的增加。
- 然而,替代產品和技術的存在阻礙了市場成長。
- 預計未來幾年生物柴油產量的增加將為市場參與者提供豐厚的成長機會。
- 亞太地區佔據全球市場主導地位,其中中國、印度和日本等國家佔最大的消費量。
活性漂白土市場趨勢
食用油脂需求不斷成長
- 活性漂白土用於精製食用油、廢棄烹飪油(UCO)、污泥油、酸性油和其他廢油,以生產生質柴油和可再生柴油。廣泛用於食用油脂的精製、脫色、漂白。
- 活性漂白土比天然漂白土具有更高的吸附雜質的能力。
- 它用於精製各種食用油脂,包括大豆油、棉籽油、棕櫚油、菜籽油、葵花籽油、紅花油、芥花籽油、菜籽油、橄欖油和芝麻油。
- 2022/23年度全球棕櫚油產量預計將達到7,722萬噸,高於2021/22年度的7,383萬噸。
- 2022/23年度全球豆油產量預估為6,149.4萬噸,較2021/22年度的5,925.9萬噸成長3.0%。
- 全球整體菜籽油產量從2021/22年度的2,907萬噸增加到2022/23年度的3,180萬噸。
- 2022/23年度全球葵花油產量將達2,036萬噸,高於2021/22年度的1,984萬噸。
- 2022/23年度全球棉籽油產量將達502萬噸,高於2021/22年度的497萬噸。
- 然而,由於包括歐洲和南美洲主要生產國在內的多個國家的乾旱加劇,橄欖油產量有所下降。 2022/23年度全球橄欖油產量將為282萬噸,低於2021/22年度的327萬噸。
- 因此,食用油脂產量的增加和活性漂白土需求的激增預計將為全球市場創造成長機會。
亞太地區佔市場主導地位
- 預計亞太地區將佔據活性漂白土市場的最大佔有率。中國是亞太地區植物油消費量和產量最大的國家。雖然產量很高,消費量超過產量,導致進口量大於出口量。
- 根據國際油脂協會預測,2021-22年度中國食用油產量將為2800萬噸,較上年的2815萬噸減少15萬噸。產量下降是由於油籽進口量減少和食用植物油產量下降。
- 根據中國政府報告,2022年7月中國棕櫚油和大豆油進口量分別下降30萬噸和17萬噸,而上年度量分別為370萬噸和63萬噸。
- 據印度植物油生產者協會(IVPA)稱,本會計年度(2022年10月至2023年9月),印度進口了約1,437萬噸植物油。這較上年的1407萬噸進口量大幅增加。
- 根據國際能源總署(IEA)的數據,石油仍然是韓國能源供應總量中最重要的能源來源。韓國精製工業十分發達,除石化原料外,大多數產品都能自給自足。
- 此外,根據加拿大農業和農業食品部 (AAFC) 的報告,2021 年加拿大食用油零售總額為 4.787 億美元。預計到2026年,食用油銷售額將達到5,223億美元。同時,預計到2026年,食用油消費量將達到近100萬噸。
- 根據內務部統計,2021年3月至2023年1月期間,植物油零售價格上漲了67%,遠超過大多數其他主食的價格漲幅。
- 此外,2023年7月國內大豆進口額從2023年6月的1.9005億美元增加至2.1398億美元。大豆油出口額為1700萬美元,進口額為243萬美元,導致貿易逆差。
- 因此,由於上述原因,預計亞太地區將在預測期內佔據市場主導地位。
活性漂白土產業概況
活性漂白土市場本質上是分散的。市場的主要企業(不分先後順序)包括科萊恩、春金集團、殼牌、美國石油鑽探公司和 Ashapura Perfoclay Limited。
其他福利
- Excel 格式的市場預測 (ME) 表
- 3個月的分析師支持
目錄
第1章 引言
- 調查前提條件
- 研究範圍
第2章調查方法
第3章執行摘要
第4章 市場動態
- 驅動程式
- 食用油需求不斷增加
- 限制因素
- 存在替代產品和技術
- 產業價值鏈分析
- 波特五力分析
- 供應商的議價能力
- 消費者議價能力
- 新進入者的威脅
- 替代品的威脅
- 競爭程度
第5章市場區隔
- 按應用
- 食用油脂
- 礦物油和潤滑劑
- 其他(化學品、生質柴油等)
- 按地區
- 亞太地區
- 中國
- 印度
- 日本
- 韓國
- 其他亞太地區
- 北美洲
- 美國
- 加拿大
- 墨西哥
- 歐洲
- 德國
- 英國
- 義大利
- 法國
- 其他歐洲國家
- 南美洲
- 巴西
- 阿根廷
- 南美洲其他地區
- 中東和非洲
- 沙烏地阿拉伯
- 南非
- 其他中東和非洲地區
- 亞太地區
第6章 競爭格局
- 併購、合資、合作與協議
- 市場排名分析
- 主要企業策略
- 公司簡介
- Ashapura Perfoclay Limited(APL)
- Clariant
- Global Bleach Chem Pvt. Ltd
- Hrp Industries
- Indian Clay And Mineral Co.
- Musim Mas Holdings Pte Ltd
- Oil-dri Corporation of America
- Phoenix Chemicals(Pvt.)Ltd
- Refoil Earth Pvt. Ltd
- Shell Plc(ecooils Limited)
- Taiko Group of Companies(Taiko Bleaching Earth Sdn. Bhd.)
- The W Clay Industries Sdn Bhd
第7章 市場機會與未來趨勢
- 提高生質柴油產量
The Activated Bleaching Earth Market is expected to register a CAGR of greater than 4.5% during the forecast period.
COVID-19 had a negative impact on the activated bleaching earth sector. Global lockdowns and severe rules enforced by governments resulted in a catastrophic setback as most production hubs were shut down. Nonetheless, the business has been recovering since 2021 and is expected to rise significantly in the coming years.
Key Highlights
- The major factor driving the market growth is the growing demand for edible oils.
- However, the presence of alternative products and technologies is hindering the market growth.
- Increasing production of bio-diesel is expected to provide lucrative growth opportunities to the market players in the coming years.
- The Asia-Pacific region dominates the global market, with the largest consumption from countries such as China, India, and Japan.
Activated Bleaching Earth Market Trends
Increasing Demand for Edible Oil & Fats
- Activated bleaching earth is used to purify edible oils, used cooking oil (UCO), sludge oils, acid oils, and other waste oils that are utilized in the manufacture of biodiesel and renewable diesel. It is widely used in the refining, decolorizing, and bleaching of edible oil and fats.
- Activated bleaching earths have a higher ability to absorb impurities in comparison to natural bleaching earths.
- It is used for the purification of various edible oils and fats, including soya bean oil, cotton seed oil, palm oil, rapeseed oil, sunflower oil, safflower oil, rice bran oil, corn oil, canola oil, olive oil, and sesame oil.
- In 2022/23, the global production volume of palm oil stood at 77.22 million metric tons, up from 73.83 million metric tons in 2021/22.
- In 2022/23, the global production volume of soybean oil increased by 3.0% to 61,494 thousand metric tons, up from 59,259 thousand metric tons in 2021/22.
- The global production of rapeseed oil across the world increased to 31.8 million metric tons in 2022/23, up from 29.07 million metric tons in 2021/22.
- In 2022/23, the global production of sunflower seed oil stood at 20.36 million metric tons, up from 19.84 million metric tons in 2021/22.
- The global production of cottonseed oil stood at 5.02 million metric tons in 2022/23, up from 4.97 million metric tons in 2021/22.
- However, the world witnessed a decline in the production of olive oil owing to the rising drought conditions in several countries, including major producers in Europe and South America. In 2022/23, the global production of olive oil stood at 2.82 million metric tons, which is lower in comparison to 3.27 million metric tons in 2021/22
- Thus, the increase in production and surge in demand for activated bleaching earth in edible fats and oils are expected to provide growth opportunities in the global market.
Asia-Pacific Region to Dominate the Market
- The Asia-Pacific region is expected to account for the largest share of the activated bleaching earth market. China holds the largest share of vegetable oil consumption and production in Asia-Pacific. Though the production volume is high, consumption exceeds production, resulting in higher import volumes when compared to export volumes.
- According to Oils & Fats International, during the crop year 2021-22, China produced 28 million tonnes of edible oil, a 150,000 tonnes decrease from the previous year's volume of 28.15 million tonnes. The decrease in the production volume is due to the drop in the oilseed imports, leading to a downgrade in edible vegetable oil production.
- As per the reports by the Government of China, in July 2022, the palm oil and soyabean oil imports to the country declined by 300,000 tonnes and 170,000 tonnes as compared to their previous year's volume of 3.7 million tonnes and 630,000 tonnes, respectively.
- According to the Indian Vegetable Oil Producers' Association (IVPA), during the current oil year (October 2022-September 2023), India imported around 14.37 million tonnes of vegetable oil, as compared to 14.07 million tonnes imported in the previous year.
- According to the International Energy Agency (IEA), oil continues to be the most important energy source in South Korea in terms of total energy supply. South Korea has a very important refining industry and is self-sufficient in most products other than petrochemical feedstocks.
- Furthermore, according to a report by Agriculture and Agri-Food Canada (AAFC), the total retail sales of cooking oils in the country were valued at USD 478.7 million in 2021. The sales of cooking oil are projected to reach USD 522.3 billion by the year 2026. While edible oil consumption is expected to reach nearly one million metric tons by 2026.
- According to the Ministry of Internal Affairs and Communications, the retail price for vegetable oil grew by 67% from March 2021 to January 2023, far above the price increase for most other staple foods.
- Additionally, the import value of soybeans in the country reached USD 213.98 million in July 2023 from USD 190.05 million in June 2023. The soybean oil exports in the country accounted for USD 0.17 million, whereas imports accounted for USD 2.43 million, resulting in a negative trade balance.
- Hence, due to the above-mentioned reasons, Asia-Pacific is anticipated to dominate the market during the forecast period.
Activated Bleaching Earth Industry Overview
The activated bleaching earth market is fragmented in nature. Some of the major players in the market (not in any particular order) include Clariant, Musim Mas, Shell, Oil-Dri Corporation of America, and Ashapura Perfoclay Limited, among other companies.
Additional Benefits:
- The market estimate (ME) sheet in Excel format
- 3 months of analyst support
TABLE OF CONTENTS
1 INTRODUCTION
- 1.1 Study Assumptions
- 1.2 Scope of the Study
2 RESEARCH METHODOLOGY
3 EXECUTIVE SUMMARY
4 MARKET DYNAMICS
- 4.1 Drivers
- 4.1.1 Growing Demand for Edible Oils
- 4.2 Restraints
- 4.2.1 Presence of Alternative Products and Technologies
- 4.3 Industry Value Chain Analysis
- 4.4 Porter's Five Forces Analysis
- 4.4.1 Bargaining Power of Suppliers
- 4.4.2 Bargaining Power of Consumers
- 4.4.3 Threat of New Entrants
- 4.4.4 Threat of Substitute Products and Services
- 4.4.5 Degree of Competition
5 MARKET SEGMENTATION (Market Size in Value)
- 5.1 Application
- 5.1.1 Edible Oil and Fats
- 5.1.2 Mineral Oil and Lubricants
- 5.1.3 Other Applications (Chemical, Biodiesel, etc.)
- 5.2 Geography
- 5.2.1 Asia-Pacific
- 5.2.1.1 China
- 5.2.1.2 India
- 5.2.1.3 Japan
- 5.2.1.4 South Korea
- 5.2.1.5 Rest of Asia-Pacific
- 5.2.2 North America
- 5.2.2.1 United States
- 5.2.2.2 Canada
- 5.2.2.3 Mexico
- 5.2.3 Europe
- 5.2.3.1 Germany
- 5.2.3.2 United Kingdom
- 5.2.3.3 Italy
- 5.2.3.4 France
- 5.2.3.5 Rest of Europe
- 5.2.4 South America
- 5.2.4.1 Brazil
- 5.2.4.2 Argentina
- 5.2.4.3 Rest of South America
- 5.2.5 Middle East and Africa
- 5.2.5.1 Saudi Arabia
- 5.2.5.2 South Africa
- 5.2.5.3 Rest of Middle East and Africa
- 5.2.1 Asia-Pacific
6 COMPETITIVE LANDSCAPE
- 6.1 Mergers and Acquisitions, Joint Ventures, Collaborations, and Agreements
- 6.2 Market Ranking Analysis
- 6.3 Strategies Adopted by Leading Players
- 6.4 Company Profiles
- 6.4.1 Ashapura Perfoclay Limited (APL)
- 6.4.2 Clariant
- 6.4.3 Global Bleach Chem Pvt. Ltd
- 6.4.4 Hrp Industries
- 6.4.5 Indian Clay And Mineral Co.
- 6.4.6 Musim Mas Holdings Pte Ltd
- 6.4.7 Oil-dri Corporation of America
- 6.4.8 Phoenix Chemicals (Pvt.) Ltd
- 6.4.9 Refoil Earth Pvt. Ltd
- 6.4.10 Shell Plc (ecooils Limited)
- 6.4.11 Taiko Group of Companies (Taiko Bleaching Earth Sdn. Bhd.)
- 6.4.12 The W Clay Industries Sdn Bhd
7 MARKET OPPORTUNITIES AND FUTURE TRENDS
- 7.1 Increasing Production of Bio-diesel
 活性黏土市場:按類型、原料和應用分類-2026-2032年全球市場預測
 漂白土市場規模、佔有率、成長及全球產業分析:按類型、應用和地區分類,並預測至2026-2034年漂白黏土市場:依原料、類型、活化製程、應用和最終用途分類-2026-2032年全球預測
 2026年全球活性漂白土市場報告2026年全球漂白土市場報告
 活性漂白土市場規模、佔有率及成長分析(按類型、技術、應用和地區分類)-產業預測,2026-2033年
 全球活性漂白土市場全球活性漂白土市場規模(按應用、地區、範圍和預測)
 活性白土市場規模、佔有率、趨勢分析報告:按應用、地區、細分市場預測,2025-2030 年