


 |
市場調查報告書
商品編碼
1687789
合成石墨:市場佔有率分析、行業趨勢和統計數據、成長預測(2025-2030 年)Synthetic Graphite - Market Share Analysis, Industry Trends & Statistics, Growth Forecasts (2025 - 2030) |
||||||
※ 本網頁內容可能與最新版本有所差異。詳細情況請與我們聯繫。
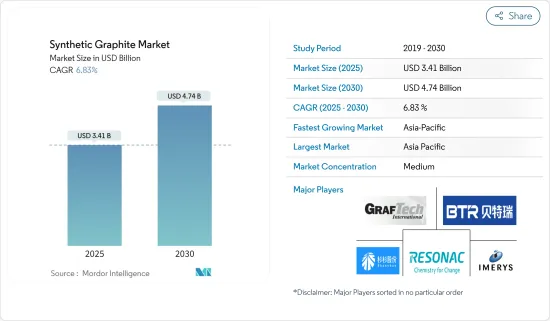
合成石墨市場規模預計在 2025 年達到 34.1 億美元,預計到 2030 年將達到 47.4 億美元,預測期內(2025-2030 年)的複合年成長率為 6.83%。
合成石墨市場因 COVID-19 而遭遇挫折。全球停工和嚴格的政府限制已迫使大面積製造工廠關閉。然而,預計市場將在 2021 年復甦,並在未來幾年經歷顯著成長。
主要亮點
- 短期內,電動車需求的增加以及鋼鐵生產中電弧爐製程的使用日益增多是推動研究市場需求的關鍵因素。
- 然而,嚴格的環境法規和高昂的石墨生產成本預計將阻礙市場成長。
- 然而,石墨烯和生物石墨作為永續電池材料來源的日益普及預計將為該市場創造新的商機。
- 預計亞太地區將主導全球市場,其中中國和印度的需求將佔據大部分市場佔有率。
合成石墨市場趨勢
冶金領域佔據市場主導地位
- 石墨在冶金學中有廣泛的應用,包括電極、耐火材料、磚塊和整體坩堝。
- 在電弧爐(EAF)製程中,人造石墨作為陽極來生產鋼、鐵合金和鋁。
- 冶金應用利用合成石墨電極作為能源來源。這些應用包括熔化廢鋼、精製陶瓷材料和生產碳化鈣等化學品,所有這些都需要高溫、清潔能源來源。
- 全球粗鋼和鋁產量的增加將促進人造石墨的冶金應用。然而,金屬產量的波動可能會為市場需求帶來不確定性。
- 根據電流能力,合成石墨電極有多種等級:超高高功率(UHP)、高功率(HP)和常規功率(RP)。
- 根據世界鋼鐵協會(Worldsteel)的資料,預計2024年9月全球粗鋼產量將從2024年8月的1.446億噸下降至1.436億噸。這些數據凸顯了鋼鐵業面臨的挑戰,但同時,也受新興國家基礎建設計劃推動,鋼鐵需求復甦即將到來。
- 此外,中國、美國等國家鋼鐵產能的擴張,也進一步拉動了全球鋼鐵產量。
- 採用電弧爐製程生產的鋼材的需求正在大幅成長。電弧爐較低的產能強度和增強的彈性,加上轉爐製程對環境的影響,預計將推動電弧爐在粗鋼生產中的應用,尤其是在已開發國家。
- 中國是世界上最大的鋼鐵生產國,正在調整其鋼鐵生產策略以符合其脫碳目標。從2022年底到2024年,中國宣布運作約16座新的電弧爐,同時逐步淘汰老化的粗鋼產能。透過此次推廣,目標是到2025年將電弧爐煉鋼比例提高到15-20%。
- 全球第四大粗鋼生產美國公佈,2024 年 9 月美國粗鋼產量為 670 萬噸,較 2023 年同期小幅成長 1.2%。但根據世界鋼鐵協會的數據,全年產量為 60.3 噸,下降 1.6%。
- 德國呈現正向趨勢,預估2024年9月產量年增4.3%,達300萬噸。根據世界鋼鐵協會的資料,德國全年產量達2,840萬噸,顯著增加4%。
- 2024 年 9 月產量為 2.8 噸,較 2023 年同期成長 9.9%。世界鋼鐵協會報告稱,巴西全年產量增加 4.4%,達到 2,520 萬噸。
- 鋼鐵用於許多不同的領域,包括建築、鐵路、汽車製造以及資本財和消費品的生產。過去十年,開發中國家工業化進程加快,大大刺激了鋼鐵需求。
- 鑑於這一發展軌跡,全球鋼鐵業的預期成長將推動對冶金應用的需求,並進一步推動所研究市場的擴張。
亞太地區佔市場主導地位
- 亞太地區將引領人造石墨市場,並將成為預測期內成長最快的地區。這一成長主要得益於不斷成長的需求,尤其是中國、印度、韓國、日本和東南亞國家對冶金、零件、電池和核能等各種應用的需求。
- 中國是世界領先的鋼鐵生產國,供應國內和國際市場。根據世界鋼鐵協會的資料,儘管中國仍保持最大生產國地位,但 2024 年 9 月產量下降 6.1%,至總合。全年數據顯示,中國產量為 768.5 噸,較 2023 年下降 3.6%。
- 中國在全球合成石墨生產和消費領域仍佔據主導地位。鋰離子電池的整個製造鏈集中在中國,中國是鋰離子電池最大、成長最快的市場,推動了人造石墨市場的擴張。
- 2023年中國鋰離子電池產業維持上升趨勢,總產量較去年與前一年同期比較成長25%。據工業和資訊化部稱,產量超過 940 吉瓦時(GWh)。該產業的產值超過 1.4 兆元(1,970 億美元),到 2023 年將具有巨大的產出。其中,儲能電池新增裝置容量185GWh,累計超過435GWh。
- 印度擁有幾家著名的石墨電極製造商,這些製造商正在提高生產能力以滿足不斷成長的需求。這一趨勢正在推動人造石墨市場的成長。例如,2023年11月,HEG有限公司將其在中央邦的石墨電極產能從每年8萬噸擴大到每年10萬噸。此次擴建耗資 1,200 億印度盧比(143,741,000 美元),使 HEG 成為西半球第三大石墨電極公司。
- 此外,根據美國能源資訊署和核能總署(IAEA)的資料,過去十年,中國增加了超過34吉瓦(GW)的核能發電能力。截至2024年8月,中國營運56座核子反應爐,總合容量為54.3吉瓦。目前還有 27 座核子反應爐正在興建中,這一成長勢必會擴大對核能應用的需求並進一步推動市場擴張。
- 由於這些動態,預計預測期內亞太地區對人造石墨的需求將快速成長。
合成石墨產業概況
合成石墨市場部分整合。主要公司(排名不分先後)包括Resonac Holdings Corporation、GrafTech International、BTR New Material Group、寧波杉杉和Imerys。
其他福利:
- Excel 格式的市場預測 (ME) 表
- 3個月的分析師支持
目錄
第1章 引言
- 調查前提條件
- 研究範圍
第2章調查方法
第3章執行摘要
第4章 市場動態
- 驅動程式
- 電動車需求不斷成長
- 擴大電弧爐製程在鋼鐵生產的應用
- 其他促進因素
- 限制因素
- 嚴格的環境法規
- 石墨生產成本上升
- 其他阻礙因素
- 產業價值鏈分析
- 波特五力分析
- 供應商的議價能力
- 買家的議價能力
- 新進入者的威脅
- 替代品的威脅
- 競爭程度
第5章市場區隔
- 類型
- 石墨負極
- 石墨塊(細碳)
- 其他類型(例如石墨電極)
- 應用
- 冶金
- 部分
- 電池
- 核能
- 其他用途
- 地區
- 亞太地區
- 中國
- 印度
- 日本
- 韓國
- 馬來西亞
- 泰國
- 印尼
- 越南
- 其他亞太地區
- 北美洲
- 美國
- 加拿大
- 墨西哥
- 歐洲
- 德國
- 英國
- 法國
- 義大利
- 西班牙
- 北歐國家
- 土耳其
- 俄羅斯
- 其他歐洲國家
- 南美洲
- 巴西
- 阿根廷
- 哥倫比亞
- 南美洲其他地區
- 中東和非洲
- 沙烏地阿拉伯
- 卡達
- 阿拉伯聯合大公國
- 奈及利亞
- 埃及
- 南非
- 其他中東和非洲地區
- 亞太地區
第6章競爭格局
- 併購、合資、合作與協議
- 市場佔有率(%)**/排名分析
- 主要企業策略
- 公司簡介
- Asbury Carbons
- BTR New Materials Group Co. Ltd
- GrafTech International
- Graphit Kropfmhl GmbH
- Graphite India Limited
- Graphite One
- Imerys
- Jiangxi Zichen Technology Co. Ltd
- Mersen Property
- Mitsubishi Chemical Corporation
- Nippon Carbon Co. Ltd
- NOVONIX Limited
- Resonac Holdings Corporation
- Shamokin Carbons
- Shanghai Shanshan Technology Co. Ltd
- Shenzhen Sinuo Industrial Development Co. Ltd
- Tokai Cobex GmbH
第7章 市場機會與未來趨勢
- 石墨烯日益普及
- 生物石墨作為永續電池材料來源
- 其他機會
The Synthetic Graphite Market size is estimated at USD 3.41 billion in 2025, and is expected to reach USD 4.74 billion by 2030, at a CAGR of 6.83% during the forecast period (2025-2030).
The synthetic graphite market faced setbacks due to COVID-19. Global lockdowns and stringent government regulations led to widespread shutdowns of production hubs. However, the market rebounded in 2021 and is projected to see significant growth in the upcoming years.
Key Highlights
- Over the short term, increasing demand for electric vehicles and growing utilization of electric arc furnace processes for steel production are the major factors driving the demand for the market studied.
- However, strict environmental regulations and the high cost of production of graphite are expected to hinder the market's growth.
- Nevertheless, the growing popularity of graphene and bio-graphite as a sustainable resource for battery material is expected to create new opportunities for the market studied.
- Asia-Pacific region is expected to dominate the market across the world, with the majority of demand coming from China and India.
Synthetic Graphite Market Trends
Metallurgy Segment to Dominate the Market
- Graphite finds diverse applications in metallurgy, including uses in electrodes, refractories, bricks, and monolithic crucibles.
- In the electric arc furnace (EAF) method, synthetic graphite serves as an anode for producing steel, ferroalloys, and aluminum.
- Metallurgical applications utilize synthetic graphite electrodes as energy sources. These applications range from melting scrap iron and refining ceramic materials to manufacturing chemicals like calcium carbide, all of which demand high-temperature and clean energy sources.
- Global increases in crude steel and aluminum production are set to boost synthetic graphite's metallurgical applications. Yet, fluctuations in metal production may introduce uncertainties in market demand.
- Based on electric current capability, synthetic graphite electrodes come in various grades: ultra-high power (UHP), high power (HP), and regular power (RP).
- According to data from the World Steel Association (worldsteel), global crude steel production fell to 143.6 million tonnes (Mt) in September 2024, down from 144.6 million tonnes (Mt) in August 2024. While these figures underscore challenges in the industry, a rebound in steel demand is on the horizon, driven by infrastructure projects in emerging economies.
- Moreover, bolstered steel production capacities in nations like China and the United States, among others have further fueled global steel output.
- The demand for steel produced via the EAF process is growing significantly. EAFs' lower capacity intensity and enhanced resilience, along with the environmental impact of the BOF method, are anticipated to drive the adoption of EAFs in crude steel production, particularly in developed nations.
- China, the world's largest steel producer, is aligning its steelmaking strategy with decarbonization goals. Between late 2022 and 2024, China announced the commissioning of around 16 new EAFs, coinciding with the phasing out of outdated crude steelmaking facilities. This push aims to raise the proportion of EAF-based steel output to 15-20% by 2025.
- The United States, ranked as the fourth-largest producer of crude steel globally, reported a production of 6.7 Mt in September 2024, witnessing a modest increase of 1.2% as compared to the same period of 2023. However, the year-to-date production figures were at 60.3 Mt, indicating a decline of 1.6%, as per the World Steel Association.
- Germany showcased a positive trend, producing an estimated 3 Mt in September 2024, which is a 4.3% increase as compared to the samer peroiod of the previous year. Year-to-date, Germany's production reached 28.4 Mt, marking a notable 4% rise, according to data from the World Steel Association.
- Brazil led the pack with the highest growth, producing 2.8 Mt in September 2024, an impressive increase of 9.9% as compared to the same period of 2023. Year-to-date, Brazil's production stood at 25.2 Mt, up by 4.4%, as reported by the World Steel Association.
- Steel finds applications in diverse sectors, including construction, railroads, automotive manufacturing, and both capital and consumer goods production. Over the past decade, rising industrialization in developing nations has significantly spurred the demand for steel.
- Given this trajectory, the anticipated growth in the global steel sector is poised to elevate demand in metallurgical applications, further propelling the studied market's expansion.
Asia-Pacific Region to Dominate the Market
- Asia-Pacific is set to spearhead the synthetic graphite market, emerging as the region with the swiftest growth during the forecast period. This upswing is largely driven by surging demands across diverse applications, such as metallurgy, components, batteries, and nuclear energy, especially in countries like China, India, South Korea, Japan, and several Southeast Asian nations.
- China stands as the globe's leading producer of iron and steel, with its output serving both domestic and international markets. As per the data from the World Steel Association, while China retained its title as the largest producer, it saw a 6.1% dip in output for September 2024, totaling 77.1 million tonnes (Mt). Year-to-date figures show China's production at 768.5 Mt, reflecting a 3.6% drop from 2023.
- China remains the dominant force in both the production and consumption of synthetic graphite on a global scale. The entire lithium-ion battery manufacturing chain is heavily centered in China, which stands out as the largest and fastest-growing market for these batteries, consequently driving the expansion of the synthetic graphite market.
- In 2023, China's lithium-ion battery sector maintained its upward trajectory, witnessing a 25% year-on-year increase in total output. According to the Ministry of Industry and Information Technology, the output surpassed 940 gigawatt-hours (GWh). Valued at over CNY 1.4 trillion (USD 197 billion), the sector's output in 2023 was significant. Notably, batteries designated for power storage accounted for 185 GWh, with an installed capacity exceeding 435 GWh.
- India is home to several prominent graphite electrode manufacturers, all of whom are ramping up their capacities to cater to the burgeoning demand. This trend is bolstering the growth of the synthetic graphite market. For instance, HEG Limited, in November 2023, augmented its graphite electrode capacity in Madhya Pradesh from 80 kilotons per annum to 100 kilotons per annum. This expansion, costing INR 1,200 crore (USD 143.741 million), catapulted HEG to the position of the third-largest graphite electrode company in the Western hemisphere.
- Furthermore, data from the U.S. Energy Information Administration and the International Atomic Energy Agency reveals that over the last decade, China has added more than 34 gigawatts (GW) of nuclear power capacity. As of August 2024, the nation operates 56 nuclear reactors with a combined net capacity of 54.3 GW. With an additional 27 reactors currently under construction, this growth is poised to amplify the demand for nuclear applications, further propelling the market's expansion.
- Given these dynamics, the Asia-Pacific region is poised for a surge in synthetic graphite demand during the forecast period.
Synthetic Graphite Industry Overview
The synthetic graphite market is partially consolidated in nature. The major players (not in any particular order) include Resonac Holdings Corporation, GrafTech International, BTR New Material Group Co. Ltd, Ningbo Shanshan Co., Ltd., and Imerys, among others.
Additional Benefits:
- The market estimate (ME) sheet in Excel format
- 3 months of analyst support
TABLE OF CONTENTS
1 INTRODUCTION
- 1.1 Study Assumptions
- 1.2 Scope of the Study
2 RESEARCH METHODOLOGY
3 EXECUTIVE SUMMARY
4 MARKET DYNAMICS
- 4.1 Drivers
- 4.1.1 Increasing Demand for Electric Vehicles
- 4.1.2 Growing Utilization of Electric ARC Furnace Process for Steel Production
- 4.1.3 Other Drivers
- 4.2 Restraints
- 4.2.1 Strict Environmental Regulations
- 4.2.2 High Cost of Production of Graphite
- 4.2.3 Other Restraints
- 4.3 Industry Value Chain Analysis
- 4.4 Porter's Five Forces Analysis
- 4.4.1 Bargaining Power of Suppliers
- 4.4.2 Bargaining Power of Buyers
- 4.4.3 Threat of New Entrants
- 4.4.4 Threat of Substitute Products and Services
- 4.4.5 Degree of Competition
5 MARKET SEGMENTATION (Market Size in Value)
- 5.1 Type
- 5.1.1 Graphite Anode
- 5.1.2 Graphite Block (Fine Carbon)
- 5.1.3 Other Types (Graphite Electrode, etc.)
- 5.2 Application
- 5.2.1 Metallurgy
- 5.2.2 Parts and Components
- 5.2.3 Batteries
- 5.2.4 Nuclear
- 5.2.5 Other Applications
- 5.3 Geography
- 5.3.1 Asia-Pacific
- 5.3.1.1 China
- 5.3.1.2 India
- 5.3.1.3 Japan
- 5.3.1.4 South Korea
- 5.3.1.5 Malaysia
- 5.3.1.6 Thailand
- 5.3.1.7 Indonesia
- 5.3.1.8 Vietnam
- 5.3.1.9 Rest of Asia-Pacific
- 5.3.2 North America
- 5.3.2.1 United States
- 5.3.2.2 Canada
- 5.3.2.3 Mexico
- 5.3.3 Europe
- 5.3.3.1 Germany
- 5.3.3.2 United Kingdom
- 5.3.3.3 France
- 5.3.3.4 Italy
- 5.3.3.5 Spain
- 5.3.3.6 NORDIC Countries
- 5.3.3.7 Turkey
- 5.3.3.8 Russia
- 5.3.3.9 Rest of Europe
- 5.3.4 South America
- 5.3.4.1 Brazil
- 5.3.4.2 Argentina
- 5.3.4.3 Colombia
- 5.3.4.4 Rest of South America
- 5.3.5 Middle East and Africa
- 5.3.5.1 Saudi Arabia
- 5.3.5.2 Qatar
- 5.3.5.3 United Arab Emirates
- 5.3.5.4 Nigeria
- 5.3.5.5 Egypt
- 5.3.5.6 South Africa
- 5.3.5.7 Rest of Middle-East and Africa
- 5.3.1 Asia-Pacific
6 COMPETITIVE LANDSCAPE
- 6.1 Mergers and Acquisitions, Joint Ventures, Collaborations, and Agreements
- 6.2 Market Share(%)**/Ranking Analysis
- 6.3 Strategies Adopted by Major Players
- 6.4 Company Profiles
- 6.4.1 Asbury Carbons
- 6.4.2 BTR New Materials Group Co. Ltd
- 6.4.3 GrafTech International
- 6.4.4 Graphit Kropfmhl GmbH
- 6.4.5 Graphite India Limited
- 6.4.6 Graphite One
- 6.4.7 Imerys
- 6.4.8 Jiangxi Zichen Technology Co. Ltd
- 6.4.9 Mersen Property
- 6.4.10 Mitsubishi Chemical Corporation
- 6.4.11 Nippon Carbon Co. Ltd
- 6.4.12 NOVONIX Limited
- 6.4.13 Resonac Holdings Corporation
- 6.4.14 Shamokin Carbons
- 6.4.15 Shanghai Shanshan Technology Co. Ltd
- 6.4.16 Shenzhen Sinuo Industrial Development Co. Ltd
- 6.4.17 Tokai Cobex GmbH
7 MARKET OPPORTUNITIES AND FUTURE TRENDS
- 7.1 Growing Popularity of Graphene
- 7.2 Bio-graphite as a Sustainable Resource for Battery Material
- 7.3 Other Opportunities
 2025年全球合成石墨材料市場報告
 合成石墨市場規模、佔有率、趨勢分析報告:按產品、應用、地區、細分市場預測,2025-2030 年
 人造石墨市場,規模,佔有率,趨勢,產業分析報告:各產品,各用途,各地區,2025年~2034年的市場預測
 合成石墨市場規模、佔有率、成長分析(按產品、應用、等級、最終用戶、地區)- 2025-2032 年產業預測
 2025-2029年全球合成石墨市場
 全球合成石墨市場規模(按產品類型、最終用戶產業、應用、區域範圍和預測)全球合成石墨市場研究報告 - 產業分析、規模、佔有率、成長、趨勢和預測 2025 年至 2033 年全球合成石墨市場:預測(2025-2030)全球合成石墨市場
 人造石墨的全球市場:洞察與預測(~2030年)