


 |
市場調查報告書
商品編碼
1687725
固氮菌:市場佔有率分析、產業趨勢與統計、成長預測(2025-2030 年)Azotobacter - Market Share Analysis, Industry Trends & Statistics, Growth Forecasts (2025 - 2030) |
||||||
※ 本網頁內容可能與最新版本有所差異。詳細情況請與我們聯繫。
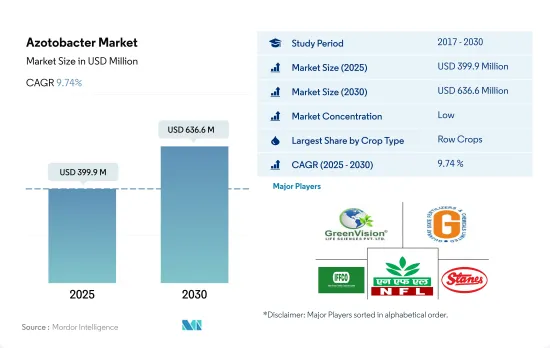
固氮菌市場規模預計在 2025 年為 3.999 億美元,預計到 2030 年將達到 6.366 億美元,預測期內(2025-2030 年)的複合年成長率為 9.74%。
- 固氮菌是指不依賴宿主植物,在需氧或厭氧條件下進行生物固氮的獨立生存的細菌。 2022年,固氮菌生物肥料佔全球生物肥料市場的11.3%。
- 過去一段時間,全球作物作物種植面積增加了 29.1%,從 2017 年的 1,110 萬公頃增加到 2022 年的 1,440 萬公頃。 2022 年,連續作物佔有機種植面積的最大佔有率,為 67.5%,其次是園藝作物,佔 17.5%,經濟作物佔 15.1%。
- 水稻、大麥、玉米、小麥、油菜籽、向日葵、大豆等主要田間作物在世界各地種植。全球固氮菌市場以作物為主,到 2022 年將佔 76.9% 的市佔率。固氮菌生物肥料適用於水稻、小麥、小米、棉花、番茄、高麗菜、芥菜和向日葵等非常規作物。
- 固氮菌在園藝作物中的使用正在增加,因為使用固氮菌生物肥料代替或與各種無機固氮菌結合使用可以提高各種園藝作物的果實產量。產量和果實的增加不僅是由於固氮能力,而且還由於固氮菌能夠增加其他營養物質透過植物葉片從根部到花朵的轉運。
- 過量施用氮肥與水體優養化、溫室效應、酸雨等環境問題有關。固氮菌生物肥料可以為植物提供所需的氮,且不會過量。受這些因素的推動,全球固氮菌生物肥料市場預計在 2023-2029 年期間的複合年成長率為 9.5%。
- 氮(N)對於提高作物產量至關重要,並且可以改變作物抵禦食草動物的能力。為了最大限度地提高植物產量和盈利,氮肥的施用頻率要高於必要水準。固氮菌是減少氮肥施用的可行選擇。
- 亞太地區是固氮菌生物肥料最大的區域市場,2022 年的市場規模為 1.382 億美元。中國和印度是亞太地區的主要各國市場,分別佔固氮菌市場佔有率的 99.2% 和 0.2%。中國是世界上氮肥消費量最高的國家。氮肥的使用極大地促進了中國的糧食生產,但也帶來了前所未有的生物地球化學循環變化,使陸地和水生生態系統面臨風險。中國的化肥政策改革將有助於減少氮肥的使用及其造成的氮污染。固氮菌生物肥料還有可能減少合成氮肥的使用。
- 在印度,根據國家油籽和油棕計畫 (NMOOP),政府正在提供財政援助,包括為各種成分(如生物肥料、餵養根瘤菌培養物/磷酸鹽溶解細菌/鋅溶解細菌/固氮菌/菌根真菌、蚯蚓堆肥等)提供每公頃 300 印度盧比的 50% 補貼。這些因素預計將在 2023 年至 2029 年期間推動固氮菌生物肥料市場的發展。
- 北美是全球固氮菌市場第二大區域。美國和加拿大憑藉對有機農業的重視,主導了北美市場。
全球固氮菌市場趨勢
在北美和歐洲,由於人們對有機農業的認知不斷提高以及政府的舉措,有機農業產量達到了歷史最高水準。
- 有機農業已成為永續糧食系統的主要貢獻者,並在全球 187 個國家實踐。截至2021年,全球有機農地面積為7,230萬公頃,2018年至2021年間各地區平均成長2.9%。有機種植面積為1,440萬公頃,佔有機農地總面積的19.9%。
- 有機農業最強大的市場是北美和歐洲,這兩個地區佔世界有機種植面積的 41.0%。 2022年,歐洲將擁有650萬公頃有機耕地,佔總有機耕地面積的44.1%。北美和歐洲最重要的有機種植作物是蘋果、草莓、穀物和橄欖。
- 亞太地區的新興國家也正在加入有機農業運動,並在生產和供應新鮮有機農產品方面實現自給自足,以滿足國內需求。有機農業趨勢在亞太地區日益興起,2017 年至 2022 年間,該地區的有機土地面積將增加 18.8%。該地區政府的主要措施也在有機農業擴張趨勢中發揮了關鍵作用。例如,日本的食品、農業和農村基本計畫旨在2030年將有機農場和有機農地的數量增加兩倍。
- 有機農業的成長源於人們對其益處的認知不斷提高,例如促進土壤健康、減少環境影響和生產更健康的食品。
人均有機食品支出的成長主要出現在美國和德國,這是由消費者對更健康、更永續食品的需求所推動的。
- 過去幾年,有機食品市場經歷了顯著成長,全球銷售額預計將從 2012 年的 708 億美元成長到 2020 年的 1,206 億美元。有機食品的趨勢受到多種因素的推動,包括消費者對更健康、更永續的食品選擇的需求不斷成長,以及對傳統農業對環境影響的認知不斷提高。預計未來幾年全球有機食品市場將持續維持成長趨勢。
- 根據有機貿易協會 2021 年的一項調查,當年有機水果和蔬菜的銷售量成長了約 4.5%,佔有機產品總銷量的 15%。北美在有機產品平均支出方面佔據市場主導地位,2021年美國的人均支出達到186.7美元,是北美國家中最高的。歐洲有機食品市場預計也將強勁成長,其中德國 2021 年的人均有機食品支出最高,達到 75.6 美元。
- 有機食品市場仍由消費者可支配收入較高的已開發國家主導,但有機食品市場在新興國家預計也會成長。例如,亞太地區的工人階級不斷壯大,這使得有機食品更容易取得且價格更便宜,有助於擴大市場。
固氮菌產業概況
固氮菌市場較為分散,前五大企業佔14.24%。市場的主要企業是:Green Vision Life Sciences、Gujarat State Fertilizers & Chemicals Ltd、Indian Farmers Fertiliser Cooperative Limited、National Fertilizers Limited 和 T.Stanes and Company Limited(按字母順序排列)。
其他福利
- Excel 格式的市場預測 (ME) 表
- 3 個月的分析師支持
目錄
第 1 章執行摘要和主要發現
第2章 報告要約
第 3 章 簡介
- 研究假設和市場定義
- 研究範圍
- 調查方法
第4章 產業主要趨勢
- 有機栽培面積
- 有機產品人均支出
- 法律規範
- 阿根廷
- 澳洲
- 巴西
- 加拿大
- 中國
- 埃及
- 法國
- 德國
- 印度
- 印尼
- 義大利
- 日本
- 墨西哥
- 荷蘭
- 奈及利亞
- 菲律賓
- 俄羅斯
- 南非
- 西班牙
- 泰國
- 土耳其
- 英國
- 美國
- 越南
- 價值鏈與通路分析
第5章 市場區隔
- 作物類型
- 經濟作物
- 園藝作物
- 耕作作物
- 地區
- 非洲
- 按國家
- 埃及
- 奈及利亞
- 南非
- 非洲其他地區
- 亞太地區
- 按國家
- 澳洲
- 中國
- 印度
- 印尼
- 日本
- 菲律賓
- 泰國
- 越南
- 其他亞太地區
- 歐洲
- 按國家
- 法國
- 德國
- 義大利
- 荷蘭
- 俄羅斯
- 西班牙
- 土耳其
- 英國
- 其他歐洲國家
- 中東
- 按國家
- 伊朗
- 沙烏地阿拉伯
- 其他中東地區
- 北美洲
- 按國家
- 加拿大
- 墨西哥
- 美國
- 北美其他地區
- 南美洲
- 按國家
- 阿根廷
- 巴西
- 南美洲其他地區
- 非洲
第6章 競爭格局
- 主要策略趨勢
- 市場佔有率分析
- 業務狀況
- 公司簡介.
- Ezzy Bioscience Pvt. Ltd
- Green Vision Life Sciences
- Gujarat State Fertilizers & Chemicals Ltd
- Indian Farmers Fertiliser Cooperative Limited
- Indogulf BioAg LLC(Biotech Division of Indogulf Company)
- IPL Biologicals Limited
- Jaipur Bio Fertilizers
- National Fertilizers Limited
- Samriddhi Crops India Pvt. Ltd
- T.Stanes and Company Limited
第7章:執行長的關鍵策略問題
第 8 章 附錄
- 世界概況
- 概述
- 五力分析框架
- 全球價值鏈分析
- 市場動態(DRO)
- 資訊來源和進一步閱讀
- 圖片列表
- 關鍵見解
- 資料包
- 詞彙表
The Azotobacter Market size is estimated at 399.9 million USD in 2025, and is expected to reach 636.6 million USD by 2030, growing at a CAGR of 9.74% during the forecast period (2025-2030).
- Azotobacter refers to free-living bacteria that perform biological nitrogen fixation aerobically or anaerobically without depending on the host plants. Azotobacter biofertilizers accounted for an 11.3% share of the global biofertilizers market in 2022.
- The global area under organic crop cultivation increased by 29.1% during the historical period, rising from 11.1 million hectares in 2017 to 14.4 million hectares in 2022. In 2022, row crops accounted for the largest area under organic cultivation, with a 67.5% share, followed by horticulture crops and cash crops, with shares of 17.5% and 15.1%, respectively.
- Rice, barley, corn, wheat, rapeseed, sunflower, soybean, and other major field crops are grown worldwide. Row crops dominate the global Azotobacter market, accounting for 76.9% of the market in 2022. Azotobacter biofertilizers are useful for non-leguminous crops like paddy, wheat, millet, cotton, tomato, cabbage, mustard, and sunflower.
- The usage of Azotobacter in horticulture crops is increasing as the application of Azotobacter biofertilizer by replacing or in conjunction with various inorganic fertilizers is capable of increasing the fruit yield in various horticultural crops. The increase in yield and fruit set is not only attributed to its nitrogen-fixing ability but also due to Azotobacter's ability to increase the translocation of other nutrients from root to flower via plant foliage.
- Excessive nitrogen fertilizer application has been linked to environmental issues such as eutrophication, the greenhouse effect, and acid rain. Azotobacter biofertilizers can provide plants with the necessary nitrogen without overdosing them. These factors are anticipated to drive the global Azotobacter biofertilizers market to record a CAGR of 9.5% between 2023 and 2029.
- Nitrogen (N) is essential for increasing crop yields and can alter crops' ability to defend against herbivores. N-fertilizer is applied more frequently than required to maximize plant yield and economic profitability. Azotobacter is a viable option for reducing N fertilizer application.
- Asia-Pacific is the largest regional market for Azotobacter biofertilizers, accounting for a value of USD 138.2 million in 2022. China and India are the major country-wise markets in Asia-Pacific, accounting for shares of 99.2% and 0.2%, respectively, in the Azotobacter market. China has the highest nitrogen (N) fertilizer consumption rate in the world. While N fertilizer use has greatly aided China's food production, it has also resulted in unprecedented changes in biogeochemical cycles and endangered terrestrial and aquatic ecosystems. Fertilizer policy reforms in China can help reduce N fertilizer use and the resultant N pollution. Azotobacter biofertilizers also have the potential to reduce the use of synthetic N-based fertilizers.
- In India, under the National Mission on Oilseeds and Oil Palm (NMOOP), financial assistance, including a 50% subsidy to the tune of INR 300/ha, is being given for different components like biofertilizers, supply Rhizobium culture/Phosphate solubilizing bacteria/Zinc solubilizing bacteria/Azatobacter/Mycorrhiza, and vermicompost. These factors are expected to boost the market for Azotobacter biofertilizers between 2023 and 2029.
- North America is the second-largest regional segment of the global Azotobacter market. The United States and Canada dominate the North American market due to their efforts to achieve organic farming.
Global Azotobacter Market Trends
Organic production is at an all-time high in North America and Europe, due to the increasing awareness and Government initiatives.
- Organic agriculture has emerged as a significant contributor to sustainable food systems, with 187 countries practicing it globally. As of 2021, there was 72.3 million ha of organic agricultural land worldwide, with an average increase of 2.9% across all regions from 2018 to 2021. Organic arable land accounted for 14.4 million ha, representing 19.9% of the total organic agricultural land.
- The strongest markets for organic farming are North America and Europe, accounting for 41.0% of the global organic arable land. In 2022, Europe had 6.5 million ha of organic arable land, equivalent to 44.1% of the overall organic arable agricultural area. The most significant crops grown organically in North America and Europe are apples, strawberries, cereals, and olives.
- Developing countries in Asia-Pacific are also joining the organic agriculture movement and becoming self-sufficient in producing and providing fresh organic produce to meet their domestic demand. The trend of organic farming is gaining momentum in Asia-Pacific, with the region recording an 18.8% increase in organic arable land from 2017 to 2022. The major initiatives by governments in the region also play a vital role in the growing trend of organic farming. For example, Japan's Basic Plan for Food, Agriculture, and Rural Areas aims to triple the number of organic farmers and lands by 2030.
- The growth of organic agriculture is driven by the rising awareness of the benefits of organic farming, such as promoting soil health, reducing environmental impacts, and producing healthier food.
Per capita spending of organic food majorly observed in United States and Germany, attributed to the consumer demand for healthier and sustainable food
- The organic food market experienced significant growth in the past few years, with global sales reaching USD 120.6 billion in 2020, up from USD 70.8 billion in 2012. The trend toward organic food is being driven by several factors, such as increasing consumer demand for healthier, more sustainable food options and a growing awareness of the environmental impact of conventional agriculture. The global organic food market is expected to continue its growth trend over the coming years.
- According to a survey conducted by the Organic Trade Association in 2021, sales of organic fruits and vegetables increased by around 4.5% in the same year, accounting for 15% of the overall organic sales. North America dominates the market in terms of average spending on organic products, with per capita spending in the United States reaching USD 186.7 in 2021, the highest among all North American countries. Europe is also expected to experience significant growth in the organic food market, with Germany accounting for the highest per capita spending of USD 75.6 in 2021.
- While the organic food market is still dominated by developed countries with high consumer disposable incomes, it is also expected to grow in developing nations. For example, the increasing number of working-class people in the Asia-Pacific region may contribute to the market's expansion due to the growing availability and affordability of organic food products.
Azotobacter Industry Overview
The Azotobacter Market is fragmented, with the top five companies occupying 14.24%. The major players in this market are Green Vision Life Sciences, Gujarat State Fertilizers & Chemicals Ltd, Indian Farmers Fertiliser Cooperative Limited, National Fertilizers Limited and T.Stanes and Company Limited (sorted alphabetically).
Additional Benefits:
- The market estimate (ME) sheet in Excel format
- 3 months of analyst support
TABLE OF CONTENTS
1 EXECUTIVE SUMMARY & KEY FINDINGS
2 REPORT OFFERS
3 INTRODUCTION
- 3.1 Study Assumptions & Market Definition
- 3.2 Scope of the Study
- 3.3 Research Methodology
4 KEY INDUSTRY TRENDS
- 4.1 Area Under Organic Cultivation
- 4.2 Per Capita Spending On Organic Products
- 4.3 Regulatory Framework
- 4.3.1 Argentina
- 4.3.2 Australia
- 4.3.3 Brazil
- 4.3.4 Canada
- 4.3.5 China
- 4.3.6 Egypt
- 4.3.7 France
- 4.3.8 Germany
- 4.3.9 India
- 4.3.10 Indonesia
- 4.3.11 Italy
- 4.3.12 Japan
- 4.3.13 Mexico
- 4.3.14 Netherlands
- 4.3.15 Nigeria
- 4.3.16 Philippines
- 4.3.17 Russia
- 4.3.18 South Africa
- 4.3.19 Spain
- 4.3.20 Thailand
- 4.3.21 Turkey
- 4.3.22 United Kingdom
- 4.3.23 United States
- 4.3.24 Vietnam
- 4.4 Value Chain & Distribution Channel Analysis
5 MARKET SEGMENTATION (includes market size in Value in USD and Volume, Forecasts up to 2030 and analysis of growth prospects)
- 5.1 Crop Type
- 5.1.1 Cash Crops
- 5.1.2 Horticultural Crops
- 5.1.3 Row Crops
- 5.2 Region
- 5.2.1 Africa
- 5.2.1.1 By Country
- 5.2.1.1.1 Egypt
- 5.2.1.1.2 Nigeria
- 5.2.1.1.3 South Africa
- 5.2.1.1.4 Rest of Africa
- 5.2.2 Asia-Pacific
- 5.2.2.1 By Country
- 5.2.2.1.1 Australia
- 5.2.2.1.2 China
- 5.2.2.1.3 India
- 5.2.2.1.4 Indonesia
- 5.2.2.1.5 Japan
- 5.2.2.1.6 Philippines
- 5.2.2.1.7 Thailand
- 5.2.2.1.8 Vietnam
- 5.2.2.1.9 Rest of Asia-Pacific
- 5.2.3 Europe
- 5.2.3.1 By Country
- 5.2.3.1.1 France
- 5.2.3.1.2 Germany
- 5.2.3.1.3 Italy
- 5.2.3.1.4 Netherlands
- 5.2.3.1.5 Russia
- 5.2.3.1.6 Spain
- 5.2.3.1.7 Turkey
- 5.2.3.1.8 United Kingdom
- 5.2.3.1.9 Rest of Europe
- 5.2.4 Middle East
- 5.2.4.1 By Country
- 5.2.4.1.1 Iran
- 5.2.4.1.2 Saudi Arabia
- 5.2.4.1.3 Rest of Middle East
- 5.2.5 North America
- 5.2.5.1 By Country
- 5.2.5.1.1 Canada
- 5.2.5.1.2 Mexico
- 5.2.5.1.3 United States
- 5.2.5.1.4 Rest of North America
- 5.2.6 South America
- 5.2.6.1 By Country
- 5.2.6.1.1 Argentina
- 5.2.6.1.2 Brazil
- 5.2.6.1.3 Rest of South America
- 5.2.1 Africa
6 COMPETITIVE LANDSCAPE
- 6.1 Key Strategic Moves
- 6.2 Market Share Analysis
- 6.3 Company Landscape
- 6.4 Company Profiles (includes Global Level Overview, Market Level Overview, Core Business Segments, Financials, Headcount, Key Information, Market Rank, Market Share, Products and Services, and Analysis of Recent Developments).
- 6.4.1 Ezzy Bioscience Pvt. Ltd
- 6.4.2 Green Vision Life Sciences
- 6.4.3 Gujarat State Fertilizers & Chemicals Ltd
- 6.4.4 Indian Farmers Fertiliser Cooperative Limited
- 6.4.5 Indogulf BioAg LLC (Biotech Division of Indogulf Company)
- 6.4.6 IPL Biologicals Limited
- 6.4.7 Jaipur Bio Fertilizers
- 6.4.8 National Fertilizers Limited
- 6.4.9 Samriddhi Crops India Pvt. Ltd
- 6.4.10 T.Stanes and Company Limited
7 KEY STRATEGIC QUESTIONS FOR AGRICULTURAL BIOLOGICALS CEOS
8 APPENDIX
- 8.1 Global Overview
- 8.1.1 Overview
- 8.1.2 Porter's Five Forces Framework
- 8.1.3 Global Value Chain Analysis
- 8.1.4 Market Dynamics (DROs)
- 8.2 Sources & References
- 8.3 List of Tables & Figures
- 8.4 Primary Insights
- 8.5 Data Pack
- 8.6 Glossary of Terms
 自動化微生物檢測系統市場:按產品類型、最終用戶、技術和應用分類的全球市場預測 - 2026-2032 年微生物解決方案市場:按產品類型、製劑形式、微生物類型、應用、最終用戶和分銷管道分類-2026-2032年全球預測微生物材料市場:按應用、材料類型和微生物來源分類,全球預測(2026-2032年)
 快速微生物檢測市場分析及預測(至2035年):類型、產品類型、服務、技術、應用、最終用戶、流程、部署類型、功能與設備
 微生物控制化學品市場規模、佔有率和成長分析(按應用、類型、配方、最終用途和地區分類)—產業預測(2026-2033 年)
 2025年微生物鑑定方法全球市場報告鳶尾花收集器市場:按組件、按最終用戶 - 2025-2030 年全球預測
 全球微生物產品市場,2024-2028
 微生物控制化學品市場規模、佔有率、預測和趨勢分析:按方法、按類型、按最終用途行業 - 2031年世界預計到今年
 全球微生物產品市場