


 |
市場調查報告書
商品編碼
1687251
石油與天然氣資本支出展望 -市場佔有率分析、產業趨勢與統計、成長預測(2025-2030 年)Oil and Gas CAPEX Outlook - Market Share Analysis, Industry Trends & Statistics, Growth Forecasts (2025 - 2030) |
||||||
價格
※ 本網頁內容可能與最新版本有所差異。詳細情況請與我們聯繫。
簡介目錄
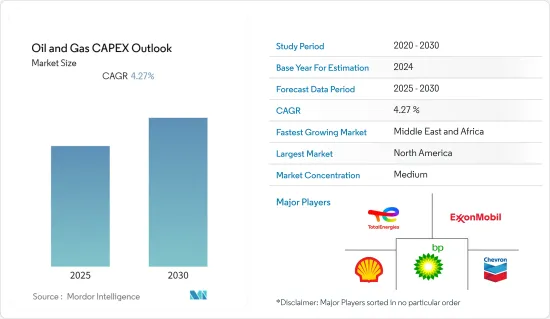
預計預測期內石油和天然氣資本支出市場複合年成長率將達到 4.27%。
2020年市場受到了新冠疫情的影響,目前市場已恢復到疫情前的水準。
關鍵亮點
- 從中期來看,由於能源需求的快速成長、陸上蘊藏量的枯竭以及各國政府努力探勘海上資源,對海上石油和天然氣活動的投資不斷增加,預計將在未來幾年推動石油和天然氣資本支出市場的成長。
- 另一方面,預計原油和天然氣價格的波動以及全球經濟成長放緩將在預測期內抑製石油和天然氣資本投資。
- 北海、墨西哥灣以及塞內加爾和毛里求斯等新興國家正在進行一些近海、深水和超深水探勘,為增加資本支出提供了充足的機會。
- 得益於全球一體化大型石油公司、國家石油公司的營運以及新的投資,預測期內北美的資本支出增幅最高。
石油和天然氣資本支出市場趨勢
上游產業主導市場
- 隨著新冠疫情封鎖措施放鬆,對石油和天然氣的需求增加,上游石油和天然氣產業的投資開始復甦。需求成長推動油價在2022年回升。例如,2020年原油價格約為每桶41.96美元,但2022年可能達到每桶110美元以上,引發石油和天然氣產業投資激增。
- 預計石油和天然氣資本支出市場將經歷強勁成長,原因是計劃成本降低和投資組合最佳化趨勢帶來更高的盈利、利潤率較低的油田的剝離以及專注於投資利潤率更高的成長機會等因素。
- 上游是最大的產業,可能是資本支出最高的產業。目前,世界各地的國有企業都優先發展國內石油和天然氣計劃,以提高能源安全並減少對外國能源來源的依賴。
- 根據國際能源總署(IEA)的數據,預計2022年全球對石油、天然氣和低碳燃料的投資將達到約1.73兆美元,與前一年同期比較成長6.7%以上。
- 多家石油天然氣巨頭已宣布2023年後資本支出將高於平均水準。例如,2022年12月,雪佛龍公司宣布其2023年有機資本支出預算為:合併子公司140億美元(CAPEX),股權關聯公司30億美元(關聯CAPEX)。
- 雪佛龍公司預計 2023 年上游資本和探勘支出預算約為 115 億美元。上游資本支出包括二疊紀盆地開發活動的 40 多億美元和其他頁岩和緻密資產的約 20 億美元。超過20%的上游資本支出將用於墨西哥灣計劃。
- 印度石油天然氣公司(ONGC)計劃在未來三年(2022-25 會計年度)內投入約 38 億美元的資本支出,擴大其探勘活動。就探勘支出而言,這相當於過去三個會計年度(2019 會計年度-2022 會計年度)支出 25 億美元的 150%。
- 因此,為了滿足全球日益成長的原油和天然氣需求,需要在探勘和生產活動方面投入更多資金,從而推動石油和天然氣產業的資本支出。
北美佔據市場主導地位
- 北美是石油和天然氣行業資本投資最大的市場之一,其中美國處於領先地位,其次是加拿大和墨西哥。美國是美國最大的原油和天然氣生產國,預計未來幾年將滿足全球約60%的石油需求。
- 美國一直處於領先地位,預計在預測期內將繼續主導該地區的石油和天然氣資本支出市場。預測期內,該國的石油和天然氣計劃將佔北美總投資的約70%。在該國所有上游計劃中,預計將超過 80% 為新廠計畫,而預測期內擴建計劃預計將佔剩餘的 20%。
- 根據美國能源資訊署(EIA)的數據,2021年該國原油產量將達到1,124萬桶/日。 2019年原油產量大幅下降。同年,原油產量達到了1,225萬桶/日的歷史最高水準。美國生產的原油比世界上任何其他國家都多。
- 截至 2022 年 2 月,該國正在規劃或宣布的石化工廠資本支出計畫約為 600 億美元。預計這些計劃將在預測期內推動美國下游產業的固定資產資本支出市場。
- 此外,2021年至2023年間,加拿大大型石油和天然氣營運商Enbridge預計將在該國投資總計160億美元。 Tervita 也宣布 2021 年的資本支出約為 6,000 萬美元,而 2020 年為 3,300 萬美元。因此,預計預測期內資本支出將進一步增加。
- 因此,隨著大量石油和天然氣計劃的建設、提案和計劃,預計石油和天然氣資本支出市場在預測期內將顯著成長。
石油和天然氣資本支出產業概覽
全球石油和天然氣資本支出市場適度細分。主要參與企業(不分先後順序)包括英國石油公司、埃克森美孚、道達爾能源公司、雪佛龍公司和殼牌公司。
其他福利
- Excel 格式的市場預測 (ME) 表
- 3個月的分析師支持
目錄
第1章 引言
- 研究範圍
- 市場定義
- 調查前提
第2章調查方法
第3章執行摘要
第4章 市場概述
- 介紹
- 至2028年的市場規模及需求預測(單位:美元)
- 2028年石油產量與消費量預測
- 2028年天然氣產量與消費量預測
- 截至 2028 年的歷史和預測管道裝置容量(公里)
- 緻密油、油砂和深水原油產量的歷史和預測(以千桶/天為基準,至 2030 年)
- 近期趨勢和發展
- 政府法規和政策
- 市場動態
- 驅動程式
- 天然氣需求不斷成長以及天然氣基礎設施的發展
- 海上石油和天然氣探勘活動增加
- 限制因素
- 採用更清潔的替代燃料
- 油價波動劇烈
- 驅動程式
- 供應鏈分析
- 波特五力分析
- 供應商的議價能力
- 消費者議價能力
- 新進入者的威脅
- 替代品的威脅
- 競爭對手之間的競爭
第5章市場區隔
- 部門
- 上游
- 中游
- 下游
- 地點
- 陸上
- 海上
- 地區
- 北美洲
- 美國
- 加拿大
- 墨西哥
- 歐洲
- 德國
- 英國
- 俄羅斯
- 挪威
- 荷蘭
- 其他歐洲國家
- 亞太地區
- 中國
- 印度
- 馬來西亞
- 印尼
- 東南亞國協
- 其他亞太地區
- 南美洲
- 巴西
- 委內瑞拉
- 阿根廷
- 哥倫比亞
- 南美洲其他地區
- 中東和非洲
- 沙烏地阿拉伯
- 阿拉伯聯合大公國
- 埃及
- 奈及利亞
- 其他中東和非洲地區
- 北美洲
第6章競爭格局
- 併購、合資、合作與協議
- 主要企業策略
- 公司簡介
- BP plc
- Shell plc
- Chevron Corporation
- Total Energies SE
- Exxon Mobil Corporation
- Oil and Natural Gas Corporation(ONGC)
- China National Petroleum Corporation(CNPC)
- Cairn Oil & Gas, Vertical of Vedanta Limited
- Petroleo Brasileiro SA
- Equinor ASA
第7章 市場機會與未來趨勢
- 新興市場尚未開發的石油和天然氣潛力
簡介目錄
Product Code: 57110
The Oil and Gas CAPEX Market is expected to register a CAGR of 4.27% during the forecast period.
The market was impacted by COVID-19 in 2020. Presently the market has now reached pre-pandemic levels.
Key Highlights
- Over the medium term, the rising investments in offshore oil & gas activities owing to the surging energy demand, depleting onshore reserves, and efforts from governments across nations to explore their offshore resources are expected to drive the growth of the oil & gas capex market in the coming years.
- On the other hand, volatile crude oil and natural gas prices, coupled with slow economic growth at a global level, are expected to restrain the oil and gas CAPEX during the forecast period.
- Nevertheless, several offshore, deep, and ultra-deepwater explorations in the North Sea, Gulf of Mexico, and developing countries such as Senegal and Mauritiana, provide ample opportunity for increased capital expenditure.
- North America has recorded the highest gains in CAPEX, owing to operations of globally integrated majors, along with national oil companies and new investments during the forecast period.
CAPEX Oil and Gas Market Trends
Upstream Sector to Dominate the Market
- Investment in the upstream oil & gas industry had started recovering after the rise in oil & gas demand amid the opening of the COVID-19 lockdowns. An increase in demand recovered crude oil prices in 2022. For instance, in 2020, crude oil prices were about USD 41.96 per barrel, and in 2022 the prices reached more than USD 110 per barrel, which resulted in a surge in investment in the oil & gas industry.
- The oil and gas CAPEX market is expected to witness significant growth owing to factors, including strong profitability due to a trend toward reducing project costs and optimizing portfolios, which has led to divesting of low-margin fields, as well as a greater emphasis on investments in higher-margin growth opportunities.
- The upstream sector is likely to be the largest segment and the one with the highest CAPEX, as several state-owned companies worldwide are prioritizing domestic oil and gas projects to increase energy security and reduce their dependence upon foreign energy sources.
- According to Internation Energy Agency (IEA), The global oil & gas, low carbon fuel investments reached around USD 1.73 trillion in 2022, representing an increase of more than 6.7% compared to the previous year's value.
- Several oil and gas majors have announced more than average increases in capital expenditures for 2023 and beyond. For instance, in December 2022, Chevron Corporation announced 2023 organic capital expenditure budgets of USD 14 billion for its consolidated subsidiaries (CAPEX) and USD 3 billion for its equity affiliates (affiliate CAPEX).
- Chevron Corporation has planned an upstream capital and exploratory expenditure budget of approximately USD 11.5 billion for 2023. The upstream capex includes more than USD 4 billion for development activities in the Permian Basin and approximately USD 2 billion for other shale and tight assets. More than 20% of the upstream capex is dedicated to Gulf of Mexico projects.
- Over the next three fiscal years, during FY 2022-25, Oil and Natural Gas Corporation (ONGC) planned to increase its exploration activity with capital expenditures of approximately USD 3.8 billion. In terms of exploration expenditures, this represents 150 percent of the USD 2.5 billion spent during the previous three fiscal years (FY 2019-22).
- Hence, to meet the strong global demand for crude oil and natural gas, more investment is required for exploration and production activities, which promulgates the CAPEX in the oil and gas industry.
North America to Dominate the Market
- North America is one of the largest markets in terms of capital expenditure in the oil and gas industry, with the United States being the leader, followed by Canada and Mexico. The United States is a major crude oil and natural gas producer in the world, and the country is expected to cover around 60% of the world's oil demand in the coming years.
- The United States has always been at the forefront in the past and is also expected to dominate the region's oil and gas CAPEX market in the forecast period. The country oil and gas projects accounts for approximately 70% of the total investments in North America during the forecast period. Of the total number of upstream projects in the country, more than 80% are estimated to be the new build while the expansion projects are expected to account for the remaining 20% during the forecast period.
- According to United States Energy Information Administration (EIA), crude oil production in the country record 11.24 million mbpd in 2021. The crude oil production declined significantly in 2019. In the same year, oil production reached the highest point in history with 12.25 million mbpd. The United States produces more oil than any other country in the world.
- As of February 2022, the country has approximately USD 60 billion of CAPEX plans for petrochemical plants that are either under planned or announced stages. The projects are likely to propel the CAPEX market for fixed assets in the downstream sector of the United States during the forecast period.
- Furthermore, in between 2021-2023, a major Canadian oil and gas operator, Enbridge, is expected to invest a total of USD 16 billion in the country. Another company Tervita announced a capital investment of around USD 60 million in 2021 compared to 33 million in 2020. Therefore, the CAPEX is further expected to increase during the forecast period.
- Therefore, with a decent number of several oil & gas projects under construction, proposal, and planning stages, the oil and gas CAPEX market is expected to witness significant growth during the forecast period.
CAPEX Oil and Gas Industry Overview
The global oil and gas CAPEX market is moderately fragmented. Some of the key players (in no particular order) include BP PLC, Exxon Mobil Corporation, TotalEnergies SE, Chevron Corporation, and Shell PLC.
Additional Benefits:
- The market estimate (ME) sheet in Excel format
- 3 months of analyst support
TABLE OF CONTENTS
1 INTRODUCTION
- 1.1 Scope of the Study
- 1.2 Market Definition
- 1.3 Study Assumptions
2 RESEARCH METHODOLOGY
3 EXECUTIVE SUMMARY
4 MARKET OVERVIEW
- 4.1 Introduction
- 4.2 Market Size and Demand Forecast in USD, till 2028
- 4.3 Crude Oil Production and Consumption Forecast, till 2028
- 4.4 Natural Gas Production and Consumption Forecast, till 2028
- 4.5 Installed Pipeline Historic Capacity and Forecast in Kilometers, till 2028
- 4.6 Historic and Production Forecast of Tight Oil, Oil Sands, and Crude from Deepwater in kb/d, until 2030
- 4.7 Recent Trends and Developments
- 4.8 Government Policies and Regulations
- 4.9 Market Dynamics
- 4.9.1 Drivers
- 4.9.1.1 Increasing Demand for Natural Gas and Developing Gas Infrastructure
- 4.9.1.2 Increasing Offshore Oil & Gas Exploration Activities
- 4.9.2 Restraints
- 4.9.2.1 Adoption of Cleaner Alternatives
- 4.9.2.2 High Volatility of Crude Oil Prices
- 4.9.1 Drivers
- 4.10 Supply Chain Analysis
- 4.11 Porter's Five Forces Analysis
- 4.11.1 Bargaining Power of Suppliers
- 4.11.2 Bargaining Power of Consumers
- 4.11.3 Threat of New Entrants
- 4.11.4 Threat of Substitutes Products and Services
- 4.11.5 Intensity of Competitive Rivalry
5 MARKET SEGMENTATION
- 5.1 Sector
- 5.1.1 Upstream
- 5.1.2 Midstream
- 5.1.3 Downstream
- 5.2 Location
- 5.2.1 Onshore
- 5.2.2 Offshore
- 5.3 Geography
- 5.3.1 North America
- 5.3.1.1 United States
- 5.3.1.2 Canada
- 5.3.1.3 Mexico
- 5.3.2 Europe
- 5.3.2.1 Germany
- 5.3.2.2 United Kingdom
- 5.3.2.3 Russia
- 5.3.2.4 Norway
- 5.3.2.5 Netherlands
- 5.3.2.6 Rest of Europe
- 5.3.3 Asia-Pacific
- 5.3.3.1 China
- 5.3.3.2 India
- 5.3.3.3 Malaysia
- 5.3.3.4 Indonesia
- 5.3.3.5 ASEAN Countries
- 5.3.3.6 Rest of Asia-Pacific
- 5.3.4 South America
- 5.3.4.1 Brazil
- 5.3.4.2 Venezuela
- 5.3.4.3 Argentina
- 5.3.4.4 Colombia
- 5.3.4.5 Rest of South America
- 5.3.5 Middle-East and Africa
- 5.3.5.1 Saudi Arabia
- 5.3.5.2 United Arab Emirates (UAE)
- 5.3.5.3 Egypt
- 5.3.5.4 Nigeria
- 5.3.5.5 Rest of Middle East and Africa
- 5.3.1 North America
6 COMPETITIVE LANDSCAPE
- 6.1 Mergers and Acquisitions, Joint Ventures, Collaborations, and Agreements
- 6.2 Strategies Adopted by Leading Players
- 6.3 Company Profiles
- 6.3.1 BP plc
- 6.3.2 Shell plc
- 6.3.3 Chevron Corporation
- 6.3.4 Total Energies SE
- 6.3.5 Exxon Mobil Corporation
- 6.3.6 Oil and Natural Gas Corporation (ONGC)
- 6.3.7 China National Petroleum Corporation (CNPC)
- 6.3.8 Cairn Oil & Gas, Vertical of Vedanta Limited
- 6.3.9 Petroleo Brasileiro SA
- 6.3.10 Equinor ASA
7 MARKET OPPORTUNITIES AND FUTURE TRENDS
- 7.1 Untapped Oil and Gas Potential in Emerging Markets
02-2729-4219
+886-2-2729-4219
 2025年全球石油和天然氣中游設備市場報告
 石油和天然氣工程服務市場按服務類型、計劃類型、合約類型、所用技術、應用和最終用戶分類——2025-2030 年全球預測
 全球減壓氣油市場全球石油和天然氣漁業市場全球上游油氣市場2025年全球真空柴油市場報告2025年全球石油和天然氣基礎設施市場報告2025年全球石油和天然氣測量儀器市場報告
 生產測試市場規模、佔有率及成長分析(按測試類型、測試方法、應用、服務類型和地區)- 產業預測,2025 年至 2032 年
 2021-2031 年石油和天然氣漁業市場規模及預測、全球和區域佔有率、趨勢和成長機會分析報告涵蓋範圍:按產品、應用和地理分類
▼