


 |
市場調查報告書
商品編碼
1686230
聚醯亞胺(PI) -市場佔有率分析、產業趨勢與統計、成長預測(2024-2029)Polyimides (PI) - Market Share Analysis, Industry Trends & Statistics, Growth Forecasts (2024 - 2029) |
||||||
價格
※ 本網頁內容可能與最新版本有所差異。詳細情況請與我們聯繫。
簡介目錄
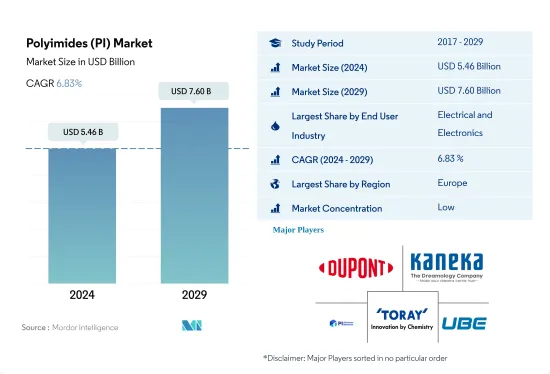
聚醯亞胺 (PI) 市場規模預計在 2024 年為 54.6 億美元,預計到 2029 年將達到 76 億美元,預測期內(2024-2029 年)的複合年成長率為 6.83%。
消費性電子產品需求強勁帶動市場需求
- 聚醯亞胺是一種高性能塑膠,能夠承受高溫和腐蝕環境。它們具有非粘性和低摩擦特性,適用於各種最終用戶行業,包括航太、電子、汽車和通訊。
- 2022 年,電氣和電子產業在銷售方面佔據最大的市場佔有率。隨著企業開始採用在家工作模式,人們開始建立家庭辦公室,消費者開始轉向筆記型電腦、行動電話和智慧型裝置等家用電子電器,這導致家用電子電器的需求激增,從而增加了聚醯亞胺的消費量。預計到 2023 年,全球消費性電子產品銷售額將成長至 11,030 億美元,2023 年至 2027 年的複合年成長率為 2.17%。
- 航太是第二大領域,也是成長最快的領域,預計在預測期內(2023-2029 年)的複合年成長率以金額為準7.78%。這種成長歸因於全球航太零件產量的增加。例如,航太業的生產收入預計將在2022年達到4,660億美元,而2021年為4,300億美元。歐洲航太業是聚醯亞胺的最大消費國,其中法國在2022年佔歐洲市場佔有率的28.83%,成為歐洲最大的聚醯亞胺消費國。法國是多家全球航太零件製造商和飛機製造商的所在地,其中包括達梭航空和空中巴士。聚醯亞胺的需求也受到現有產業的支持。
中國和日本將主導亞太地區PI成長
- 2022 年,亞太地區是聚醯亞胺消費量最大的地區。預計將成為成長第四快的地區(以以金額為準),預測期內的複合年成長率為 7.10%。這一成長是由中國和日本等國家推動的,這兩個國家分別佔該全部區域消費量的59%和13%。
- 中國電子電氣產業是聚醯亞胺的主要消費產業,預計到2022年將佔全國聚醯亞胺總消費量的50%。隨著企業開始採用在家工作模式、人們開始設立家庭辦公室,筆記型電腦、行動電話等消費性電子產品的需求大幅增加,進而帶動聚醯亞胺的需求增加。預計這一趨勢將持續下去,到 2023 年中國家用電子電器產業的銷售額預計將達到 2,576 億美元。
- 阿拉伯聯合大公國是中東地區成長最快的地區之一。預計預測期內(2023-2029 年)其以金額為準複合年成長率為 8.98%。該國的電氣和電子產業是成長最快的終端用戶。預計電氣和電子設備產量將在 2029 年達到 730 億美元,而 2022 年為 390 億美元。預計該國電子產品市場規模將從 2023 年的 24.1 億美元成長到 2027 年的約 33.2 億美元。
全球聚醯亞胺(PI)市場趨勢
電子產業的技術進步可能推動成長
- 電子產品技術創新的快速步伐推動著對更新、更快的電氣和電子產品的持續需求。 2022年,全球電氣及電子產品銷售額預計達到5.807兆美元,其中亞太地區佔74%的市場佔有率,其次是歐洲,佔13%的市場佔有率。預計預測期內全球電氣和電子設備市場複合年成長率將達到 6.61%。
- 2018年,亞太地區經濟成長強勁,受中國、韓國、日本、印度和東南亞國協快速工業化的推動。 2020年,受疫情影響,晶片短缺、供應鏈效率低等因素導致全球電子電氣生產放緩,營收與前一年同期比較增僅0.1%。由於疫情期間人們被迫待在室內,對遠距工作和家庭娛樂消費性電子產品的需求推動了這一成長。
- 預測期內,對數位化、機器人、虛擬實境、擴增實境、物聯網 (IoT) 和 5G 連接等先進技術的需求預計將成長。預計 2027 年全球電氣和電子設備產量將成長 5.9%。由於技術進步,預測期內對消費性電子產品的需求預計將上升。例如,預計2027年全球消費性電子產業收益將達到約9,046億美元,而2023年將達到7,191億美元。因此,預計技術發展將在預測期內引領對電氣和電子產品的需求。
聚醯亞胺(PI)產業概況
聚醯亞胺(PI)市場分散,前五大公司佔32.57%的市佔率。市場的主要企業有:杜邦公司、鐘淵株式會社、PI Advanced Materials、東麗株式會社和宇部興產株式會社(按字母順序排列)。
其他福利
- Excel 格式的市場預測 (ME) 表
- 3個月的分析師支持
目錄
第1章執行摘要和主要發現
第2章 報告要約
第3章 引言
- 研究假設和市場定義
- 研究範圍
- 調查方法
第4章 產業主要趨勢
- 最終用戶趨勢
- 航太
- 車
- 建築與施工
- 電氣和電子
- 包裝
- 法律規範
- 阿根廷
- 澳洲
- 巴西
- 加拿大
- 中國
- EU
- 印度
- 日本
- 馬來西亞
- 墨西哥
- 奈及利亞
- 俄羅斯
- 沙烏地阿拉伯
- 南非
- 韓國
- 阿拉伯聯合大公國
- 英國
- 美國
- 價值鍊和通路分析
第5章市場區隔
- 最終用戶產業
- 航太
- 車
- 電氣和電子
- 工業/機械
- 其他最終用戶產業
- 地區
- 非洲
- 按國家
- 奈及利亞
- 南非
- 其他非洲國家
- 亞太地區
- 按國家
- 澳洲
- 中國
- 印度
- 日本
- 馬來西亞
- 韓國
- 其他亞太地區
- 歐洲
- 按國家
- 法國
- 德國
- 義大利
- 俄羅斯
- 英國
- 其他歐洲國家
- 中東
- 按國家
- 沙烏地阿拉伯
- 阿拉伯聯合大公國
- 其他中東地區
- 北美洲
- 按國家
- 加拿大
- 墨西哥
- 美國
- 南美洲
- 按國家
- 阿根廷
- 巴西
- 南美洲其他地區
- 非洲
第6章 競爭格局
- 關鍵策略趨勢
- 市場佔有率分析
- 商業狀況
- 公司簡介.
- China Wanda Group
- DuPont
- Jiaozuo Tianyi Technology Co., Ltd.
- Kaneka Corporation
- Mitsui Chemicals, Inc.
- PI Advanced Materials Co., Ltd.
- SZRH Film Technology Group
- Taimide Tech. Inc.
- Toray Industries, Inc.
- UBE Corporation
第7章:CEO面臨的關鍵策略問題
第 8 章 附錄
- 世界概況
- 概述
- 五力分析框架(產業吸引力分析)
- 全球價值鏈分析
- 市場動態(DRO)
- 資訊來源及延伸閱讀
- 圖片列表
- 關鍵見解
- 資料包
- 詞彙表
簡介目錄
Product Code: 50844
The Polyimides (PI) Market size is estimated at 5.46 billion USD in 2024, and is expected to reach 7.60 billion USD by 2029, growing at a CAGR of 6.83% during the forecast period (2024-2029).
Significant demand for consumer electronics to aid market demand
- Polyimides are high-performance plastics that can withstand high temperatures and corrosive environments. Due to their non-adhesive and low friction properties, they are suitable for applications in various end-user industries like aerospace, electronics, automotive, and telecommunications.
- The electrical and electronics segment occupied the largest market share by volume in 2022. A significant shift of consumers toward consumer electronics like laptops, mobile phones, and smart devices as companies began adopting work-from-home models and people began setting up home offices caused a surge in demand for consumer electronics, which increased the consumption of polyimides. Global consumer electronics revenue is projected to grow to USD 1103 billion in 2023 and is expected to grow annually by 2.17% between 2023 and 2027.
- Aerospace is the second-largest segment and is likely to register a CAGR of 7.78% by value during the forecast period (2023-2029), making it the fastest-growing segment as well. This growth can be attributed to the increased production of aerospace components worldwide. For instance, aerospace production revenue reached USD 466 billion in 2022 compared to USD 430 billion in 2021. The European aerospace segment is the largest consumer of polyimides, of which France held 28.83% of the European market share by volume in 2022, making it the largest consumer of polyimides in Europe. France is home to multiple global aerospace components and aircraft manufacturers, such as Dassault Aviation and Airbus. The well-established nature of the industry has also supported the demand for polyimides.
China and Japan to dominate Asia-Pacific growth of PI
- Asia-Pacific was the largest segment in terms of consumption of polyimides in 2022. It is predicted to register a CAGR of 7.10% in terms of value during the forecast period, making it the fourth fastest-growing segment. This growth can be attributed to countries like China and Japan, which accounted for 59% and 13%, respectively, of the region's overall polyimide consumption in 2022.
- China's electrical and electronics industry is the major consumer of polyimides, accounting for 50% of the country's overall polyimide consumption in 2022. Owing to a significant increase in the demand for consumer electronics like laptops and mobiles as companies began adopting work-from-home models and people started setting up home offices, the demand for polyimides increased in the country. This trend is expected to continue in the future as China's consumer electronics segment is projected to generate a revenue of USD 257.6 billion by 2023.
- The United Arab Emirates is the fastest-growing segment in the Middle East, making it one of the fastest growing regions. It is likely to register a CAGR of 8.98% in terms of value during the forecast period [2023-2029]. The country's electrical and electronics segment is the fastest-growing end user. Electrical and electronics production is expected to reach USD 73 billion in 2029 compared to USD 39 billion in 2022. The electronics market in the country is projected to reach a market volume of around USD 3.32 billion in 2027 from USD 2.41 billion in 2023.
Global Polyimides (PI) Market Trends
Technological advancements in electronics industry may foster the growth
- The rapid pace of technological innovation in electronic products is driving the consistent demand for new and fast electrical and electronic products. In 2022, the global revenue of electrical and electronics stood at USD 5,807 billion, with Asia-Pacific holding a 74% market share, followed by Europe with a 13% share. The global electrical and electronics market is expected to record a CAGR of 6.61% during the forecast period.
- In 2018, the Asia-Pacific region witnessed strong economic growth owing to rapid industrialization in China, South Korea, Japan, India, and ASEAN countries. In 2020, due to the pandemic, there was a slowdown in global electrical and electronics production due to the shortage of chips and inefficiencies in the supply chain, which led to a stagnant growth rate of 0.1% in revenue compared to the previous year. This growth was driven by the demand for consumer electronics for remote working and home entertainment as people were forced to remain indoors during the pandemic.
- The demand for advanced technologies, such as digitalization, robotics, virtual reality, augmented reality, IoT (Internet of Things), and 5G connectivity, is expected to grow during the forecast period. Global electrical and electronics production is expected to register a growth rate of 5.9% in 2027. As a result of technological advancements, the demand for consumer electronics is expected to rise during the forecast period. For instance, the global consumer electronics industry is projected to witness a revenue reach of around USD 904.6 billion in 2027, compared to USD 719.1 billion in 2023. As a result, technological development is projected to lead the demand for electrical and electronic products during the forecast period.
Polyimides (PI) Industry Overview
The Polyimides (PI) Market is fragmented, with the top five companies occupying 32.57%. The major players in this market are DuPont, Kaneka Corporation, PI Advanced Materials Co., Ltd., Toray Industries, Inc. and UBE Corporation (sorted alphabetically).
Additional Benefits:
- The market estimate (ME) sheet in Excel format
- 3 months of analyst support
TABLE OF CONTENTS
1 EXECUTIVE SUMMARY & KEY FINDINGS
2 REPORT OFFERS
3 INTRODUCTION
- 3.1 Study Assumptions & Market Definition
- 3.2 Scope of the Study
- 3.3 Research Methodology
4 KEY INDUSTRY TRENDS
- 4.1 End User Trends
- 4.1.1 Aerospace
- 4.1.2 Automotive
- 4.1.3 Building and Construction
- 4.1.4 Electrical and Electronics
- 4.1.5 Packaging
- 4.2 Regulatory Framework
- 4.2.1 Argentina
- 4.2.2 Australia
- 4.2.3 Brazil
- 4.2.4 Canada
- 4.2.5 China
- 4.2.6 EU
- 4.2.7 India
- 4.2.8 Japan
- 4.2.9 Malaysia
- 4.2.10 Mexico
- 4.2.11 Nigeria
- 4.2.12 Russia
- 4.2.13 Saudi Arabia
- 4.2.14 South Africa
- 4.2.15 South Korea
- 4.2.16 United Arab Emirates
- 4.2.17 United Kingdom
- 4.2.18 United States
- 4.3 Value Chain & Distribution Channel Analysis
5 MARKET SEGMENTATION (includes market size in Value in USD and Volume, Forecasts up to 2029 and analysis of growth prospects)
- 5.1 End User Industry
- 5.1.1 Aerospace
- 5.1.2 Automotive
- 5.1.3 Electrical and Electronics
- 5.1.4 Industrial and Machinery
- 5.1.5 Other End-user Industries
- 5.2 Region
- 5.2.1 Africa
- 5.2.1.1 By Country
- 5.2.1.1.1 Nigeria
- 5.2.1.1.2 South Africa
- 5.2.1.1.3 Rest of Africa
- 5.2.2 Asia-Pacific
- 5.2.2.1 By Country
- 5.2.2.1.1 Australia
- 5.2.2.1.2 China
- 5.2.2.1.3 India
- 5.2.2.1.4 Japan
- 5.2.2.1.5 Malaysia
- 5.2.2.1.6 South Korea
- 5.2.2.1.7 Rest of Asia-Pacific
- 5.2.3 Europe
- 5.2.3.1 By Country
- 5.2.3.1.1 France
- 5.2.3.1.2 Germany
- 5.2.3.1.3 Italy
- 5.2.3.1.4 Russia
- 5.2.3.1.5 United Kingdom
- 5.2.3.1.6 Rest of Europe
- 5.2.4 Middle East
- 5.2.4.1 By Country
- 5.2.4.1.1 Saudi Arabia
- 5.2.4.1.2 United Arab Emirates
- 5.2.4.1.3 Rest of Middle East
- 5.2.5 North America
- 5.2.5.1 By Country
- 5.2.5.1.1 Canada
- 5.2.5.1.2 Mexico
- 5.2.5.1.3 United States
- 5.2.6 South America
- 5.2.6.1 By Country
- 5.2.6.1.1 Argentina
- 5.2.6.1.2 Brazil
- 5.2.6.1.3 Rest of South America
- 5.2.1 Africa
6 COMPETITIVE LANDSCAPE
- 6.1 Key Strategic Moves
- 6.2 Market Share Analysis
- 6.3 Company Landscape
- 6.4 Company Profiles (includes Global Level Overview, Market Level Overview, Core Business Segments, Financials, Headcount, Key Information, Market Rank, Market Share, Products and Services, and Analysis of Recent Developments).
- 6.4.1 China Wanda Group
- 6.4.2 DuPont
- 6.4.3 Jiaozuo Tianyi Technology Co., Ltd.
- 6.4.4 Kaneka Corporation
- 6.4.5 Mitsui Chemicals, Inc.
- 6.4.6 PI Advanced Materials Co., Ltd.
- 6.4.7 SZRH Film Technology Group
- 6.4.8 Taimide Tech. Inc.
- 6.4.9 Toray Industries, Inc.
- 6.4.10 UBE Corporation
7 KEY STRATEGIC QUESTIONS FOR ENGINEERING PLASTICS CEOS
8 APPENDIX
- 8.1 Global Overview
- 8.1.1 Overview
- 8.1.2 Porter's Five Forces Framework (Industry Attractiveness Analysis)
- 8.1.3 Global Value Chain Analysis
- 8.1.4 Market Dynamics (DROs)
- 8.2 Sources & References
- 8.3 List of Tables & Figures
- 8.4 Primary Insights
- 8.5 Data Pack
- 8.6 Glossary of Terms
02-2729-4219
+886-2-2729-4219
 聚醯亞胺清漆市場規模、佔有率及成長分析(按類型、終端用戶產業、應用及地區分類)-產業預測,2025-2032年
 聚醯亞胺(PI)-全球市佔率及排名、總收入及需求預測(2025-2031年)光敏聚醯亞胺(PSPI):全球市場佔有率和排名、總銷售額和需求預測(2025-2031 年)
 2032 年聚醯亞胺市場預測:按類型、應用、最終用戶和地區分類的全球分析
 聚醯亞胺市場規模、佔有率、趨勢分析報告:按類型、應用、地區、細分市場預測,2025-2030年
 聚醯亞胺市場 - 全球產業規模、佔有率、趨勢、機會和預測,按最終用戶(航太、汽車、建築和施工、電氣和電子、包裝、其他)細分,按地區和競爭,2020 年至 2035 年預測
 聚醯亞胺凡立水的全球市場:依類型、最終用戶產業和地區(~2032年)
 全球聚醯亞胺樹脂市場(2016-2036)
 曝光性聚醯亞胺 (PSPI) 的全球市場:2024年