


 |
市場調查報告書
商品編碼
1851063
廢棄物管理:全球市場佔有率分析、行業趨勢、統計數據和成長預測(2025-2030 年)Global Waste Management - Market Share Analysis, Industry Trends & Statistics, Growth Forecasts (2025 - 2030) |
||||||
※ 本網頁內容可能與最新版本有所差異。詳細情況請與我們聯繫。
預計到 2025 年,廢棄物管理市場將創造 1.43 兆美元的收入,到 2030 年將達到 1.97 兆美元,2025 年至 2030 年的複合年成長率為 6.62%。
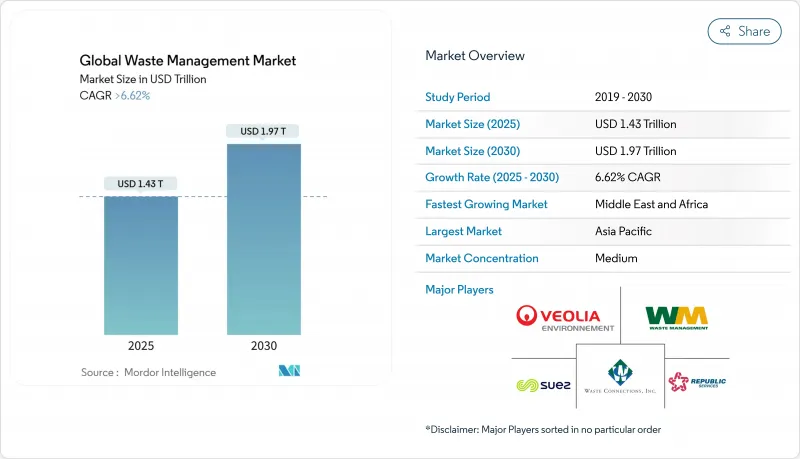
持續的監管壓力、企業日益成長的廢棄物承諾以及回收材料的商業化,正推動廢棄物管理市場從以掩埋為中心的模式轉向綜合收集系統。歐盟和美國多個州已頒布生產者延伸責任制(EPR)法規,將處置成本轉移給品牌所有者,並設立專門的資金池用於回收基礎設施建設。同時,美國環保署(EPA)和歐盟強制推行的數位追蹤平台正在催生一個全新的數據主導服務產業,而對配備碳捕獲技術的垃圾焚化發電(WtE)設施的投資則正在釋放負碳收入來源。預計到2024年,亞太地區將成為最大的區域,而中東和非洲(MEA)地區將在2030年之前成為成長最快的地區。受電動車電池即將淘汰的影響,電子廢棄物是成長最快的廢棄物流。
全球廢棄物管理市場趨勢與洞察
歐盟和北美地區的生產者延伸責任法規
強制性生產者責任延伸制度(EPR)正在重塑廢棄物管理市場的成本結構,要求生產者資金籌措收集和回收的費用。加州SB 54法案規定,到2032年,塑膠包裝的使用量必須減少25%,回收率必須達到65%。明尼蘇達州於2024年與其他五個美國一同頒布了EPR法案。歐盟於2023年將EPR擴展到紡織品領域,由此催生了一個新的合規市場,鼓勵廢棄物處理業者整合並投資光學分揀和聚合物識別生產線,以贏得EPR資助的合約。肯亞於2024年推出的類似法規表明,這種模式正在全球範圍內得到應用。
碳負排放目標推動垃圾焚化發電投資
淨零排放承諾正推動資本流向配備燃燒後碳捕集技術的垃圾焚化發電廠。溫哥華都會區一家日處理量720噸垃圾的工廠斥資1.01億美元購置了一套每年可去除30萬噸二氧化碳的設備,使其碳排放由正轉負。在沙烏地阿拉伯,一項將300萬噸城市固態廢棄物轉化為燃料的垃圾焚化發電計畫旨在每年減少179萬噸二氧化碳排放,同時向電網輸送可再生電力。進入碳權市場為營運商創造了新的收入來源。
南亞和非洲非正規部門的碎片化主導地位
普遍存在的非正規勞動力限制了正規廢棄物管理市場的發展。在南非,每年有367萬噸生活廢棄物無人收集,助長了非法傾倒,並侵蝕了市政收入。在南亞,非正規的電子廢棄物回收使工人暴露於重金屬環境中,也阻礙了機構投資者為現代化工廠提供資金。將這些工人納入規範的價值鏈需要培訓和資金,而許多當地經營者無法承擔,導致垃圾收集率低,損失嚴重。
細分市場分析
預計2024年工業廢棄物將維持最強勁的成長勢頭,到2030年將以8.3%的複合年成長率成長,而同年生活廢棄物在廢棄物管理市場中佔比最大,達到46.54%。企業排放要求正促使製造商將生產廢棄物視為資源,增加了對現場包裝、溶劑回收和閉合迴路物流的需求。酵母公司價值22.5億美元的分子回收企業發展,旨在每年處理2.5億磅複雜塑膠,充分展現了工業領域的巨大機會。這種轉變在中國和東南亞國協的電子、汽車和消費品工廠尤為明顯。
儘管居民生活垃圾處理體系已趨於成熟,但由於都市化進程的加快,它們對於擴大整體廢棄物管理市場規模仍然至關重要。各國政府正在實施顏色編碼的路邊垃圾收集計畫和廚餘垃圾垃圾厭氧消化設施,以達到減少掩埋的目標。零售連鎖店的商業廢棄物持續穩定成長,因為生產者責任延伸(EPR)費用用於資助門市前部垃圾收集基礎設施。建築和拆除廢棄物正受到政策關注。印度修訂後的建築和拆除垃圾法規將於2025年4月生效,該法規將強制大型專案使用再生骨材,從而為破碎機提供可預測的垃圾量。廢棄物和農業廢棄物雖然是小眾但成長迅速的通訊協定,計劃傳染性廢棄物的強化處理規程促使農村地區的農業生質能被送往厭氧消化廠。
廢棄物管理市場報告按產生來源(居民、商業(零售、辦公室等)、工業及其他)、服務類型(收集、運輸、分類/分離、處置/處理)、廢棄物類型(城市固態廢棄物、電子廢棄物及其他)和地區(北美、歐洲及其他)進行細分。報告提供了上述所有細分市場的市場規模和預測(以美元計)。
區域分析
亞太地區預計到2024年將佔全球銷售額的56%,這主要得益於密集的製造業叢集和快速的城市化進程,由此產生了需要先進處理的多種材料廢棄物。中國的《循環經濟促進法》和日本的《塑膠資源回收法》要求生產商在設計產品時考慮可回收性,而印度的新規則要求公共基礎設施建設使用再生砂和骨材。深圳、東京和班加羅爾等城市的政府部門正在推行垃圾傾倒系統,以鼓勵居民進行生活垃圾分類。像微軟這樣的跨國公司,其位於新加坡的新資料中心已實現了85%的建築廢棄物回收率,這些公司正在簽署區域性回收協議,以履行其零廢棄物承諾。
中東和非洲是成長最快的地區,預計到2030年複合年成長率將達到9.1%。沙烏地阿拉伯投資與回收公司(SIRC)正在投資6.25億美元建造固態制燃料和輪胎製油設施,以實現「2030願景」中循環經濟的里程碑目標。海灣合作理事會(GCC)於2025年2月簽署的《廢棄物發電合作協議》設定了40%的掩埋轉移目標,並為阿布達比、麥納麥和吉達的工廠建設工程總承包(EPC)計畫提供了支持。同時,南非和肯亞正在試行推行數位化註冊系統,以正式登記非正式垃圾收集者。
北美和歐洲是成熟但監管嚴格的市場。美國環保署 (EPA) 將於 2025 年要求所有危險廢棄物出口都必須使用電子艙單,這將增加資料合規收入。白宮計劃在 2027 年前逐步淘汰聯邦採購中的一次性塑膠製品,預計將對供應商合約產生影響。歐洲將於 2024 年 5 月生效的廢棄物運輸法規將限制向非經合組織國家的出口,並要求在 2026 年前實現端到端的數位化追蹤。
其他福利:
- Excel格式的市場預測(ME)表
- 3個月的分析師支持
目錄
第1章 引言
- 調查範圍
第2章調查方法
第3章執行摘要
第4章 市場洞察與動態
- 市場促進因素
- 歐盟和北美地區的生產者延伸責任法規
- 碳負排放目標推動了對廢棄物發電的投資
- 企業零廢棄物承諾推動亞洲工業回收交易
- 美國環保署(EPA)和歐盟(EU)強制要求對廢棄物流進行數位化追蹤。
- 按需消費者運輸應用程式促進了城市特大城市的貨物收集。
- 電動車的普及導致鋰離子電池廢棄物迅速增加,從而催生了對專業回收的需求。
- 市場限制
- 南亞和非洲分散的非正規部門的優勢
- 西歐對新建掩埋的監管禁令增加了合規成本。
- 回收產品價格不穩定阻礙了全球的回收投資。
- 禁止跨境廢棄物運輸削弱了盈利的貿易路線
- 價值/供應鏈分析
- 監理展望
- 技術展望
- Start-Ups生態系分析
- 主要新興趨勢
- 地緣政治衝擊的影響
- 產業吸引力—五力分析
- 新進入者的威脅
- 買方的議價能力
- 供應商的議價能力
- 替代品的威脅
- 競爭對手之間的競爭
第5章 市場規模與成長預測
- 按排放源
- 住房
- 商業(零售、辦公等)
- 工業的
- 醫療(健康和醫藥)
- 建設與拆除
- 其他(用於設施、農業等)
- 按服務類型
- 收集、運輸、分類和分離
- 處置/處置
- 掩埋
- 回收和資源回收
- 焚燒和垃圾焚化發電
- 其他(化學處理、堆肥等)
- 其他(諮詢、審核、訓練等)
- 依廢棄物類型
- 都市固態廢棄物
- 工業用危險廢棄物
- 電子廢棄物
- 塑膠廢棄物
- 醫療廢棄物
- 建築和拆除廢棄物
- 農業廢棄物
- 其他特殊廢棄物(放射性物質等)
- 按地區
- 北美洲
- 美國
- 加拿大
- 墨西哥
- 南美洲
- 巴西
- 阿根廷
- 其他南美洲
- 亞太地區
- 中國
- 日本
- 印度
- 韓國
- 東協(印尼、泰國、菲律賓、馬來西亞、越南)
- 澳洲
- 亞太其他地區
- 歐洲
- 英國
- 德國
- 法國
- 義大利
- 西班牙
- 俄羅斯
- 比荷盧經濟聯盟(比利時、荷蘭、盧森堡)
- Nordix(丹麥、芬蘭、冰島、挪威、瑞典)
- 其他歐洲地區
- 中東和非洲
- 沙烏地阿拉伯
- 阿拉伯聯合大公國
- 卡達
- 土耳其
- 南非
- 埃及
- 奈及利亞
- 其他中東和非洲地區
- 北美洲
第6章 競爭情勢
- 策略趨勢
- 市佔率分析
- 公司簡介
- Veolia Environment SA
- Waste Management Inc.
- Suez SA
- Republic Services Inc.
- Waste Connections Inc.
- Clean Harbors Inc.
- Covanta Holding Corporation
- Biffa Group
- Remondis SE & Co. KG
- Stericycle Inc.
- GFL Environmental Inc.
- FCC Environment
- Cleanaway Waste Management Ltd
- Hitachi Zosen Inova AG
- Sims Limited
- Renewi PLC
- Averda
- Daiseki Co. Ltd
- Tatweer Environmental Services
- Waste Pro USA
- Recology
第7章 市場機會與未來展望
The Waste Management Market generated USD 1.43 trillion in 2025 and is forecast to reach USD 1.97 trillion by 2030, advancing at a 6.62% CAGR between 2025-2030.
Persistent regulatory pressure, expanding corporate zero-waste pledges, and the monetization of recovered materials are steering the waste management market away from landfill-centric models and toward integrated recovery systems. Extended Producer Responsibility (EPR) statutes in the European Union and several U.S. states are transferring disposal costs to brand owners, creating dedicated funding pools for recycling infrastructure. At the same time, the roll-out of mandatory digital tracking platforms by the U.S. EPA and the EU is spawning new data-driven service niches, while investments in waste-to-energy (WtE) facilities equipped with carbon-capture technology are unlocking carbon-negative revenue streams. Asia-Pacific held the largest regional position in 2024, and Middle East & Africa (MEA) is on track to be the fastest-growing geography through 2030 as governments allocate capital to diversion targets. E-waste represents the highest-velocity waste stream, propelled by looming electric-vehicle battery retirements.
Global Waste Management Market Trends and Insights
Extended Producer Responsibility regulations in EU & North America
Mandatory EPR schemes now require producers to finance collection and recycling, reshaping the cost base for the waste management market. California's SB 54 compels a 25% plastic-packaging reduction by 2032 along with a 65% recycling rate, and Minnesota joined five other U.S. states with its own 2024 EPR law. The EU extended EPR to textiles in 2023, creating new compliance markets that have encouraged waste-management operators to consolidate and invest in optical-sorting and polymer-identification lines to capture EPR-funded contracts. Comparable rules introduced in Kenya in 2024 demonstrate global diffusion of the model.
Carbon-negative targets driving WtE investments
Net-zero commitments are channeling capital toward WtE plants equipped with post-combustion carbon capture. Metro Vancouver's facility, processing 720 t/day of refuse, placed a USD 101 million price tag on equipment that will remove 300,000 tCO2 annually, flipping the emissions balance from positive to negative. In Saudi Arabia, a WtE program converting 3 million t of municipal solid waste into fuel aims to cut 1.79 million tCO2 per year while delivering renewable electricity to the grid. Access to carbon credit markets adds a new income layer for operators.
Fragmented informal sector dominance in South Asia & Africa
An extensive informal workforce limits formal penetration of the waste management market. South Africa leaves 3.67 million t of household waste uncollected each year, fostering illegal dumping and eroding municipal revenues. Informal e-waste recycling in South Asia exposes workers to heavy metals, discouraging institutional investors from funding modern plants. Integrating these workers into regulated value chains requires training and capital that many local operators cannot finance, keeping collection rates low and leakage high.
Other drivers and restraints analyzed in the detailed report include:
- Corporate zero-waste pledges spurring industrial recycling contracts in Asia
- Mandatory digital tracking of waste flows in the U.S. and EU
- Volatile recovered-commodity prices disincentivizing recycling investment
For complete list of drivers and restraints, kindly check the Table Of Contents.
Segment Analysis
Industrial waste retained the highest momentum in 2024 and is on course to post an 8.3% CAGR to 2030, while residential waste accounted for the largest 46.54% waste management market share that same year. Corporate emissions-reduction mandates are causing manufacturers to treat production scrap as a resource, boosting demand for on-site baling, solvent recovery, and closed-loop logistics. Eastman's USD 2.25 billion molecular-recycling roll-out, designed to handle 250 million lb of complex plastics annually, illustrates the scale of industrial opportunities. The shift is especially notable in electronics, automotive, and consumer-goods plants concentrated in China and ASEAN nations.
Residential streams, although mature, remain essential to the overall waste management market size because of rising urbanization. Governments are installing color-coded curbside programs and food-waste digesters to comply with landfill-diversion targets. Commercial waste from retail chains adds stable growth as EPR fees fund front-of-store collection infrastructure. Construction-and-demolition waste has gained policy attention; India's revised C&D rules, effective April 2025, oblige megaprojects to use recycled aggregates, generating predictable tonnage for crushers. Medical and agricultural wastes represent niche but expanding categories, with infectious-waste protocols tightened post-pandemic and agricultural biomass feeding anaerobic-digestion plants in rural zones.
The Waste Management Market Report is Segmented by Source (Residential, Commercial [Retail, Office, Etc. ], Industrial and More), by Service Type (Collection, Transportation, Sorting & Segregation and Disposal/Treatment), by Waste Type (Municipal Solid Waste, E-Waste and More) and by Geography (North America, Europe and More). The Report Offers Market Size and Forecasts in Value (USD) for all the Above Segments.
Geography Analysis
Asia-Pacific contributed 56% of global revenue in 2024, powered by dense manufacturing clusters and rapid urban migration that generate multi-material waste flows requiring advanced processing. China's Circular-Economy Promotion Law and Japan's Plastic Resource-Circulation Act obligate producers to design for recyclability, while India's new rules demand recycled sand and aggregate in public infrastructure. Urban authorities in Shenzhen, Tokyo, and Bengaluru have introduced pay-as-you-throw pricing that boosts household separation at source. Multinationals such as Microsoft, which achieved an 85% construction-waste diversion rate at its new Singapore data center, are executing regional recycling contracts to fulfill zero-waste pledges.
The Middle East & Africa is the fastest-expanding region, flashing a 9.1% CAGR outlook through 2030. Saudi Investment Recycling Company (SIRC) is deploying USD 625 million across refuse-derived-fuel and tire-to-oil facilities to meet Vision 2030 circular-economy milestones. The GCC Waste-to-Energy Cooperation Protocol, signed in February 2025, sets a 40% landfill-diversion target, galvanising plant EPC pipelines in Abu Dhabi, Manama, and Jeddah. Simultaneously, South Africa and Kenya are piloting digital registry systems to formalise informal collectors, though capacity gaps persist outside capital regions.
North America and Europe are mature but regulation-intensive markets. The U.S. EPA's 2025 mandate that all hazardous-waste exports traverse the e-Manifest expands data-compliance revenue. The White House strategy to phase out single-use plastics from federal procurement by 2027 is expected to ripple through supplier contracts. Europe's Waste Shipments Regulation, effective May 2024, restricts exports to non-OECD countries and requires end-to-end digital tracking by 2026.
- Veolia Environment SA
- Waste Management Inc.
- Suez SA
- Republic Services Inc.
- Waste Connections Inc.
- Clean Harbors Inc.
- Covanta Holding Corporation
- Biffa Group
- Remondis SE & Co. KG
- Stericycle Inc.
- GFL Environmental Inc.
- FCC Environment
- Cleanaway Waste Management Ltd
- Hitachi Zosen Inova AG
- Sims Limited
- Renewi PLC
- Averda
- Daiseki Co. Ltd
- Tatweer Environmental Services
- Waste Pro USA
- Recology
Additional Benefits:
- The market estimate (ME) sheet in Excel format
- 3 months of analyst support
TABLE OF CONTENTS
1 Introduction
- 1.1 Scope of the Study
2 Research Methodology
3 Executive Summary
4 Market Insights and Dynamics
- 4.1 Market Drivers
- 4.1.1 Extended Producer Responsibility Regulations in EU & North America
- 4.1.2 Carbon-Negative Targets Driving Waste-to-Energy Investments
- 4.1.3 Corporate Zero-Waste Pledges Spurring Industrial Recycling Contracts in Asia
- 4.1.4 Digital Tracking of Waste Flows Mandated by US EPA & EU
- 4.1.5 On-Demand Consumer Hauling Apps in Urban Mega-Cities Boosting Collection Volumes
- 4.1.6 Surge in Lithium-Ion Battery Waste from EV Adoption Creating Specialized Recycling Demand
- 4.2 Market Restraints
- 4.2.1 Fragmented Informal Sector Dominance in South Asia & Africa
- 4.2.2 Regulatory Moratoria on New Landfills in Western Europe Increasing Compliance Costs
- 4.2.3 Volatile Recovered Commodity Prices Disincentivizing Recycling Investments Globally
- 4.2.4 Cross-border Waste Shipment Bans Curtailing Profitable Trade Routes
- 4.3 Value / Supply-Chain Analysis
- 4.4 Regulatory Outlook
- 4.5 Technological Outlook
- 4.6 Startup Ecosystem Analysis
- 4.7 Key Emerging Trends
- 4.8 Impact of Geopolitical Shocks
- 4.9 Industry Attractiveness - Porter's Five Forces
- 4.9.1 Threat of New Entrants
- 4.9.2 Bargaining Power of Buyers
- 4.9.3 Bargaining Power of Suppliers
- 4.9.4 Threat of Substitute Products
- 4.9.5 Intensity of Competitive Rivalry
5 Market Size & Growth Forecasts (Value, In USD Billion)
- 5.1 By Source
- 5.1.1 Residential
- 5.1.2 Commercial (Retail, Office, etc.)
- 5.1.3 Industrial
- 5.1.4 Medical (Health and Pharmaceutical)
- 5.1.5 Construction & Demolition
- 5.1.6 Others (Institutional, Agricultural, etc)
- 5.2 By Service Type
- 5.2.1 Collection, Transportation, Sorting & Segregation
- 5.2.2 Disposal / Treatment
- 5.2.2.1 Landfill
- 5.2.2.2 Recycling & Resource Recovery
- 5.2.2.3 Incineration & Waste-to-Energy
- 5.2.2.4 Others (Chemical Treatment, Composting, etc.)
- 5.2.3 Others (Consulting, Audit & Training, etc.)
- 5.3 By Waste Type
- 5.3.1 Municipal Solid Waste
- 5.3.2 Industrial Hazardous Waste
- 5.3.3 E-waste
- 5.3.4 Plastic Waste
- 5.3.5 Biomedical Waste
- 5.3.6 Construction & Demolition Waste
- 5.3.7 Agricultural Waste
- 5.3.8 Other Specialized Waste (Radio Active, etc.)
- 5.4 By Geography
- 5.4.1 North America
- 5.4.1.1 United States
- 5.4.1.2 Canada
- 5.4.1.3 Mexico
- 5.4.2 South America
- 5.4.2.1 Brazil
- 5.4.2.2 Argentina
- 5.4.2.3 Rest of South America
- 5.4.3 Asia-Pacific
- 5.4.3.1 China
- 5.4.3.2 Japan
- 5.4.3.3 India
- 5.4.3.4 South Korea
- 5.4.3.5 ASEAN (Indonesia, Thailand, Philippines, Malaysia, Vietnam)
- 5.4.3.6 Australia
- 5.4.3.7 Rest of Asia-Pacific
- 5.4.4 Europe
- 5.4.4.1 United Kingdom
- 5.4.4.2 Germany
- 5.4.4.3 France
- 5.4.4.4 Italy
- 5.4.4.5 Spain
- 5.4.4.6 Russia
- 5.4.4.7 BENELUX (Belgium, Netherlands, and Luxembourg)
- 5.4.4.8 NORDICS (Denmark, Finland, Iceland, Norway, and Sweden)
- 5.4.4.9 Rest of Europe
- 5.4.5 Middle East and Africa
- 5.4.5.1 Saudi Arabia
- 5.4.5.2 United Arab Emirates
- 5.4.5.3 Qatar
- 5.4.5.4 Turkey
- 5.4.5.5 South Africa
- 5.4.5.6 Egypt
- 5.4.5.7 Nigeria
- 5.4.5.8 Rest of Middle East and Africa
- 5.4.1 North America
6 Competitive Landscape
- 6.1 Strategic Moves
- 6.2 Market Share Analysis
- 6.3 Company Profiles {(includes Global level Overview, Market level overview, Core Segments, Financials as available, Strategic Information, Products & Services, and Recent Developments)}
- 6.3.1 Veolia Environment SA
- 6.3.2 Waste Management Inc.
- 6.3.3 Suez SA
- 6.3.4 Republic Services Inc.
- 6.3.5 Waste Connections Inc.
- 6.3.6 Clean Harbors Inc.
- 6.3.7 Covanta Holding Corporation
- 6.3.8 Biffa Group
- 6.3.9 Remondis SE & Co. KG
- 6.3.10 Stericycle Inc.
- 6.3.11 GFL Environmental Inc.
- 6.3.12 FCC Environment
- 6.3.13 Cleanaway Waste Management Ltd
- 6.3.14 Hitachi Zosen Inova AG
- 6.3.15 Sims Limited
- 6.3.16 Renewi PLC
- 6.3.17 Averda
- 6.3.18 Daiseki Co. Ltd
- 6.3.19 Tatweer Environmental Services
- 6.3.20 Waste Pro USA
- 6.3.21 Recology
7 Market Opportunities & Future Outlook
 全球市政廢棄物管理解決方案市場預測(至2032年):按廢棄物類型、服務類型、技術、最終用戶和地區分類的分析全球智慧廢棄物管理和垃圾物聯網(IoW)市場:預測至2032年-按組件、廢棄物趨勢、部署方法、相關人員、技術、應用和區域進行分析公寓式小型堆肥除臭技術市場預測至2032年:全球組件、產能、材質、銷售管道、技術、最終用戶和區域分析多氟烷基物質 (PFAS)廢棄物管理市場預測至 2032 年:按廢棄物類型、處理方法、來源、服務類型、最終用戶和地區分類的全球分析零廢棄物策略市場預測至2032年:按廢棄物類型、策略類型、服務類型、最終用戶和地區分類的全球分析
 廢棄物管理市場(按服務類型、廢棄物類型、最終用戶和處理方法)—2025-2032 年全球預測
 氣動廢棄物管理系統市場-全球產業規模、佔有率、趨勢、機會和預測(按類型、按組件、按應用、按地區和競爭細分,2020-2030 年)濕廢棄物管理市場(按廢棄物類型、製程技術、回收方法和最終用戶分類)—2025-2032 年全球預測
 2025年廢棄物管理軟體全球市場報告2025年全球廢棄物處理與收集服務市場報告