


 |
市場調查報告書
商品編碼
1849864
防爆設備:市場佔有率分析、產業趨勢、統計數據和成長預測(2025-2030 年)Explosion Proof Equipment - Market Share Analysis, Industry Trends & Statistics, Growth Forecasts (2025 - 2030) |
||||||
※ 本網頁內容可能與最新版本有所差異。詳細情況請與我們聯繫。
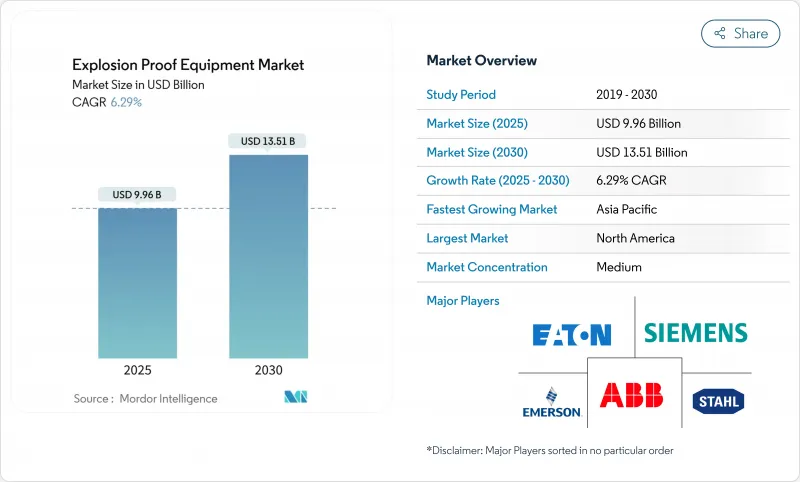
預計到 2025 年,防爆設備市場規模將達到 99.6 億美元,到 2030 年將達到 135.1 億美元,年複合成長率為 6.29%。
ATEX 和 IECEx 法規的普遍實施、綠色氫能工廠的快速建設以及對工業物聯網 (IIoT) 賦能改造的持續資本投入,推動了危險區域的預測性維修,從而促進了市場擴張。此外,海上和陸上設施大規模採用 LED 照明以及亞太地區鋰離子超級工廠的推出也推動了需求成長,這些項目都需要用於防塵區域的防護設備。北美地區憑藉 OSHA 法規和老舊設備的現代化改造,保持了其市場主導;而亞太地區則憑藉新興的氫能走廊、電池供應鍊和化工產業叢集,實現了最快的市場成長。 ABB、西門子和伊頓等公司正將其資產負債表優勢重新配置到本地製造能力,而新參與企業則填補了細分認證領域的空白,因此市場競爭格局仍保持適度分散。近期面臨的不利因素包括鑄件短缺和對中國製造外殼徵收關稅,這些因素正在擠壓利潤空間並促使企業採用多元化採購模式。
全球防爆設備市場趨勢與洞察
全球加強ATEX/IECEx執法力度
監理機關於2024年4月加強了ATEX防爆指南,收緊了合格評定標準,並將測試量年增了40%。土耳其和韓國也採取了類似舉措,頒布了符合IECEx標準的法規,迫使供應商升級通常已運作20年的老舊生產線。跨國公司歡迎這種協調統一的做法,因為單一認證能夠實現跨區域銷售,縮短週期時間,並減少工程差異。這些日益嚴格的法規正在加速煉油廠、化工園區、液化天然氣出口中心等場所的設備更新換代需求。
更多綠色氫能計劃需要一級設備
氫氣在空氣中的可燃性為4%至75%,極易引發火災,因此需要複雜的密閉、偵測和通風系統。中國、澳洲和墨西哥灣沿岸的吉瓦級電解槽正在採購客製化的防火開關設備和本質安全型感測器,從而在防爆設備市場中建立起專屬的採購管道。擁有氫氣專業認證的供應商正在獲得先發優勢,這促進了價值鏈上的產品組合細分和研發合作。
高昂的認證和再認證成本
完整的ATEX和IECEx認證流程會消耗15%至25%的研發預算,而對於複雜的組件,實驗室的等待時間長達6至12個月。小型公司難以融資多次認證申請的費用,因此紛紛透過併購和合資來分擔風險。隨著標準的不斷演變,重新認證的周期性變化會侵蝕毛利率,並導致下游產品價格的調整。
細分市場分析
到2024年,防火存儲將佔總營收的46%,鞏固其在防爆設備市場的核心地位。設計堅固耐用的機殼和良好的服務記錄,使其在高功率泵、壓縮機和MCC控制櫃等領域中廣泛應用,尤其是在成熟的油氣盆地。然而,本質安全型設計正以7.9%的複合年成長率成長,採用低功耗設計、微型感測器和現場匯流排拓撲結構,運作能量低於點火能量閾值。隨著資產管理方不斷提升數位化診斷能力,本質安全型設計的普及率將穩定下降,但隨著新型感測器節點在危險區域的部署,整個防爆設備市場規模仍將持續成長。
對於大型變頻器和PLC套件而言,加壓吹掃機櫃仍然必不可少;而防爆襯裡和隔離模組則適用於電池工廠中特殊的粉塵處理流程。向能量受限路徑的轉變標誌著市場正從“遏制”轉向“預防”,這體現了全球安全理念,並為長期發展提供了支持。
2024年,1區將佔防爆設備市場收入的32%,反映出工業流程在日常運作中普遍產生蒸氣。操作員傾向於選擇經過認證的照明燈具、電纜固定頭和接線盒,以確保維護週期內的連續性。然而,預計年複合成長率為8.5%的0區,由於綠色氫能和深水鑽井等持續存在的爆炸性環境需要最高等級的硬體,因此吸引了資本投資的優先考慮。這將導致即使總銷量下降,產品組合的盈利也將受到更多關注。
2區計劃將產生大量低規格設備,尤其是在食品、飲料和飲品工廠從傳統設備過渡到新設備的過程中。隨著電池正負極粉塵在多次火災事故後變得更加明顯,21區和22區的粉塵需求將加速成長,迫使原始設備製造商(OEM)在設計時考慮顆粒物威脅,並推動防爆設備在防塵產品市場佔有率的不斷攀升。
防爆設備市場依防護方法(防爆隔離、防爆及其他)、區域(0區、20區、1區及其他)、最終用戶(製藥、化學、石化及其他)、系統(電力系統、物料輸送及其他)及地區進行細分。市場規模和預測以美元計價。
區域分析
2024年,北美將佔全球銷售額的35%,這主要得益於美國國家電氣規範(NEC)第500-516條以及墨西哥灣沿岸石化中心持續進行的檢修項目。美國煉油商將繼續推動中期維修,而加拿大將為冬季防爆裝置配備低溫認證外殼。工業物聯網(IIoT)的廣泛應用和LED維修將推高該地區的平均售價,從而在防爆設備市場中保持強勁的息稅前利潤率。
亞太地區正以7.6%的複合年成長率成長,鋰離子電池超級工廠、陸上化工綜合體和海上液化天然氣裝置的建設推動了防爆設備市場的發展。中國正在其電池園區內設置防塵區,印度為製藥和特種化學品行業提供生產關聯激勵措施,日本正在開發氫能谷,需要客製化的I類氣動設備。區域供應商正在快速開發IECEx生產線,縮短前置作業時間並建立區域服務中心。
歐洲市場依然強勁,這得益於德國在ATEX防爆技術和碳中和投資方面的投入,這些投入不僅延長了工廠的使用壽命,也符合歐盟指令2014/34/EU的要求。英國脫歐後政策的延續性推動了ABB在研發和工廠升級方面投入3500萬美元,這表明市場對區域能力持樂觀態度。中東和非洲依賴待開發區的石化和液化天然氣大型企劃,而南美洲則憑藉巴西的乙醇和石化走廊項目正蓬勃發展。
其他福利:
- Excel格式的市場預測(ME)表
- 3個月的分析師支持
目錄
第1章 引言
- 研究假設和市場定義
- 調查範圍
第2章調查方法
第3章執行摘要
第4章 市場情勢
- 市場概覽
- 市場促進因素
- 全球ATEX/IECEx法規執行力道加大
- 越來越多的綠色氫能計劃需要一級設備
- 相容工業物聯網的防爆維修
- 危險照明中的快速LED轉換
- 鋰離子超級工廠對粉塵區設備的需求
- 太空產業試驗設施對防爆系統的需求
- 市場限制
- 高昂的認證和再認證成本
- 分區標準因地區而異
- 耐火材料鑄造供應鏈延誤
- 對中國製造的進口商品徵收反傾銷稅
- 價值/供應鏈分析
- 監管環境
- 技術展望
- 五力分析
- 新進入者的威脅
- 買方的議價能力
- 供應商的議價能力
- 替代品的威脅
- 競爭對手之間的競爭
第5章 市場規模與成長預測
- 透過保護方法
- 爆炸防護(防火)
- 本質安全
- 加壓/吹掃
- 防爆措施
- 爆炸分離
- 按區域
- 0區
- 1區
- 2區
- 20區
- 21區
- 22區
- 按最終用戶行業分類
- 石油和天然氣
- 化工和石油化工產品
- 採礦和金屬
- 能源與電力
- 製藥
- 食品/飲料加工
- 污水處理
- 氫氣生產和燃料電池
- 其他行業
- 按系統
- 電力供應與分配
- 馬達和驅動器
- 自動化和控制系統
- 照明系統
- 物料輸送設備
- 監測與檢測
- 暖氣和空調
- 其他系統
- 按地區
- 北美洲
- 美國
- 加拿大
- 墨西哥
- 南美洲
- 巴西
- 阿根廷
- 其他南美洲
- 歐洲
- 德國
- 英國
- 法國
- 俄羅斯
- 其他歐洲地區
- 亞太地區
- 中國
- 日本
- 印度
- 韓國
- 亞太其他地區
- 中東和非洲
- GCC
- 土耳其
- 南非
- 其他中東和非洲地區
- 北美洲
第6章 競爭情勢
- 市場集中度
- 策略趨勢
- 市佔率分析
- 公司簡介
- ABB Ltd
- Eaton Corporation plc
- Siemens AG
- Honeywell International Inc.
- R. STAHL AG
- Pepperl+Fuchs GmbH
- Emerson Electric Co.
- Bartec GmbH
- Rockwell Automation Inc.
- Intertek Group plc
- Marechal Electric Group
- Adalet Inc.
- CZ Electric Co. Ltd
- MAM Explosion-proof Technology(Shanghai)Co. Ltd
- GM International SRL
- Alloy Industry Co. Ltd
- Hawke International
- Cooper Crouse-Hinds(Eaton)
- WEG Industries
- Advantech Co. Ltd
第7章 市場機會與未來展望
The explosion proof equipment market is valued at USD 9.96 billion in 2025 and is forecast to reach USD 13.51 billion by 2030, advancing at a 6.29% CAGR.
Expansion is underpinned by the universal enforcement of ATEX and IECEx rules, a quick build-out of green-hydrogen plants, and sustained capital spending on IIoT-ready retrofits that boost predictive maintenance in hazardous areas. Demand also benefits from the mass conversion to LED lighting in offshore and on-shore facilities and the ramp-up of lithium-ion gigafactories across Asia-Pacific, each requiring dust-zone-rated gear . North America preserves scale leadership through OSHA rules and ageing-asset modernization, whereas Asia-Pacific generates the fastest incremental volumes thanks to emerging hydrogen corridors, battery supply chains, and chemical processing clusters. The competitive landscape remains moderately fragmented as ABB, Siemens, and Eaton redeploy balance-sheet strength into local capacity while newcomers fill niche certification gaps. Near-term headwinds include casting shortages and tariffs on Chinese enclosures, which compress margins and encourage multi-sourcing
Global Explosion Proof Equipment Market Trends and Insights
Stricter Global ATEX/IECEx Enforcement
Regulators tightened ATEX guidelines in April 2024, intensifying conformity assessments and escalating testing volumes by 40% year-on-year. Turkey and South Korea mirrored the move through IECEx-aligned statutes, forcing suppliers to upgrade legacy lines that often run for 20 years. Multinationals welcome harmonization because one certificate now unlocks multi-region sales, compressing cycle times and lowering engineering variance. This regulatory rigor accelerates replacement demand across refineries, chemical parks, and LNG export hubs as managers rush to stay audit-ready.
Rising Green-Hydrogen Projects Needing Class I Equipment
Hydrogen's flammability range of 4-75% in air heightens ignition risk, mandating advanced containment, detection, and ventilation systems. Gigawatt-scale electrolyzer farms in China, Australia, and the Gulf are sourcing bespoke flame-proof switchgear and intrinsically safe sensors, creating a dedicated procurement channel inside the explosion proof equipment market. Suppliers with hydrogen-specific certificates secure early-mover margins, prompting portfolio carve-outs and R&D alliances across the value chain.
High Certification & Recertification Cost
End-to-end ATEX and IECEx validation can consume 15-25% of development budgets, while lab queues stretch to 6-12 months for sophisticated assemblies. Smaller firms struggle to finance multiple dossiers, spurring M&A and joint-venture formations as a risk-sharing tactic. As standards evolve, recertification cycles shave gross margins, nudging price adjustments downstream.
Other drivers and restraints analyzed in the detailed report include:
- Mainstream IIoT-Ready Explosion-Proof Retrofits
- Rapid LED Migration in Hazardous Lighting
- Divergent Regional Zoning Standards
For complete list of drivers and restraints, kindly check the Table Of Contents.
Segment Analysis
Flame-proof containment captured 46% of 2024 revenue, confirming its anchor role in the explosion proof equipment market. The design's rugged housings and service record underpin uptake in high-power pumps, compressors, and MCC panels, especially in mature oil & gas basins. However, intrinsic safety, growing 7.9% CAGR, exploits lower-power electronics, micro-sensors, and field-bus topologies that operate below ignition energy thresholds. As asset managers elevate digital diagnostics, intrinsic-safety designs will steadily dilute containment's percentage but enlarge the overall explosion proof equipment market size by funneling new sensor nodes into hazardous areas.
Pressurized and purged cabinets remain essential for large-frame VFDs and PLC suites, while explosion prevention linings and segregation modules serve specialty dust processes in battery plants. The shift towards energy-limiting pathways illustrates the market's pivot from 'contain' to 'prevent,' mirroring global safety philosophies and supporting long-term expansion.
Zone 1 retained 32% of 2024 revenue in the explosion proof equipment market, reflecting widespread industrial processes where vapors appear in routine operation. Operators favour certified luminaires, cable glands, and junction boxes to secure continuity during maintenance cycles. Yet Zone 0, forecast at 8.5% CAGR, garners capex priority within green hydrogen and deep-sea drilling where continuous explosive atmospheres demand the highest-grade hardware. This re-weights product-mix profitability even if total unit counts remain thinner.
Zone 2 projects generate high volumes for lower-spec gear, particularly across food, feed, and beverage plants transitioning from legacy setups. Dust Zones 21 and 22 accelerate as battery cathode and anode powders gain visibility after widely publicized fire events, compelling OEMs to design for fine particulate threats and escalating the explosion proof equipment market share for dust-rated products.
The Explosion Proof Equipment Market Segmented by Method of Protection (Explosion Segregation, Explosion Prevention, and More), by Zone (Zone 0, Zone 20, Zone 1, and More), by End-User (Pharmaceutical, Chemical and Petrochemical, and More), by System (Power Supply System, Material Handling, and More), and by Geography. The Market Size and Forecasts are Provided in Terms of Value (USD).
Geography Analysis
North America controlled 35% revenue in 2024, galvanized by NEC Articles 500-516 and recurring turnaround programs in petrochemical hubs along the Gulf Coast . United States refiners push mid-cycle revamps, while Canada outfits winterized SAGD units with low-temperature certified enclosures. High IIoT uptake plus LED retrofits elevate the regional average selling price, preserving robust EBIT margins within the explosion proof equipment market.
Asia-Pacific advances at 7.6% CAGR, building lithium-ion gigafactories, onshore chemical complexes, and offshore LNG trains that collectively swell the explosion proof equipment market size . China spearheads dust-zone deployments across battery parks, India channels PLI incentives into pharma and specialty chemicals, and Japan scales hydrogen valleys requiring bespoke Class I pneumatics. Regional suppliers fast-track IECEx lines, compressing lead times and embedding local service nodes.
Europe remains steady, anchored by Germany's ATEX expertise and the bloc's carbon-neutrality investments that extend plant life while aligning with Directive 2014/34/EU. The United Kingdom's policy continuity post-Brexit encourages ABB's USD 35 million R&D and factory upgrade, signalling positive sentiment for regional capabilities. Middle East and Africa rely on greenfield petrochemical and LNG megaprojects, whereas South America's momentum clusters around Brazil's ethanol and petrochemical corridor, together extending the global footprint of the explosion proof equipment market.
- ABB Ltd
- Eaton Corporation plc
- Siemens AG
- Honeywell International Inc.
- R. STAHL AG
- Pepperl+Fuchs GmbH
- Emerson Electric Co.
- Bartec GmbH
- Rockwell Automation Inc.
- Intertek Group plc
- Marechal Electric Group
- Adalet Inc.
- CZ Electric Co. Ltd
- MAM Explosion-proof Technology (Shanghai) Co. Ltd
- G.M. International SRL
- Alloy Industry Co. Ltd
- Hawke International
- Cooper Crouse-Hinds (Eaton)
- WEG Industries
- Advantech Co. Ltd
Additional Benefits:
- The market estimate (ME) sheet in Excel format
- 3 months of analyst support
TABLE OF CONTENTS
1 INTRODUCTION
- 1.1 Study Assumptions & Market Definition
- 1.2 Scope of the Study
2 RESEARCH METHODOLOGY
3 EXECUTIVE SUMMARY
4 MARKET LANDSCAPE
- 4.1 Market Overview
- 4.2 Market Drivers
- 4.2.1 Stricter global ATEX/IECEx enforcement
- 4.2.2 Rising green-hydrogen projects needing Class I equipment
- 4.2.3 IIoT-ready explosion-proof retrofits (mainstream)
- 4.2.4 Rapid LED migration in hazardous lighting
- 4.2.5 Lithium-ion gigafactories demand for dust-zone gear (under-radar)
- 4.2.6 Space-industry test stands requiring Ex-rated systems (under-radar)
- 4.3 Market Restraints
- 4.3.1 High certification and recertification cost
- 4.3.2 Divergent regional zoning standards
- 4.3.3 Supply-chain delays for flame-proof castings (under-radar)
- 4.3.4 Anti-dumping tariffs on Chinese Ex enclosures (under-radar)
- 4.4 Value / Supply-Chain Analysis
- 4.5 Regulatory Landscape
- 4.6 Technological Outlook
- 4.7 Porters Five Forces
- 4.7.1 Threat of New Entrants
- 4.7.2 Bargaining Power of Buyers
- 4.7.3 Bargaining Power of Suppliers
- 4.7.4 Threat of Substitutes
- 4.7.5 Competitive Rivalry
5 MARKET SIZE & GROWTH FORECASTS (VALUE)
- 5.1 By Method of Protection
- 5.1.1 Explosion Containment (Flame-proof)
- 5.1.2 Intrinsic Safety
- 5.1.3 Pressurization / Purged
- 5.1.4 Explosion Prevention
- 5.1.5 Explosion Segregation
- 5.2 By Zone
- 5.2.1 Zone 0
- 5.2.2 Zone 1
- 5.2.3 Zone 2
- 5.2.4 Zone 20
- 5.2.5 Zone 21
- 5.2.6 Zone 22
- 5.3 By End-user Industry
- 5.3.1 Oil and Gas
- 5.3.2 Chemicals and Petrochemicals
- 5.3.3 Mining and Metals
- 5.3.4 Energy and Power
- 5.3.5 Pharmaceuticals
- 5.3.6 Food and Beverage Processing
- 5.3.7 Waste-water Treatment
- 5.3.8 Hydrogen Production and Fuel Cells
- 5.3.9 Other Industries
- 5.4 By System
- 5.4.1 Power Supply and Distribution
- 5.4.2 Motors and Drives
- 5.4.3 Automation and Control Systems
- 5.4.4 Lighting Systems
- 5.4.5 Material Handling Equipment
- 5.4.6 Surveillance and Detection
- 5.4.7 Heating and HVAC
- 5.4.8 Other Systems
- 5.5 By Geography
- 5.5.1 North America
- 5.5.1.1 United States
- 5.5.1.2 Canada
- 5.5.1.3 Mexico
- 5.5.2 South America
- 5.5.2.1 Brazil
- 5.5.2.2 Argentina
- 5.5.2.3 Rest of South America
- 5.5.3 Europe
- 5.5.3.1 Germany
- 5.5.3.2 United Kingdom
- 5.5.3.3 France
- 5.5.3.4 Russia
- 5.5.3.5 Rest of Europe
- 5.5.4 Asia Pacific
- 5.5.4.1 China
- 5.5.4.2 Japan
- 5.5.4.3 India
- 5.5.4.4 South Korea
- 5.5.4.5 Rest of Asia Pacific
- 5.5.5 Middle East and Africa
- 5.5.5.1 GCC
- 5.5.5.2 Turkey
- 5.5.5.3 South Africa
- 5.5.5.4 Rest of Middle East and Africa
- 5.5.1 North America
6 COMPETITIVE LANDSCAPE
- 6.1 Market Concentration
- 6.2 Strategic Moves
- 6.3 Market Share Analysis
- 6.4 Company Profiles (includes Global Overview, Market overview, Core Segments, Financials, Strategic Info, Rank/Share, Products & Services, Recent Developments)
- 6.4.1 ABB Ltd
- 6.4.2 Eaton Corporation plc
- 6.4.3 Siemens AG
- 6.4.4 Honeywell International Inc.
- 6.4.5 R. STAHL AG
- 6.4.6 Pepperl+Fuchs GmbH
- 6.4.7 Emerson Electric Co.
- 6.4.8 Bartec GmbH
- 6.4.9 Rockwell Automation Inc.
- 6.4.10 Intertek Group plc
- 6.4.11 Marechal Electric Group
- 6.4.12 Adalet Inc.
- 6.4.13 CZ Electric Co. Ltd
- 6.4.14 MAM Explosion-proof Technology (Shanghai) Co. Ltd
- 6.4.15 G.M. International SRL
- 6.4.16 Alloy Industry Co. Ltd
- 6.4.17 Hawke International
- 6.4.18 Cooper Crouse-Hinds (Eaton)
- 6.4.19 WEG Industries
- 6.4.20 Advantech Co. Ltd
7 MARKET OPPORTUNITIES AND FUTURE OUTLOOK
- 7.1 White-space and Unmet Needs Assessment
 全球防爆液壓閥市場(按閥門類型、工作壓力、最終用途行業和地區分類)- 預測至 2030 年
 2025年全球絕緣和防塵系統市場報告2025年全球防爆電梯市場報告2025年全球防爆艙市場報告
 防爆設備市場報告:規模、佔有率、趨勢及預測(按保護方式、適用系統、產業垂直領域和地區),2025 年至 2033 年
 防爆設備市場-全球產業規模、佔有率、趨勢、機會和預測,按保護方法、按系統、按應用、按地區和競爭細分,2020-2030 年
 亞太防爆設備:市場佔有率分析、產業趨勢與成長預測(2025-2030 年)
 全球防爆設備市場:未來預測(2025-2030年)
 防爆設備市場規模、佔有率、趨勢分析報告:按保護方法、產業、系統、地區、細分市場預測,2025-2030 年拉丁美洲防爆設備:市場佔有率分析、產業趨勢與成長預測(2025-2030)