


 |
市場調查報告書
商品編碼
2122004
先進計量基礎設施(AMI):市場佔有率分析、產業趨勢與統計數據及成長預測(2026-2031 年)Advanced Metering Infrastructure - Market Share Analysis, Industry Trends & Statistics, Growth Forecasts (2026 - 2031) |
||||||

※ 本網頁內容可能與最新版本有所差異。詳細情況請與我們聯繫。
根據 Mordor Intelligence 預測,先進計量基礎設施 (AMI) 市場規模將從 2025 年的 196.9 億美元成長到 2026 年的 221.6 億美元,然後在 2031 年達到 400.6 億美元,2026 年至 2031 年的複合年成長率為 12.5%。
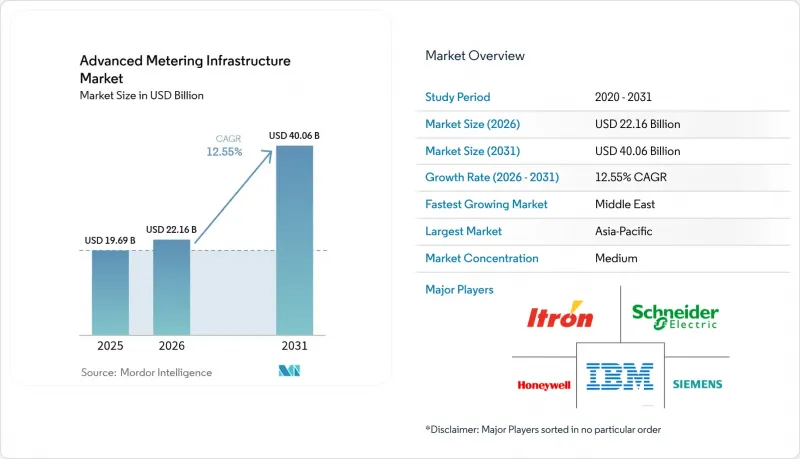
本報告按應用領域(智慧電錶設備應用[電力、水、燃氣])、解決方案(計量通訊基礎設施、計量資料管理軟體、計量資料分析軟體)、服務[專業服務、託管服務]、最終用戶(住宅、商業、工業)和地區進行細分。市場預測以美元計價。
全球先進計量基礎設施 (AMI) 市場趨勢與洞察
政府強制推行智慧電錶
此類強制性措施將自願升級轉變為強制項目,確保供應商和投資者的需求可見度。澳洲強制所有家庭在2030年前安裝智慧電錶的計畫促成了批量採購,降低了電錶成本,並加快了公共產業的競標。
在德國,年用電量超過6000千瓦時的用戶必須安裝智慧電錶系統,迫使配電業者在資金預算有限的情況下制定安裝計畫。印度的國家計劃在2026年部署2.5億台智慧電錶,目前是全球規模最大的單一項目,該計劃制定了標準化規範,實現了多家供應商之間的互通性和規模經濟。在強制安裝智慧電錶的地區,公共產業通常可以獲得更低的利率,因為貸款機構認為法定項目比自願試點計畫風險更低。確定的部署計劃也有利於無線模組的本地組裝,並有助於減輕半導體供應鏈中的地緣政治衝擊。
透過遠端抄表降低公共產業成本
人事費用的即時降低增強了投資的合理性,尤其對於服務大範圍地區的電力和燃氣公司而言更是如此。約克郡水務公司自採用高級計量基礎設施 (AMI) 以來,已將人工抄表成本降低了 90%,並顯著減少了客戶帳單糾紛。現場巡檢次數的減少降低了燃料成本和碳排放,而自動抄表則顯著減少了以往扭曲現金流的預估帳單調整。這使得電力和燃氣公司能夠將現場技術人員重新部署到更高價值的巡檢任務中,在無需新招聘的情況下改善資產狀況。在地形複雜的地區,遠端抄表消除了因抄表員位於被淹地下室或偏遠棚屋等危險場所而帶來的安全隱患。這些優勢結合起來,可將投資回收期縮短至短短三年,並增強董事會對 AMI 持續資金籌措的信心。
高初始資本投入
如果將通訊回程傳輸、前端軟體和整合服務等費用計入,每台電錶的總擁有成本將躍升至 200 至 400 美元。由於缺乏多年收費保證,小規模的合作社和地方政府公共產業更難獲得融資。供應商融資可以緩解這種壓力,但通常伴隨著高利率,抵消了任何成本節約。同時,網路安全、員工技能再培訓和消費者意識宣傳等方面的投資進一步推高了部署前兩年的資本支出高峰。雖然存在津貼優惠貸款,但它們很少能涵蓋專案管理成本或電網整合費用,從而延長了融資緊張的營運商的決策週期。
細分市場分析
到2025年,電力計量應用將佔高級計量基礎設施(AMI)市場佔有率的62.05%。這反映了監管機構對電力產業脫碳計畫的重視。該領域受益於標準化的電錶通訊協定、遠端斷電功能以及即時阻止竊電的能力。已實施間隔數據分析的公用事業公司報告稱,計費準確率提高了99.5%以上,從而減少了收入損失和客戶服務諮詢。相較之下,供水事業實施AMI的主要目的是為了解決「無收益水」問題,在老化的供水網路中,無收益水的比例可能超過25%。水錶產業的複合年成長率(CAGR)為13.12%,反映了加州和澳洲乾旱的影響日益加劇,在這些地區,洩漏偵測警報可以將損失減少高達20%。與此同時,燃氣表產業的成長正在放緩。這是因為防爆認證會使瓦斯表的標價增加約30%,而且住宅維修通常需要進入房屋,而消費者不願意這麼做。
應用程式配置正在影響軟體支出模式。隨著公共產業意識到在提取洞察之前,可擴展地採集和清洗15分鐘間隔資料的重要性,計量資料管理平台在2025年將佔總收入的40.96%。計量資料分析正以12.83%的複合年成長率發展,公用事業公共產業正將預測性維護和盜水檢測模型整合到現有資料集中。因此,「電力優先」的公用事業公司正在將其軟體與硬體支出比率從2022年的0.3:1提高到2025年的0.5:1,這表明其關注點正從完成部署轉向創造價值。在銷售點將分析功能與前端許可證捆綁銷售的供應商,其業績優於將分析功能作為可選附加元件銷售的供應商。
區域分析
預計到2025年,亞太地區將佔據全球高級計量基礎設施(AMI)市場40.22%的佔有率。這推動要素印度承諾在2026年安裝2.5億台電錶,以及中國正在進行的超高壓電網升級改造。批量採購框架使電錶的平均售價較北美合約降低了18%,並鼓勵公共產業採用可同時處理電力、水和燃氣的多功能平台。然而,對從美國採購的射頻模組的出口限制增加了前置作業時間的不確定性,促使國有製造商實現無線產品生產的在地化。
北美地區仍然是一個成熟且創新主導的地區,德克薩斯州和安大略省的私人5G網路正在蓬勃發展。美國公共產業將高達15%的AMI預算用於網路安全,這反映了北美電力可靠性委員會(NERC)網路安全改進計劃(CIP)的嚴格執行。加拿大的寒冷氣候規範要求鋰亞亞硫醯氯電池和雙頻網狀無線電即使在-40 度C的低溫下也能正常運作,這迫使供應商設計具有氣候適應性的改進方案。墨西哥的政策自由化允許獨立電力生產商(IPP)參與AMI聯合資金籌措,以換取存取即時載入資料的權限,從而最佳化商業電廠的輸出控制。
歐洲的發展趨勢取決於歐盟的「綠色數位分類法」框架,該框架將從2025年起為在其整個生命週期內減少二氧化碳排放的電錶提供獎勵。在德國,法律強制要求電網營運商將智慧電錶與節能儀錶板整合,而英國競爭激烈的電錶市場則在推動創新管理服務的提供。
中東地區實現了最高的複合年成長率,達到12.95%。沙烏地阿拉伯和阿拉伯聯合大公國已將高級計量基礎設施(AMI)納入其智慧城市計劃,並將其與強制性屋頂太陽能發電和電動車充電基礎設施相結合。非洲的成長仍處於起步階段,但具有重要的戰略意義。南非電力公司正在實施AMI以遏制超過20%的非技術性損耗,而奈及利亞配電公司DISCO正在試行預付式智慧電錶以穩定現金流。
其他好處:
- Excel格式的市場預測(ME)表
- 3個月的分析師支持
目錄
第1章:引言
- 研究假設和市場定義
- 調查範圍
第2章:調查方法
第3章執行摘要
第4章 市場狀況
- 市場促進因素
- 政府關於引入智慧電錶的強制性規定
- 透過遠端抄表降低公用事業成本
- 分散式能源資源整合與動態定價
- 歐盟綠色數位分類法下的獎勵(2025年起)
- 面向低延遲 AMI 的專用 5G 公用事業網路
- 津貼促進國內半導體生產,降低了電錶元件的成本。
- 市場限制因素
- 大量初始資本投資
- 網路安全和資料隱私問題
- 射頻元件的出口限制
- 公共產業工人工會抵制遠端停工
- 產業價值鏈分析
- 監理情勢
- 技術展望
- 宏觀經濟因素的影響
- 波特五力分析
第5章 市場規模與成長預測
- 透過使用
- 智慧電錶設備的應用
- 電力
- 供水
- 氣體
- 解決方案
- 計量通訊基礎設施
- 計量資料管理軟體
- 儀表數據分析軟體
- 服務
- 專業(專案管理、實施、諮詢)
- 管理
- 智慧電錶設備的應用
- 最終用戶
- 住宅
- 商業
- 產業
- 按地區
- 北美洲
- 美國
- 加拿大
- 墨西哥
- 南美洲
- 巴西
- 阿根廷
- 其他南美國家
- 歐洲
- 德國
- 英國
- 法國
- 義大利
- 其他歐洲國家
- 亞太地區
- 中國
- 日本
- 印度
- 韓國
- 澳洲和紐西蘭
- 其他亞太國家
- 中東
- 沙烏地阿拉伯
- 阿拉伯聯合大公國
- 土耳其
- 其他中東國家
- 非洲
- 南非
- 奈及利亞
- 肯亞
- 其他非洲國家
- 北美洲
第6章 競爭情勢
- 市場集中度
- 策略趨勢
- 市佔率分析
- 公司簡介
- Itron Inc.
- Landis+Gyr Group AG
- Sensus USA Inc.(Xylem Inc.)
- Siemens Aktiengesellschaft
- Schneider Electric SE
- Honeywell International Inc.
- IBM Corporation
- Cisco Systems Inc.
- Aclara Technologies LLC
- Trilliant Holdings Inc.
- Kamstrup A/S
- Badger Meter Inc.
- Diehl Metering GmbH
- Neptune Technology Group Inc.
- Wasion Group Holdings Ltd.
- EDMI Limited
- Hexing Electrical Co. Ltd.
- Iskraemeco dd
- Aichi Tokei Denki Co. Ltd.
- Apator SA
第7章 市場機會與未來展望
According to Mordor Intelligence, the advanced metering infrastructure market size is expected to grow from USD 19.69 billion in 2025 to USD 22.16 billion in 2026 and is forecast to reach USD 40.06 billion by 2031 at 12.55% CAGR over 2026-2031.
This report is Segmented by Application Type (Smart Metering Devices Application [Electricity, Water, and Gas]; Solution (Meter Communication Infrastructure, Meter Data Management Software, and Meter Data Analytics Software); and Services [Professional, and Managed]), End-User (Residential, Commercial, and Industrial), and Geography. The Market Forecasts are Provided in Terms of Value (USD).
Global Advanced Metering Infrastructure Market Trends and Insights
Government Mandates for Smart-Meter Roll-Outs
Mandates transform discretionary upgrades into compulsory projects that guarantee demand visibility for suppliers and financiers. Australia's program obliging every household to adopt smart meters by 2030 triggered bulk procurement that compressed meter unit costs and accelerated utility tenders.
Germany is enforcing intelligent measuring systems for customers consuming more than 6,000 kWh annually, compelling distribution system operators to schedule installations despite capital-budget constraints. India's national mission targeting 250 million smart meters by 2026 is now the world's largest single program, creating standardized specifications that enable multi-vendor interoperability and scale economies.Utilities in mandated regions routinely secure lower interest rates because lenders treat statutory projects as lower risk than voluntary pilots. The certainty surrounding rollout timelines also incentivizes local assembly of radio modules, cushioning geopolitical shocks in semiconductor supply chains.
Utility Cost-Savings from Remote Meter Reading
Immediate labor savings strengthen investment cases, especially for utilities serving dispersed territories. Yorkshire Water eliminated 90% of manual meter-reading costs and materially cut customer-billing disputes after switching to AMI.Reduced truck rolls curb fuel expenses and carbon emissions, while automated reads slash estimated billing adjustments that previously distorted cash flows. Utilities can then redeploy field technicians toward higher-value inspections, enhancing asset health without hiring new staff. In territories with challenging terrain, remote reads remove safety hazards tied to accessing meters in flooded basements or remote cabins. Collectively, these benefits compress payback periods to as little as three years, reinforcing board-level confidence in successive AMI funding rounds.
High Upfront Capital Expenditure
Total cost of ownership climbs to USD 200-400 per meter once communication backhaul, head-end software, and integration services are included. Smaller cooperatives and municipal utilities find it harder to raise debt because they lack multi-year rate-recovery guarantees. Vendor financing can relieve pressure but often carries higher interest rates that erode savings. Parallel investments in cybersecurity, workforce reskilling, and consumer outreach push capex peaks even higher during the first two years of rollout. While grants and concessional loans exist, they rarely cover project-management or grid-integration costs, prolonging decision cycles among cash-constrained operators.
Other drivers and restraints analyzed in the detailed report include:
- Integration of Distributed Energy Resources and Dynamic Pricing
- Private 5G Utility Networks for Low-Latency AMI
- Cybersecurity and Data-Privacy Concerns
For complete list of drivers and restraints, kindly check the Table Of Contents.
Segment Analysis
Electricity metering applications commanded 62.05% of Advanced Metering Infrastructure market share in 2025, mirroring regulators' focus on power-sector decarbonization timelines. This segment benefits from standardized meter communication protocols, remote disconnect features, and the immediate ability to curtail theft. Utilities deploying interval-data analytics report billing-accuracy improvements above 99.5%, which reduces revenue leakage and customer service calls. In contrast, water utilities are adopting AMI primarily to tackle non-revenue water that can exceed 25% in aging networks. Water metering's 13.12% CAGR reflects rising drought exposure in California and Australia, where leak-detection alerts can lower losses by up to 20%. Gas metering lags because explosion-proof certification adds roughly 30% to meter list prices, and residential retrofits often require in-premise appointments that consumers resist.
The application mix influences software spending patterns. Meter data management platforms captured 40.96% of 2025 revenues, as utilities realized that scalable ingestion and cleansing of 15-minute interval data is essential before deriving insights. Meter data analytics is advancing at 12.83% CAGR, with utilities layering predictive maintenance and theft-detection models onto existing datasets. Electricity-first utilities are therefore increasing software-to-hardware spend ratios from 0.3:1 in 2022 to 0.5:1 by 2025, signaling a pivot from roll-out completion to value extraction. Vendors bundling analytics with head-end licenses at point of sale are outperforming those selling analytics as optional add-ons.
Complete Report Scope:
- By Application Type
- Smart Metering Devices Application
- Electricity
- Water
- Gas
- Solution
- Meter Communication Infrastructure
- Meter Data Management Software
- Meter Data Analytics Software
- Services
- Professional (Program Management, Deployment, Consulting)
- Managed
- Smart Metering Devices Application
- By End-User
- Residential
- Commercial
- Industrial
- By Geography
- North America
- United States
- Canada
- Mexico
- South America
- Brazil
- Argentina
- Rest of South America
- Europe
- Germany
- United Kingdom
- France
- Italy
- Rest of Europe
- Asia Pacific
- China
- Japan
- India
- South Korea
- Australia and New Zealand
- Rest of Asia Pacific
- Middle East
- Saudi Arabia
- United Arab Emirates
- Turkey
- Rest of Middle East
- Africa
- South Africa
- Nigeria
- Kenya
- Rest of Africa
- North America
Geography Analysis
Asia Pacific held 40.22% of Advanced Metering Infrastructure market share in 2025, anchored by India's commitment to install 250 million meters by 2026 and China's ongoing ultrahigh-voltage grid upgrades. Bulk procurement frameworks lower meter average selling prices by 18% compared with North American contracts, encouraging utilities to roll out multi-utility platforms that handle electricity, water, and gas concurrently. However, export-control limits on RF modules sourced from the United States add lead-time uncertainty, prompting state-run manufacturers to localize radio production capabilities.
North America remains a mature yet innovation-driven zone, with private 5G overlays gaining traction in Texas and Ontario. Utilities in the United States allocate up to 15% of AMI budgets to cybersecurity, reflecting stringent NERC CIP enforcement. Cold-weather specifications in Canada demand lithium-thionyl chloride batteries and dual-band mesh radios that maintain uptime at -40 °C, pushing vendors to design climate-robust variants. Mexico's policy liberalization invites independent power producers to co-finance AMI in exchange for access to real-time load data that optimize merchant plant dispatch.
Europe's trajectory hinges on the EU Green Digital Taxonomics framework, which grants post-2025 incentives for meters that prove lifecycle carbon reductions. Germany's legislated rollout milestones compel distribution grid operators to integrate smart meters with energy-saving dashboards, while the United Kingdom's competitive metering market fosters innovative managed service offerings.
The Middle East records the fastest regional CAGR of 12.95% as Saudi Arabia and the United Arab Emirates embed AMI into smart-city blueprints, dovetailing with rooftop solar mandates and electric-vehicle charging infrastructure. Africa's growth remains nascent but strategic; South African utilities deploy AMI to curb non-technical losses surpassing 20%, whereas Nigerian discos pilot prepaid smart meters to stabilize cash flow.
- Itron Inc.
- Landis+Gyr Group AG
- Sensus USA Inc. (Xylem Inc.)
- Siemens Aktiengesellschaft
- Schneider Electric SE
- Honeywell International Inc.
- IBM Corporation
- Cisco Systems Inc.
- Aclara Technologies LLC
- Trilliant Holdings Inc.
- Kamstrup A/S
- Badger Meter Inc.
- Diehl Metering GmbH
- Neptune Technology Group Inc.
- Wasion Group Holdings Ltd.
- EDMI Limited
- Hexing Electrical Co. Ltd.
- Iskraemeco d.d.
- Aichi Tokei Denki Co. Ltd.
- Apator SA
Additional Benefits:
- The market estimate (ME) sheet in Excel format
- 3 months of analyst support
TABLE OF CONTENTS
1 INTRODUCTION
- 1.1 Study Assumptions and Market Definition
- 1.2 Scope of the Study
2 RESEARCH METHODOLOGY
3 EXECUTIVE SUMMARY
4 MARKET LANDSCAPE
- 4.1 Market Drivers
- 4.1.1 Government mandates for smart-meter roll-outs
- 4.1.2 Utility cost-savings from remote meter reading
- 4.1.3 Integration of distributed energy resources and dynamic pricing
- 4.1.4 Post-2025 EU Green Digital Taxonomics incentives
- 4.1.5 Private 5G utility networks for low-latency AMI
- 4.1.6 Semiconductor localization grants lowering meter BOM
- 4.2 Market Restraints
- 4.2.1 High upfront capital expenditure
- 4.2.2 Cybersecurity and data-privacy concerns
- 4.2.3 Export-control limits on RF components
- 4.2.4 Utility workforce union resistance to remote disconnect
- 4.3 Industry Value Chain Analysis
- 4.4 Regulatory Landscape
- 4.5 Technological Outlook
- 4.6 Impact of Macroeconomic Factors
- 4.7 Porter's Five Forces Analysis
- 4.7.1 Threat of New Entrants
- 4.7.2 Bargaining Power of Buyers
- 4.7.3 Bargaining Power of Suppliers
- 4.7.4 Threat of Substitute Products
- 4.7.5 Intensity of Competitive Rivalry
5 MARKET SIZE AND GROWTH FORECASTS (VALUE)
- 5.1 By Application Type
- 5.1.1 Smart Metering Devices Application
- 5.1.1.1 Electricity
- 5.1.1.2 Water
- 5.1.1.3 Gas
- 5.1.2 Solution
- 5.1.2.1 Meter Communication Infrastructure
- 5.1.2.2 Meter Data Management Software
- 5.1.2.3 Meter Data Analytics Software
- 5.1.3 Services
- 5.1.3.1 Professional (Program Management, Deployment, Consulting)
- 5.1.3.2 Managed
- 5.1.1 Smart Metering Devices Application
- 5.2 By End-User
- 5.2.1 Residential
- 5.2.2 Commercial
- 5.2.3 Industrial
- 5.3 By Geography
- 5.3.1 North America
- 5.3.1.1 United States
- 5.3.1.2 Canada
- 5.3.1.3 Mexico
- 5.3.2 South America
- 5.3.2.1 Brazil
- 5.3.2.2 Argentina
- 5.3.2.3 Rest of South America
- 5.3.3 Europe
- 5.3.3.1 Germany
- 5.3.3.2 United Kingdom
- 5.3.3.3 France
- 5.3.3.4 Italy
- 5.3.3.5 Rest of Europe
- 5.3.4 Asia Pacific
- 5.3.4.1 China
- 5.3.4.2 Japan
- 5.3.4.3 India
- 5.3.4.4 South Korea
- 5.3.4.5 Australia and New Zealand
- 5.3.4.6 Rest of Asia Pacific
- 5.3.5 Middle East
- 5.3.5.1 Saudi Arabia
- 5.3.5.2 United Arab Emirates
- 5.3.5.3 Turkey
- 5.3.5.4 Rest of Middle East
- 5.3.6 Africa
- 5.3.6.1 South Africa
- 5.3.6.2 Nigeria
- 5.3.6.3 Kenya
- 5.3.6.4 Rest of Africa
- 5.3.1 North America
6 COMPETITIVE LANDSCAPE
- 6.1 Market Concentration
- 6.2 Strategic Moves
- 6.3 Market Share Analysis
- 6.4 Company Profiles (includes Global level Overview, Market level overview, Core Segments, Financials as available, Strategic Information, Market Rank/Share for key companies, Products and Services, and Recent Developments)
- 6.4.1 Itron Inc.
- 6.4.2 Landis+Gyr Group AG
- 6.4.3 Sensus USA Inc. (Xylem Inc.)
- 6.4.4 Siemens Aktiengesellschaft
- 6.4.5 Schneider Electric SE
- 6.4.6 Honeywell International Inc.
- 6.4.7 IBM Corporation
- 6.4.8 Cisco Systems Inc.
- 6.4.9 Aclara Technologies LLC
- 6.4.10 Trilliant Holdings Inc.
- 6.4.11 Kamstrup A/S
- 6.4.12 Badger Meter Inc.
- 6.4.13 Diehl Metering GmbH
- 6.4.14 Neptune Technology Group Inc.
- 6.4.15 Wasion Group Holdings Ltd.
- 6.4.16 EDMI Limited
- 6.4.17 Hexing Electrical Co. Ltd.
- 6.4.18 Iskraemeco d.d.
- 6.4.19 Aichi Tokei Denki Co. Ltd.
- 6.4.20 Apator SA
7 MARKET OPPORTUNITIES AND FUTURE OUTLOOK
- 7.1 White-Space and Unmet-Need Assessment

 美國高級計量基礎設施 (AMI):市場佔有率分析、行業趨勢和統計數據以及成長預測 (2026-2031)
 智慧電錶和先進測量基礎設施市場預測——全球分析(按組件、電錶類型、通訊技術、應用、最終用戶和地區分類)——2034年
 AMI電錶市場規模、佔有率和成長分析:按電錶類型、通訊技術、組件、最終用途和地區分類-2026-2033年產業預測
 先進計量基礎設施市場:按組件、通訊技術、最終用戶和地區分類
 進階測量基礎設施 (AMI) 市場規模、佔有率、趨勢和預測:按產品類型、最終用戶和地區分類,2026-2034 年
 先進計量基礎設施市場:按組件、通訊技術、應用和最終用戶分類-2026-2032年全球市場預測
 2026年全球先進測量基礎設施市場報告2026年全球先進計量基礎設施(AMI)燃氣表市場報告
 高級計量基礎設施 (AMI) 市場規模、佔有率和預測:依計量類型(電力、燃氣、水)、通訊技術(PLC、RF Mesh、蜂窩網路)和智慧電網功能劃分 - 全球預測 (2026-2036)全球電能品質監測系統市場預測至2034年:依產品、設備類型、拓樸結構、應用、最終用戶及地區分類