


 |
市場調查報告書
商品編碼
1440545
葉面肥料:全球市場佔有率分析、產業趨勢與統計、成長預測(2024-2030)Global Foliar Fertilizer - Market Share Analysis, Industry Trends & Statistics, Growth Forecasts (2024 - 2030) |
||||||
價格
※ 本網頁內容可能與最新版本有所差異。詳細情況請與我們聯繫。
簡介目錄
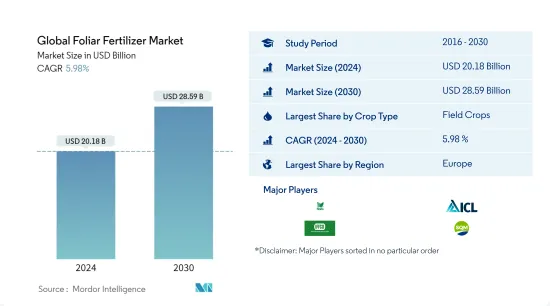
預計2024年全球葉面肥料市場規模為201.8億美元,預計2030年將達285.9億美元,預測期內(2024-2030年)複合年成長率為5.98%,預計還會成長。
主要亮點
- 氮肥:UAN等低淋溶氮肥因其毒性較小且不污染環境而受到世界各地農民的青睞。
- 氮肥:由於技術進步以及種植者對永續性和精密農業日益成長的興趣,氮肥葉面肥料市場成長最快。
- 按作物類型分類的最大部分 - 草坪/觀賞植物:種植面積的增加、對污染的日益關注以及世界各地生態旅遊的發展正在增加此類作物對肥料的需求。
- 最大的國家-美國:美國的土壤呈酸性,HH 值不平衡,增加了對葉面肥料的需求。
葉面肥料市場趨勢
按作物類型分類,田間作物是最大的部分。
- 2021年葉面施肥佔肥料市場總量的11.3%。 2021年葉面肥市場總量中,田間作物佔83.65%,園藝作物佔11.2%,草坪及觀賞作物佔其餘7.1%。全球90%以上的農業用地集中用於種植田間作物。
- 大田田間作物葉面肥料使用量的市場佔有率在亞太地區為 40.2%,在歐洲為 33.8%。 2021年南美洲佔22.0%的佔有率。葉面肥料的使用正在擴大,因為它們易於使用葉面噴布技術施用,並且養分吸收效率高。
- 2021年,亞太地區市場佔有率為28.9%,南美洲市佔率為23.64%,其中亞太和南美洲地區絕大多數在園藝作物中使用葉面肥料。包括中國和印度等國家在內的亞太地區是化肥消耗率最高的地區之一,並且有大面積的農業種植面積。根據資料顯示,佔世界園藝作物種植面積的73.0%。第二名是歐洲,佔 16.0%,第三名是北美,佔 2.0%。
- 由於擁有眾多高爾夫球場和私人草坪區,北美地區對於草坪和葉面肥料行業極為重要。美國的草坪涵蓋範圍積為 500 萬公頃,其中包括所有體育場、草坪和公園。
- 因此,全球各作物類型的葉面肥料消費量預計將在預測期內成長。
歐洲是最大的區域市場。
- 葉面肥料的施用在世界各地已應用作物,特別是在穀物和園藝作物上。
- 歐洲在葉面肥料市場上佔據主導地位,2021年佔市場佔有率的31.4%。研究期間成長了 10.4%。歐洲許多地區土壤微量元素的缺乏嚴重影響作物的產量和質量,特別是土壤缺乏錳、鋅和鐵。實證研究表明,該地區分別有60.0%和28.0%的土壤鐵、鋅含量不足。這可能會在預測期內推動該地區的市場。
- 研究期間,亞太葉面肥料市場呈現穩定成長,2021年總價值達59.9億美元,消費量1,240萬噸。田間作物佔比最高,為 83.1%,2021 年達 49.8 億美元。
- 在亞太地區,中國佔有43.1%的佔有率。在中國,農民廣泛向稻田散佈鋅和鐵,以提高作物產量。我國蔬果也廣泛採用葉面噴布微量元素來提升作物品質。
- 南美洲佔全球葉面噴布市場的18.0%。研究期間,該地區葉面噴布市場成長了36.0%,消費量成長了52.4%。預計該市場在預測期內的複合年成長率為 6.7%。
- 精密農業農業和保護性農業的採用,以及農業產量中對土壤微量元素的需求不斷增加,預計將推動全球對葉面肥料的需求。
葉面肥料業概況
全球葉面肥料市場分散,前五家企業佔20.00%。該市場的主要企業包括(按字母順序排列)Haifa Group.、ICL Specialty Fertilizers、IFFCO、Sociedad Química y Minera (SQM) 和 Yara North America。
其他福利:
- Excel 格式的市場預測 (ME) 表
- 3 個月的分析師支持
目錄
第1章執行摘要和主要發現
第2章 檢舉要約
第3章簡介
- 研究假設和市場定義
- 調查範圍
- 調查方法
第4章 產業主要趨勢
- 主要作物種植面積
- 平均養分施用量
- 法律規範
- 價值鍊和通路分析
第5章市場區隔
- 類型
- 複雜的
- 直的
- 按營養成分
- 微量元素
- 氮
- 磷酸
- 鉀
- 次要營養素
- 作物類型
- 田間作物
- 園藝作物
- 用於草坪/裝飾用途
- 地區
- 亞太地區
- 澳洲
- 孟加拉
- 中國
- 印度
- 印尼
- 日本
- 巴基斯坦
- 菲律賓
- 泰國
- 越南
- 其他亞太地區
- 歐洲
- 法國
- 德國
- 義大利
- 荷蘭
- 俄羅斯
- 西班牙
- 烏克蘭
- 英國
- 其他歐洲國家
- 中東/非洲
- 奈及利亞
- 沙烏地阿拉伯
- 南非
- 土耳其
- 其他中東和非洲
- 北美洲
- 加拿大
- 墨西哥
- 美國
- 北美其他地區
- 南美洲
- 阿根廷
- 巴西
- 南美洲其他地區
- 亞太地區
第6章 競爭形勢
- 重大策略舉措
- 市場佔有率分析
- 公司形勢
- 公司簡介
- Compo Expert
- Haifa Group.
- ICL Specialty Fertilizers
- IFFCO
- Koch Fertilizer LLC
- Sociedad Quimica y Minera(SQM)
- The Mosaic Company
- UPL Limited
- Yara North America
第7章 CEO 面臨的關鍵策略問題
第8章附錄
- 世界概況
- 概述
- 五力分析框架
- 世界價值鏈分析
- 市場動態(DRO)
- 資訊來源和參考文獻
- 圖表列表
- 重要見解
- 資料包
- 詞彙表
簡介目錄
Product Code: 92597
The Global Foliar Fertilizer Market size is estimated at USD 20.18 billion in 2024, and is expected to reach USD 28.59 billion by 2030, growing at a CAGR of 5.98% during the forecast period (2024-2030).
Key Highlights
- Largest segment by Type - Nitrogenous : Nitrogenous fertilizers like UAN which is less prone to leaching are preferred by farmers around the globe due to its less toxicity with no environmental pollution.
- Fastest growing by Type - Nitrogenous : The nitrogenous foliar fertilizer market is the fastest growing due to technological advancements and increased growers focus on sustainability and precision farming.
- Largest Segment by Crop Type - Turf & Ornamental : The increasing area under cultivation with increasing concern over pollution and growing ecotourism across the globe has increased the fertilizer demand for such crops.
- Largest segment by Country - United States : The acidic nature and pH imbalances in soils of the United States raised the demand for foliar fertilizers, which can be applied directly on plant parts for easy absorption.
Foliar Fertilizer Market Trends
Field Crops is the largest segment by Crop Type.
- The foliar method of fertilizer application accounted for 11.3% of the overall fertilizer market value in 2021. Field crops accounted for 83.65%, horticultural crops accounted for 11.2%, and turfs and ornamental crops accounted for the remaining 7.1% of the total fertigation fertilizers market in 2021. More than 90% of the world's agricultural acreage is focused on the cultivation of field crops.
- Asia-Pacific and European areas held a market share of 40.2% and 33.8%, respectively, for the usage of foliar fertilizers in field crops. South America accounted for a share of 22.0% in 2021. The use of foliar fertilizers is expanding due to their ease of application via foliar spraying techniques, which also have better efficiency of nutrient uptake.
- With a market share of 28.9% and 23.64%, respectively, the Asia-Pacific and South American regions dominated the use of foliar fertilizers in horticultural crops in 2021. The Asia-Pacific region, which includes nations like China and India, is one of the regions with the highest fertilizer consumption rates and has a vast area dedicated to agricultural cultivation. According to the data, it accounted for 73.0% of the global area under horticultural crop cultivation. Europe and North America came in second and third, with 16.0% and 2.0% of the market share.
- Due to the presence of a large number of golf courses and private lawn areas, the North American region is crucial for the turf and ornamental foliar fertilizer segment. Turf grass covers 5.0 million ha of land in the United States, which includes all stadiums, lawns, and parks.
- Therefore, the global consumption of foliar fertilizers in respective crop types is anticipated to grow during the forecast period.
Europe is the largest segment by Region.
- Foliar application of fertilizers has long been practiced in many crops, particularly in cereal and horticulture crops globally.
- Europe dominated the foliar fertilizers market, accounting for 31.4% of the market share in 2021. It grew by 10.4% during the study period. Soil micronutrient deficiencies significantly affect crop yield and quality in many areas in Europe, such as manganese, zinc, and iron soil deficiencies are noted. Empirical studies have shown that 60.0% and 28.0% of the regional soil contained lower than-adequate levels of iron and zinc, respectively. It will drive the market in the region during the forecast period.
- The Asia-Pacific foliar fertilizer market witnessed stable growth during the study period, with an overall value amounting to USD 5.99 billion in 2021 with a consumption volume of 12.4 million metric ton. Field crops occupied the highest share of 83.1%, valued at USD 4.98 billion in 2021.
- Among the countries, China dominated the APAC region, accounting for 43.1% of the market share. In China, farmers extensively apply zinc and iron to paddy fields to enhance crop yields. The foliar application of micronutrients is also widely practiced for fruits and vegetables in China to improve the quality of the crop.
- South America accounted for 18.0% of the global foliar market. The market for foliar applications in the region has increased by 36.0% during the study period, and the consumption by volume has increased by 52.4%. The market is estimated to register a CAGR of 6.7% during the forecast period.
- The adoption of precision farming and protected agriculture and a rise in demand for soil micronutrients in agricultural yield is anticipated to boost the demand for foliar fertilizers globally.
Foliar Fertilizer Industry Overview
The Global Foliar Fertilizer Market is fragmented, with the top five companies occupying 20.00%. The major players in this market are Haifa Group., ICL Specialty Fertilizers, IFFCO, Sociedad Quimica y Minera (SQM) and Yara North America (sorted alphabetically).
Additional Benefits:
- The market estimate (ME) sheet in Excel format
- 3 months of analyst support
TABLE OF CONTENTS
1 EXECUTIVE SUMMARY & KEY FINDINGS
2 REPORT OFFERS
3 INTRODUCTION
- 3.1 Study Assumptions & Market Definition
- 3.2 Scope of the Study
- 3.3 Research Methodology
4 KEY INDUSTRY TRENDS
- 4.1 Acreage Of Major Crop Types
- 4.2 Average Nutrient Application Rates
- 4.3 Regulatory Framework
- 4.4 Value Chain & Distribution Channel Analysis
5 MARKET SEGMENTATION
- 5.1 Type
- 5.1.1 Complex
- 5.1.2 Straight
- 5.1.2.1 By Nutrient
- 5.1.2.1.1 Micronutrients
- 5.1.2.1.2 Nitrogenous
- 5.1.2.1.3 Phosphatic
- 5.1.2.1.4 Potassic
- 5.1.2.1.5 Secondary Macronutrients
- 5.2 Crop Type
- 5.2.1 Field Crops
- 5.2.2 Horticultural Crops
- 5.2.3 Turf & Ornamental
- 5.3 Region
- 5.3.1 Asia-Pacific
- 5.3.1.1 Australia
- 5.3.1.2 Bangladesh
- 5.3.1.3 China
- 5.3.1.4 India
- 5.3.1.5 Indonesia
- 5.3.1.6 Japan
- 5.3.1.7 Pakistan
- 5.3.1.8 Philippines
- 5.3.1.9 Thailand
- 5.3.1.10 Vietnam
- 5.3.1.11 Rest Of Asia-Pacific
- 5.3.2 Europe
- 5.3.2.1 France
- 5.3.2.2 Germany
- 5.3.2.3 Italy
- 5.3.2.4 Netherlands
- 5.3.2.5 Russia
- 5.3.2.6 Spain
- 5.3.2.7 Ukraine
- 5.3.2.8 United Kingdom
- 5.3.2.9 Rest Of Europe
- 5.3.3 Middle East & Africa
- 5.3.3.1 Nigeria
- 5.3.3.2 Saudi Arabia
- 5.3.3.3 South Africa
- 5.3.3.4 Turkey
- 5.3.3.5 Rest Of Middle East & Africa
- 5.3.4 North America
- 5.3.4.1 Canada
- 5.3.4.2 Mexico
- 5.3.4.3 United States
- 5.3.4.4 Rest Of North America
- 5.3.5 South America
- 5.3.5.1 Argentina
- 5.3.5.2 Brazil
- 5.3.5.3 Rest Of South America
- 5.3.1 Asia-Pacific
6 COMPETITIVE LANDSCAPE
- 6.1 Key Strategic Moves
- 6.2 Market Share Analysis
- 6.3 Company Landscape
- 6.4 Company Profiles
- 6.4.1 Compo Expert
- 6.4.2 Haifa Group.
- 6.4.3 ICL Specialty Fertilizers
- 6.4.4 IFFCO
- 6.4.5 Koch Fertilizer LLC
- 6.4.6 Sociedad Quimica y Minera (SQM)
- 6.4.7 The Mosaic Company
- 6.4.8 UPL Limited
- 6.4.9 Yara North America
7 KEY STRATEGIC QUESTIONS FOR FERTILIZER CEOS
8 APPENDIX
- 8.1 Global Overview
- 8.1.1 Overview
- 8.1.2 Porter's Five Forces Framework
- 8.1.3 Global Value Chain Analysis
- 8.1.4 Market Dynamics (DROs)
- 8.2 Sources & References
- 8.3 List of Tables & Figures
- 8.4 Primary Insights
- 8.5 Data Pack
- 8.6 Glossary of Terms


