


 |
市場調查報告書
商品編碼
1440537
液體肥料:全球市場佔有率分析、產業趨勢與統計、成長預測(2024-2030)Global Liquid Fertilizer - Market Share Analysis, Industry Trends & Statistics, Growth Forecasts (2024 - 2030) |
||||||
價格
※ 本網頁內容可能與最新版本有所差異。詳細情況請與我們聯繫。
簡介目錄
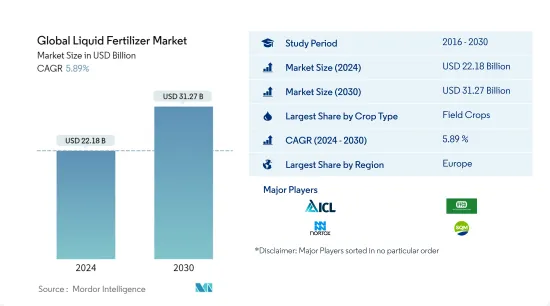
預計2024年全球液體肥料市場規模為221.8億美元,預計到2030年將達到312.7億美元,在預測期內(2024-2030年)成長5.89%,年複合成長率為
主要亮點
- 按類型分類最大的部分 - 氮肥:UAN 等低淋溶氮肥因其毒性低且無環境污染而受到世界各地農民的青睞。
- 生長最快的類型 - 微量營養素:液體肥料可以快速解決微量營養素缺乏的問題,液體肥料可以以易於吸收的形式直接散佈用於植物的葉子。
- 按作物類型分類的最大部分 - 草坪和觀賞植物:人們對世界各地污染和生態旅遊擴張的日益擔憂正在增加耕地面積,從而增加了此類作物對肥料的需求。
- 美國國家:美國土壤呈酸性,這增加了對液體肥料的需求,以維持土壤 pH 值並避免養分淋溶損失。
液體肥料市場趨勢
按作物類型分類,田間作物是最大的部分。
- 田間作物在全球液體肥料市場佔據主導地位,約佔液體肥料總消費量的80.2%。 2022年液體肥料消費量為3,180萬噸,相當於223.4億美元。由於田間作物作物面積大,液體肥料消耗量大。全球90.0%以上的農業用地用於種植田間作物。
- 園藝作物是液體作物的第二大消費領域,2022年約佔全球液體肥料消費量的12.9%。
- 由於 COVID-19感染疾病後人們更加關注健康和營養,世界各地對水果和蔬菜等高價值作物的需求正在增加。番茄、馬鈴薯、洋蔥、捲心菜和花椰菜等高需求蔬菜作物消耗大量肥料,並且全年種植。葉面噴布液體肥料在水果作物可以提高水果品質。
- 草坪和觀賞作物約佔全球液體肥料市場總量的6.4%,市值為18.5億美元,2022年消費量量將達270萬噸。
- 對污染的擔憂、美麗的園林花園日益重要以及世界各地的生態旅遊正在增加草坪和觀賞作物的種植面積。
- 因此,全球每種作物類型的液體肥料消費量預計在預測期內將進一步增加。
按地區分類,歐洲是最大的部分。
- 2021年全球液體肥料市場價值279.9億美元,消費量量3,900萬噸。
- 歐洲地區是全球最大的液體肥料市場,約佔液體肥料市場總量的29.0%,2021年市場規模約81.6億美元。歐洲在液體肥料市場的優勢得益於該地區更好的灌溉系統。例如,德國、俄羅斯、英國和法國等國家超過55%的灌溉土地覆蓋有噴灌或微灌溉系統,推動了該地區的市場。
- 亞太地區是第二大液體肥料市場,2021年市佔率為22.09%。中國和印度是該地區最大的液體肥料市場,2021年所佔比例分別為42.0%和21.0%。該地區以田間作物種植為主,約佔該地區液肥消耗總量的83.1%。
- 該地區各國政府繼續透過價格補貼促進微型灌溉系統的採用。因此,隨著先進灌溉方法的採用增加,未來該地區液體肥料的使用預計將會增加。同時,2021年南美洲的佔有率為18.0%,其次是北美的佔有率為16%。
- 因此,由於施用方便、分佈均勻和降低施用成本,液體肥料的使用量趨於增加。這些因素可能會在預測期內推動液體肥料市場的發展。
液體肥料產業概況
全球液體肥料市場較為分散,前5家企業佔12.94%。該市場的主要企業有 ICL Fertilizers、IFFCO、Nortox、SQM、Yara International ASA(按字母順序排列)。
其他福利
- Excel 格式的市場預測 (ME) 表
- 3 個月分析師支持
目錄
第1章執行摘要和主要發現
第2章 檢舉要約
第3章簡介
- 研究假設和市場定義
- 調查範圍
- 調查方法
第4章 產業主要趨勢
- 主要作物種植面積
- 平均養分施用量
- 法律規範
- 價值鍊和通路分析
第5章市場區隔
- 類型
- 複雜的
- 直的
- 按營養成分
- 微量營養素
- 含氮的
- 磷酸鹽
- 鉀
- 次要大量營養素
- 如何使用
- 滴水
- 葉面
- 作物類型
- 田裡的作物
- 園藝作物
- 草坪和裝飾
- 地區
- 亞太地區
- 澳洲
- 孟加拉
- 中國
- 印度
- 印尼
- 日本
- 巴基斯坦
- 菲律賓
- 泰國
- 越南
- 其他亞太地區
- 歐洲
- 法國
- 德國
- 義大利
- 荷蘭
- 俄羅斯
- 西班牙
- 烏克蘭
- 英國
- 其他歐洲國家
- 中東和非洲
- 奈及利亞
- 沙烏地阿拉伯
- 南非
- 土耳其
- 其他中東和非洲
- 北美洲
- 加拿大
- 墨西哥
- 美國
- 北美其他地區
- 南美洲
- 阿根廷
- 巴西
- 南美洲其他地區
- 亞太地區
第6章 競爭形勢
- 重大策略舉措
- 市場佔有率分析
- 公司形勢
- 公司簡介
- BMS Micro-Nutrients NV
- Compo Expert
- ICL Fertilizers
- IFFCO
- Nortox
- Safsulfur
- SQM
- Yara International ASA
第7章 CEO 面臨的關鍵策略問題
第8章附錄
- 世界概況
- 概述
- 波特的五力框架
- 全球價值鏈分析
- 市場動態(DRO)
- 來源和參考文獻
- 表格和圖形列表
- 重要見解
- 資料包
- 詞彙表
簡介目錄
Product Code: 92589
The Global Liquid Fertilizer Market size is estimated at USD 22.18 billion in 2024, and is expected to reach USD 31.27 billion by 2030, growing at a CAGR of 5.89% during the forecast period (2024-2030).
Key Highlights
- Largest segment by Type - Nitrogenous : Nitrogenous fertilizers like UAN which is less prone to leaching are preferred by farmers around the globe due to its less toxicity with no environmental pollution.
- Fastest growing by Type - Micronutrients : Micronutrient deficiency can be quickly addressed by liquid fertilizers, as they are in an easily absorbable form and can directly be sprayed on plant foliage.
- Largest Segment by Crop Type - Turf & Ornamental : The increasing area under cultivation with increasing concern over pollution and growing ecotourism across the globe has increased the fertilizer demand for such crops.
- Largest segment by Country - United States : The acidic nature of the soil in the United States raised the demand for liquid fertilizers to maintain the pH of the soil and avoid leaching losses of nutrients.
Liquid Fertilizers Market Trends
Field Crops is the largest segment by Crop Type.
- Field crops dominated the global liquid fertilizer market, accounting for about 80.2% of the total liquid fertilizer consumption. Their volume consumption of liquid fertilizers was 31.8 million metric tons, worth USD 22.34 billion in 2022. The large consumption of liquid fertilizers by field crops is due to the large area under the cultivation of these crops. More than 90.0% of the global agricultural land is dedicated to the cultivation of field crops.
- Horticultural crops are the second-largest crop types that consume liquid fertilizers, accounting for about 12.9% of the global liquid fertilizer consumption in 2022.
- With increasing concerns for health and nutrition after the COVID-19 pandemic, the demand for high-value crops like fruits and vegetables is increasing worldwide. Vegetable crops with major demand, like tomato, potato, onion, cabbage, and cauliflower, consume high fertilizer and are grown throughout the year. Foliar liquid fertilizers play an important role in fruit crops, as foliar spraying is known to improve the quality of fruits.
- Turf and ornamental crops accounted for a share of about 6.4% of the total global liquid fertilizer market and were valued at USD 1.85 billion in 2022, with a volume consumption of 2.7 million metric tons.
- The area under the cultivation of turf and ornamental crops is increasing with concerns over pollution, the growing importance of aesthetic landscaping gardens, and ecotourism worldwide.
- Therefore, the global consumption of liquid fertilizers in respective crop types is anticipated to grow further during the forecast period.
Europe is the largest segment by Region.
- The global liquid fertilizers market was valued at USD 27.99 billion in 2021, with a volume consumption of 39.0 million metric tons.
- The European region was the largest market for liquid fertilizers in the world, accounting for about 29.0% of the total liquid fertilizer market, valued at about USD 8.16 billion in 2021. The dominance of Europe in the liquid fertilizer market was due to the presence of better irrigation systems in the region. For instance, countries like Germany, Russia, the United Kingdom, and France have more than 55% of the irrigated land covered by sprinklers or micro-irrigation systems, thus driving the market in the region.
- Asia-Pacific was the second-largest market for liquid fertilizers, with a share of 22.09% in 2021. China and India are the largest markets for liquid fertilizers in the region, with a share of 42.0% and 21.0%, respectively, in 2021. The cultivation of field crops is dominant in the region, accounting for about 83.1% of the total liquid fertilizers volume consumed in the region.
- Governments across the region are continuously promoting the adoption of micro-irrigation systems through price subsidies. Therefore, the adoption of liquid fertilizers in the region is expected to increase in the future, with the increased adoption of advanced irrigation methods. On the other hand, South America accounted for a share of 18.0%, followed by North America, with a share of 16%, in 2021.
- Hence, there is an increasing trend toward the adoption of liquid fertilizers due to ease of application, uniform distribution, and reduction in the cost of application. These factors may drive the liquid fertilizer market during the forecast period.
Liquid Fertilizers Industry Overview
The Global Liquid Fertilizer Market is fragmented, with the top five companies occupying 12.94%. The major players in this market are ICL Fertilizers, IFFCO, Nortox, SQM and Yara International ASA (sorted alphabetically).
Additional Benefits:
- The market estimate (ME) sheet in Excel format
- 3 months of analyst support
TABLE OF CONTENTS
1 EXECUTIVE SUMMARY & KEY FINDINGS
2 REPORT OFFERS
3 INTRODUCTION
- 3.1 Study Assumptions & Market Definition
- 3.2 Scope of the Study
- 3.3 Research Methodology
4 KEY INDUSTRY TRENDS
- 4.1 Acreage Of Major Crop Types
- 4.2 Average Nutrient Application Rates
- 4.3 Regulatory Framework
- 4.4 Value Chain & Distribution Channel Analysis
5 MARKET SEGMENTATION
- 5.1 Type
- 5.1.1 Complex
- 5.1.2 Straight
- 5.1.2.1 By Nutrient
- 5.1.2.1.1 Micronutrients
- 5.1.2.1.2 Nitrogenous
- 5.1.2.1.3 Phosphatic
- 5.1.2.1.4 Potassic
- 5.1.2.1.5 Secondary Macronutrients
- 5.2 Application Mode
- 5.2.1 Fertigation
- 5.2.2 Foliar
- 5.3 Crop Type
- 5.3.1 Field Crops
- 5.3.2 Horticultural Crops
- 5.3.3 Turf & Ornamental
- 5.4 Region
- 5.4.1 Asia-Pacific
- 5.4.1.1 Australia
- 5.4.1.2 Bangladesh
- 5.4.1.3 China
- 5.4.1.4 India
- 5.4.1.5 Indonesia
- 5.4.1.6 Japan
- 5.4.1.7 Pakistan
- 5.4.1.8 Philippines
- 5.4.1.9 Thailand
- 5.4.1.10 Vietnam
- 5.4.1.11 Rest Of Asia-Pacific
- 5.4.2 Europe
- 5.4.2.1 France
- 5.4.2.2 Germany
- 5.4.2.3 Italy
- 5.4.2.4 Netherlands
- 5.4.2.5 Russia
- 5.4.2.6 Spain
- 5.4.2.7 Ukraine
- 5.4.2.8 United Kingdom
- 5.4.2.9 Rest Of Europe
- 5.4.3 Middle East & Africa
- 5.4.3.1 Nigeria
- 5.4.3.2 Saudi Arabia
- 5.4.3.3 South Africa
- 5.4.3.4 Turkey
- 5.4.3.5 Rest Of Middle East & Africa
- 5.4.4 North America
- 5.4.4.1 Canada
- 5.4.4.2 Mexico
- 5.4.4.3 United States
- 5.4.4.4 Rest Of North America
- 5.4.5 South America
- 5.4.5.1 Argentina
- 5.4.5.2 Brazil
- 5.4.5.3 Rest Of South America
- 5.4.1 Asia-Pacific
6 COMPETITIVE LANDSCAPE
- 6.1 Key Strategic Moves
- 6.2 Market Share Analysis
- 6.3 Company Landscape
- 6.4 Company Profiles
- 6.4.1 BMS Micro-Nutrients NV
- 6.4.2 Compo Expert
- 6.4.3 ICL Fertilizers
- 6.4.4 IFFCO
- 6.4.5 Nortox
- 6.4.6 Safsulfur
- 6.4.7 SQM
- 6.4.8 Yara International ASA
7 KEY STRATEGIC QUESTIONS FOR FERTILIZER CEOS
8 APPENDIX
- 8.1 Global Overview
- 8.1.1 Overview
- 8.1.2 Porter's Five Forces Framework
- 8.1.3 Global Value Chain Analysis
- 8.1.4 Market Dynamics (DROs)
- 8.2 Sources & References
- 8.3 List of Tables & Figures
- 8.4 Primary Insights
- 8.5 Data Pack
- 8.6 Glossary of Terms
02-2729-4219
+886-2-2729-4219
 北美液體肥料:市場佔有率分析、行業趨勢和統計、成長預測(2025-2030 年)歐洲液體肥料:市場佔有率分析、行業趨勢和成長預測(2025-2030 年)
 2025 年全球液體肥料市場報告
 液體肥料市場:作物、類型、主要化合物、生產流程、應用分類 - 2025-2030 年全球預測全球液體肥料市場評估:依養分類型、配方、施用方法、作物類型、地區、機會、預測(2017-2031)
 2030 年液體肥料市場預測:按產品類型、作物類型、功能、化合物、應用、最終用戶和地區進行的全球分析2024-2032 年液體肥料市場報告(按類型、生產流程、作物、施用方式和地區)
 液體肥料市場、機會、成長動力、產業趨勢分析與預測,2024-2032
 2024-2028年全球液體肥料市場液體肥料市場,依作物類型、依化合物、依類型、依應用、依地理
▼