


 |
市場調查報告書
商品編碼
1440529
磷肥:全球市場佔有率分析、產業趨勢與統計、成長預測(2024-2030)Global Phosphatic Fertilizer - Market Share Analysis, Industry Trends & Statistics, Growth Forecasts (2024 - 2030) |
||||||
價格
※ 本網頁內容可能與最新版本有所差異。詳細情況請與我們聯繫。
簡介目錄
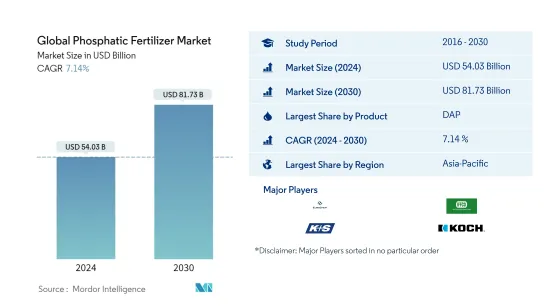
2024年全球磷肥市場規模估計為540.3億美元,預計到2030年將達到817.3億美元,在預測期間(2024-2030年)以7.14%的複合年增長率增長。
主要亮點
- 依類型分類成長最快的部分 - 過磷酸鈣:由於除了磷之外還含有鈣和硫,過磷酸鈣肥料具有更高的農藝效益。它所含的磷與水溶性肥料的反應方式相同。
- 依作物類型分類的最大區隔市場 -田間作物:田間作物在世界各地廣泛種植,並且是世界許多地區的主食。在大多數農業國家,它們在單位面積中所佔的佔有率最大。
- 以施用方式分類的最大部分 - 土壤:土壤施用是一種無需設備的便捷施肥方法。這種施用方法有助於改善植物健康和土壤肥力。
- 最大的國家 - 法國:由於化肥價格高昂,以金額為準,法國是世界上最大的磷肥消費國。但其肥料消費量較低。
磷肥市場走勢
以產品分類,DAP 是最大的區隔市場。
- 磷酸二銨(DAP)是全球使用最多的磷肥,佔磷肥總消費量量的45.0%,2022年用量為2850萬噸,市場價值177.達到6000萬美元。這是由於除了作為氮源的 18.0% 的銨含量外,磷酸鹽含量也高達 46.0%。
- 磷酸一銨 (MAP) 是繼 DAP 之後世界上第二受歡迎的磷肥。 2022年全球MAP市場價值94.2億美元,消費量1,260萬噸。到2022年,MAP將佔全球磷肥消耗總量的23.9%。
- 重過磷酸鈣是一種純磷基肥料,磷酸鹽含量為46.0%,是其他純磷肥中最高的。重過磷酸鈣佔全球磷肥總消費量的18.8%。 2022年全球重顆粒肥料市場價值76億美元,消費量290萬噸。
- 2022年,單一過磷酸鈣佔全球磷肥消耗總合的7.3%。 2022年過磷酸鈣肥料市場價值為29.3億美元,消費量為760萬噸。
- 亞太地區是最大的磷肥市場,佔全球磷肥市場的49%。其次是歐洲和南美洲,分別佔 35% 和 16% 的佔有率。
- 因此,由於越來越多的農民希望提高農作物產量以及全球對磷肥的需求不斷增加,作物市場預計將會成長。
亞太地區是最大的地區。
- 亞太地區主導全球磷肥市場,約佔市場總量的31.36%,2021年市場價值約133億美元。 2021年,磷酸二銨佔據亞太地區磷肥市場佔有率74.47%。市場。該地區對 DAP 的需求不斷成長,因為它比 TSP 和 SSP 等其他磷肥具有更高的效率。
- 中國是全球主要磷肥生產國之一,2016年約佔全球磷肥市場的41.4%。 2016年,中國出口占全球出口的25.3%。中國最大的進口國是印尼、澳洲和伊朗。
- 歐洲佔第二大市場,2021年約佔市場價值的28.53%。 2021年,TSP佔最大市場佔有率53.7%,田間作物領域佔2021年歐洲重過磷酸鈣市場最大佔有率。 2021 年田間作物市場價值為 48.5 億美元,預計到預測期(2022-2028 年)結束時將達到 56.7 億美元。
- 南美洲是第三大磷肥市場。預計 2021 年將佔市佔率 13.2%,預測期內複合年成長率為 7.0%。據觀察,在研究期間,該地區土壤中普遍存在的磷缺乏正在推動該地區的需求。
- 全球磷肥市場的金額和數量均呈成長趨勢,但 2020 年有所下降,主要是由於 COVID-19感染疾病大流行造成的中斷。然而,由於全球種植面積下降,全球磷肥市場價值預計在預測期內將增加。
磷肥業概況
全球磷肥市場較為分散,前5名企業佔30.22%。該市場的主要企業包括 Eurochem、IFFCO、K+S AKTIENGESELLSCHAFT、Koch Industries、Nutrien Limited(依字母順序排列)。
其他福利
- Excel 格式的市場預測 (ME) 表
- 3 個月分析師支持
目錄
第1章執行摘要和主要發現
第2章 提供報告
第3章簡介
- 研究假設和市場定義
- 調查範圍
- 調查方法
第4章 產業主要趨勢
- 主要作物種植面積
- 平均養分施用量
- 法律規範
- 價值鍊和通路分析
第5章市場區隔
- 類型
- 直的
- 磷酸鹽
- DAP
- MAP
- SSP
- TSP
- 其他
- 直的
- 如何使用
- 施肥
- 葉子
- 土壤
- 作物類型
- 田裡的作物
- 園藝作物
- 草坪和裝飾
- 地區
- 亞太地區
- 澳洲
- 孟加拉
- 中國
- 印度
- 印尼
- 日本
- 巴基斯坦
- 菲律賓
- 泰國
- 越南
- 其他亞太地區
- 歐洲
- 法國
- 德國
- 義大利
- 荷蘭
- 俄羅斯
- 西班牙
- 烏克蘭
- 英國
- 其他歐洲國家
- 中東和非洲
- 奈及利亞
- 沙烏地阿拉伯
- 南非
- 土耳其
- 其他中東和非洲
- 北美洲
- 加拿大
- 墨西哥
- 美國
- 北美其他地區
- 南美洲
- 阿根廷
- 巴西
- 南美洲其他地區
- 亞太地區
第6章 競爭形勢
- 重大策略舉措
- 市場佔有率分析
- 公司形勢
- 公司簡介
- Coromandel International Ltd.
- Eurochem
- IFFCO
- K+S AKTIENGESELLSCHAFT
- Koch Industries
- Nutrien Limited
- PhosAgro
- SABIC
第7章 CEO 面臨的關鍵策略問題
第8章附錄
- 世界概況
- 概述
- 波特的五力框架
- 全球價值鏈分析
- 市場動態(DRO)
- 來源和參考文獻
- 表格和圖形列表
- 重要見解
- 資料包
- 詞彙表
簡介目錄
Product Code: 92581
The Global Phosphatic Fertilizer Market size is estimated at USD 54.03 billion in 2024, and is expected to reach USD 81.73 billion by 2030, growing at a CAGR of 7.14% during the forecast period (2024-2030).
Key Highlights
- Fastest growing segment by Type - SSP : SSP fertilizer has a higher agronomic advantage due to the presence of both Ca and S in addition to phosphorous. The P in it reacts similarly to the water-soluble fertilizer.
- Largest Segment by Crop Type - Field Crops : Field crops are widely cultivated worldwide and are a staple food in many parts of the world. They account for a maximum share by area in most agricultural countries.
- Largest Segment by Application Mode - Soil : Soil application is a convenient way of applying fertilizers without any equipment. This method of application helps in improving both plant health and soil fertility.
- Largest segment by Country - France : France is the world's largest consumer of phosphatic fertilizers, by value, due to the higher price of fertilizers. However, its fertilizer consumption by volume is low.
Phosphatic Fertilizers Market Trends
DAP is the largest segment by Product.
- Diammonium phosphate (DAP) is the most predominantly used phosphatic fertilizer globally, and it accounted for a share of 45.0% of the total phosphatic fertilizer consumption, with a volume of 28.5 million metric ton in 2022, with the market valued at USD 17.76 billion in the same year due to the high phosphate content of 46.0% in addition to 18.0% of ammonium, which acts as a source of nitrogen.
- Monoammonium phosphate (MAP) is the second-most preferred phosphatic fertilizer in the world after DAP. In 2022, the global MAP market was valued at USD 9.42 billion, with a volume consumption of 12.6 million metric ton. MAP accounts for a share of 23.9% of the total phosphatic fertilizers consumed globally in 2022.
- Triple superphosphate is pure phosphate-based fertilizer with a phosphate percentage of 46.0%, which is the highest among other pure phosphate fertilizers. Triple superphosphate accounted for 18.8% of the total consumption of phosphate fertilizers in the world. In 2022, the global TSP fertilizers market was valued at USD 7.6 billion, with a volume consumption of 2.9 million metric tons.
- Single superphosphate accounted for 7.3% of the total phosphatic fertilizers consumed globally in 2022. The market value for SSP fertilizer was valued at USD 2.93 billion in 2022, with a volume consumption of 7.6 million metric ton.
- Asia-Pacific is the largest market for phosphatic fertilizers, and it accounted for 49% of the global phosphatic fertilizer market. This is followed by Europe and South America, with a share of 35% and 16%, respectively.
- Hence, the market for phosphatic fertilizers is projected to grow due to the increasing global demand for phosphatic fertilizers with a rising number of farmers aiming to increase crop yield.
Asia-Pacific is the largest segment by Region.
- The Asia-Pacific region dominates the global phosphatic fertilizer market and accounted for about 31.36% of the total market value, valued at about USD 13.3 billion in 2021. In 2021, DAP occupied a market share of 74.47% in the Asia-Pacific phosphatic fertilizers market. The greater demand for DAP in the region is due to its greater efficiency than other phosphatic fertilizers like TSP and SSP.
- China was the world's leading producer of phosphorus fertilizers, accounting for nearly 41.4% of the global phosphatic fertilizer market in 2016. China's exports represented 25.3% of the world's exports in the year 2016. The top importers from China are Indonesia, Australia, and Iran.
- Europe occupies the second-largest market, which accounted for about 28.53% of the market value in 2021. TSP accounted for a maximum market share of 53.7% in 2021, and the field crops segment held the largest share of Europe's triple superphosphate market in 2021. The field crops segment was valued at USD 4.85 billion in 2021 and is expected to reach USD 5.67 billion by the end of the forecast period (2022-2028.
- South America is the third-largest phosphatic fertilizer market. It accounted for 13.2% of the market in 2021 and is estimated to register a CAGR of 7.0% during the forecast period. The prevailing phosphorous deficiency in the regional soil is observed to drive the demand of the segment during the study period.
- There is an increasing trend observed in the global phosphatic fertilizer market, both in terms of value and volume, except for a decrease in 2020, which was mainly due to the disruptions caused by the COVID-19 pandemic. However, the value of the global phosphatic fertilizer market is anticipated to increase during the forecast period, owing to a decline in cultivation areas globally.
Phosphatic Fertilizers Industry Overview
The Global Phosphatic Fertilizer Market is fragmented, with the top five companies occupying 30.22%. The major players in this market are Eurochem, IFFCO, K+S AKTIENGESELLSCHAFT, Koch Industries and Nutrien Limited (sorted alphabetically).
Additional Benefits:
- The market estimate (ME) sheet in Excel format
- 3 months of analyst support
TABLE OF CONTENTS
1 EXECUTIVE SUMMARY & KEY FINDINGS
2 REPORT OFFERS
3 INTRODUCTION
- 3.1 Study Assumptions & Market Definition
- 3.2 Scope of the Study
- 3.3 Research Methodology
4 KEY INDUSTRY TRENDS
- 4.1 Acreage Of Major Crop Types
- 4.2 Average Nutrient Application Rates
- 4.3 Regulatory Framework
- 4.4 Value Chain & Distribution Channel Analysis
5 MARKET SEGMENTATION
- 5.1 Type
- 5.1.1 Straight
- 5.1.1.1 Phosphatic
- 5.1.1.1.1 DAP
- 5.1.1.1.2 MAP
- 5.1.1.1.3 SSP
- 5.1.1.1.4 TSP
- 5.1.1.1.5 Others
- 5.1.1 Straight
- 5.2 Application Mode
- 5.2.1 Fertigation
- 5.2.2 Foliar
- 5.2.3 Soil
- 5.3 Crop Type
- 5.3.1 Field Crops
- 5.3.2 Horticultural Crops
- 5.3.3 Turf & Ornamental
- 5.4 Region
- 5.4.1 Asia-Pacific
- 5.4.1.1 Australia
- 5.4.1.2 Bangladesh
- 5.4.1.3 China
- 5.4.1.4 India
- 5.4.1.5 Indonesia
- 5.4.1.6 Japan
- 5.4.1.7 Pakistan
- 5.4.1.8 Philippines
- 5.4.1.9 Thailand
- 5.4.1.10 Vietnam
- 5.4.1.11 Rest Of Asia-Pacific
- 5.4.2 Europe
- 5.4.2.1 France
- 5.4.2.2 Germany
- 5.4.2.3 Italy
- 5.4.2.4 Netherlands
- 5.4.2.5 Russia
- 5.4.2.6 Spain
- 5.4.2.7 Ukraine
- 5.4.2.8 United Kingdom
- 5.4.2.9 Rest Of Europe
- 5.4.3 Middle East & Africa
- 5.4.3.1 Nigeria
- 5.4.3.2 Saudi Arabia
- 5.4.3.3 South Africa
- 5.4.3.4 Turkey
- 5.4.3.5 Rest Of Middle East & Africa
- 5.4.4 North America
- 5.4.4.1 Canada
- 5.4.4.2 Mexico
- 5.4.4.3 United States
- 5.4.4.4 Rest Of North America
- 5.4.5 South America
- 5.4.5.1 Argentina
- 5.4.5.2 Brazil
- 5.4.5.3 Rest Of South America
- 5.4.1 Asia-Pacific
6 COMPETITIVE LANDSCAPE
- 6.1 Key Strategic Moves
- 6.2 Market Share Analysis
- 6.3 Company Landscape
- 6.4 Company Profiles
- 6.4.1 Coromandel International Ltd.
- 6.4.2 Eurochem
- 6.4.3 IFFCO
- 6.4.4 K+S AKTIENGESELLSCHAFT
- 6.4.5 Koch Industries
- 6.4.6 Nutrien Limited
- 6.4.7 PhosAgro
- 6.4.8 SABIC
7 KEY STRATEGIC QUESTIONS FOR FERTILIZER CEOS
8 APPENDIX
- 8.1 Global Overview
- 8.1.1 Overview
- 8.1.2 Porter's Five Forces Framework
- 8.1.3 Global Value Chain Analysis
- 8.1.4 Market Dynamics (DROs)
- 8.2 Sources & References
- 8.3 List of Tables & Figures
- 8.4 Primary Insights
- 8.5 Data Pack
- 8.6 Glossary of Terms
02-2729-4219
+886-2-2729-4219
 全球磷肥市場:市場規模、佔有率、成長分析 - 按產品、按應用、產業預測(2024-2031)
 2024年磷肥全球市場報告
 磷肥市場:依產品、應用分類 - 2024-2030 年全球預測
 全球磷肥市場:依產品類型、應用、地區:產業分析、規模、份額、成長、趨勢、預測(2023-2030)
 全球磷肥市場 - 2023-2030
 到 2032 年的全球磷肥市場、機遇和戰略
 磷肥市場:按類型、按應用劃分:2021-2031 年全球機遇分析和行業預測
 全球磷肥市場:到 2028 年的預測 - 按產品(磷酸二銨、三磷酸鈣和其他產品)、作物類型、形態、分銷渠道、應用和地區分析
 磷酸肥料的全球市場:市場規模,趨勢,成長分析
 磷酸肥料的全球市場:現狀分析與預測(2021年~2027年)
▼