


 |
市場調查報告書
商品編碼
1440109
羊毛:市場佔有率分析、產業趨勢與統計、成長預測(2024-2029)Wool - Market Share Analysis, Industry Trends & Statistics, Growth Forecasts (2024 - 2029) |
||||||
※ 本網頁內容可能與最新版本有所差異。詳細情況請與我們聯繫。
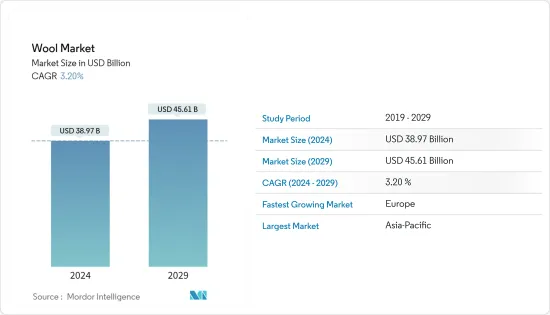
預計2024年羊毛市場規模為389.7億美元,預計到2029年將達到456.1億美元,在預測期內(2024-2029年)年複合成長率為3.20%。
隨著羊毛製造業的技術進步,紡紗和織布工具正在迅速發展,增加了世界各地的服飾銷售。例如,2022年11月,Savio宣佈在印度市場推出新型自動繞線機Proxima Smartconer。此類創新可望提高生產力。從長遠來看,成長機會主要在於千禧世代消費者,他們強調品質、可靠性和透明度的購買行為正在推動羊毛市場的發展。
IWTO(負責監管羊毛品質和可追溯性的機構)實施的各種措施提高了羊毛價格並鼓勵生產。人口成長和都市化加快是推動羊毛市場成長的因素。隨著人口的增加,對羊毛服裝類的需求也隨之增加。根據國際毛紡織組織(IWTO)的數據,羊毛重量的50.0%是純有機碳。推動羊毛需求的一個因素是中國、美國和歐洲等國家對優質羊毛纖維的國內消費不斷增加。
此外,羊毛的高生物分解性也支撐了市場。羊毛可生物分解性並具有絕緣性能,適合消費者使用。所有這些因素預計將增加對羊毛的需求並在預測期內推動市場。
羊毛市場趨勢
組織努力確保品質驅動生產
根據 WITO 和現有的最新數據,全球約 12 億隻羊生產了約 19.49 億公斤原毛(2021 年),羊群數量較 2020 年增加了 37 億隻。羊毛供應鏈很長,從農場到時尚有很多步驟。為了確保透明度和品質、促進羊毛資訊流通並保證買家的質量,IWTO 等組織開發了許多可追溯系統。其中一個制度是國家羊毛聲明誠信計劃。 《國家羊毛宣言》是一項全球公認的產業計劃,因其農場的透明度和可追溯性。 NWD完整性計劃 (NWD-IP) 是一項廣泛的案頭審核和農場檢查計劃,其唯一目的是建造羊毛管道並增強消費者對澳洲羊毛的信心。監管機構的所有這些努力也增加了綿羊的飼養以獲取羊毛,使得羊毛價格飆升。
由於需求,世界各地綿羊數量的增加也支持了成長。中國的養羊業處於世界領先地位。據聯合國糧農組織稱,中國羊存欄量從2019年的16,349萬隻增加到2020年的1,7,301萬隻。因此,羊數量的增加和確保品質的機構努力預計將在預測期內提高羊毛產量。
亞太地區主導市場
羊毛是一種全球貿易商品,市場上的羊毛種類繁多且不斷發展。大多數羊毛附有 IWTO 測試證書,確保買家對品質充滿信心。亞太地區因其高產量和出口量而在羊毛市場佔據主導地位。根據糧農組織統計資料庫,澳洲、中國和紐西蘭是羊毛的主要生產國。根據ITC Trade統計,2020年,澳洲出口額為15.9532億美元,其次是中國,出口額為15.43868萬美元,占出口總額的36.2%。
印度向義大利、韓國、美國、斯里蘭卡、德國、澳洲、阿拉伯聯合大公國、瑞典、荷蘭、阿曼、阿富汗等國家供應毛織品、手工地毯、服飾和坦尚尼亞。美國是印度羊毛產品的主要進口國,2020-21年出口額達8.556億美元。毛紡織物主要出口義大利、韓國、英國、美國、斯里蘭卡、德國、澳洲等。 2020-21年,這些國家從印度進口了價值51.39億印度盧比(6,450萬美元)的紗線紡織品,佔紗線出口總額的64%。同期主要進口國為義大利,佔17.5%。
根據聯合國商品貿易統計資料庫(UN Comtrade)的數據,2021年澳洲向中國出口的羊毛貿易額達到約19億美元。這是當年澳洲羊毛出口的最高貿易額。澳洲是全球領先的羊毛供應國之一,也是全球最大的羊毛出口國,佔全球羊毛出口的39%。由於優質美利奴羊毛在澳洲的生產占主導地位,澳洲羊毛通常作為奢華時裝和輕質針織品進行零售。亞太地區服裝業越來越注重環保、永續和生物分解性,增加了對舒適羊毛的需求。因此,該地區的市場顯然是由千禧世代和 Z 世代推動的。
其他福利
- Excel 格式的市場預測 (ME) 表
- 3 個月分析師支持
目錄
第1章 簡介
- 研究假設和市場定義
- 調查範圍
第2章調查方法
第3章執行摘要
第4章市場動態
- 市場概況
- 市場促進因素
- 市場限制因素
- 價值鏈分析
第5章市場區隔
- 地區(產量分析、消費金額及數量分析、進口金額及數量分析、出口金額及數量分析、價格趨勢分析)
- 美國
- 墨西哥
- 德國
- 比利時
- 英國
- 荷蘭
- 土耳其
- 中國
- 澳洲
- 紐西蘭
- 摩洛哥
第6章市場機會與未來趨勢
The Wool Market size is estimated at USD 38.97 billion in 2024, and is expected to reach USD 45.61 billion by 2029, growing at a CAGR of 3.20% during the forecast period (2024-2029).
With the technological advancements in the wool manufacturing industry, there is a rapid development of spinning and weaving tools leading to increased sales of clothing across the globe. For instance, in November 2022, Savio announced the launch of an automatic new winding machine Proxima Smartconer in the Indian market. Such innovations are expected to increase productivity. Over the long term, growth opportunities mainly lie with millennial consumers whose purchasing behavior, such as the preference for quality, authenticity, and transparency, is driving the market for wool.
Various measures undertaken by the IWTO, a regulating authority for wool quality and traceability, are fetching higher prices for wool, thus encouraging production. Growing population and rising urbanization are the factors boosting the growth of the wool market. As the population increases, the demand for wool clothing rises. According to International Wool Textile Organization (IWTO), 50.0% weight of the wool is pure organic carbon. The factor driving wool demand is the increasing domestic consumption of luxury wool textiles in countries such as China, the United States, and Europe.
Moreover, the biodegradable quality of wool is also supporting the market. Wool is a natural decomposer since it is biodegradable and provides less harm to the environment. In addition, wool consists of thermal insulation properties making it suitable for consumers. All these factors are expected to increase the demand for wool, thus driving the market during the forecast period.
Wool Market Trends
Institutional Initiatives Ensuring the Quality is Driving the Production
According to WITO and the most recent available figures, around 1,949 million kg (2021) of raw wool was produced by around 1.2 billion sheep around the world, and the sheep population rose by 3.7 billion from 2020. The wool supply chain is long, with many steps en route from farm to fashion. To ensure transparency and quality and to facilitate the flow of information about wool to assure buyers of the qualities being purchased, institutions like IWTO have developed many traceability systems. One such system is the National Wool Declaration Integrity Program. The National Wool Declaration is an industry initiative recognized globally for its transparency and traceability from the farm. The NWD Integrity Program (NWD-IP) is an extensive program of Desktop Audits and On-Farm Inspections with the single purpose of building a wool pipeline and consumer confidence in Australian wool. With all these initiatives put forth by the regulating authority, wool is fetching a higher price because sheep rearing for wool is also increasing.
The increase in the sheep population across the globe owing to the demand is also supporting the growth. China is the leader in terms of sheep rearing globally. According to FAO, the sheep population in China increased from 163.49 million in 2019 to 173.01 million in 2020. Thus, the increasing sheep population and the institutional initiatives for ensuring quality are expected to drive wool production during the forecast period.
Asia-Pacific Dominates the Market
Wool is a commodity traded globally, and its diversity in the market is vast and ever-evolving. With most of the wool sold with an IWTO Test Certificate, the buyer's confidence in quality is guaranteed. The Asia-Pacific region is dominating the wool market with high production and exports. According to FAOSTAT, Australia, China, and New Zealand are the major producers of wool. According to ITC Trade, in 2020, Australia accounted for the highest exports worth USD 1,595,320 thousand, followed by China, accounting for exports worth USD 1,543,868 thousand in 2020, contributing 36.2% of the total export.
India exports woolen yarn fabrics, hand-made carpets, and ready-made garments to Italy, Korea, the United Kingdom, the United States, Sri Lanka, Germany, Australia, the United Arab Emirates, Sweden, the Netherlands, Oman, Afghanistan, and Tanzania, among others. The United States is a major importer of woolen products from India, with exports valued at USD 855.6 million in 2020-21. Woolen fabrics are mainly exported to Italy, Korea, the United Kingdom, the United States, Sri Lanka, Germany, and Australia. During 2020-21, these countries imported INR 513.9 crore (USD 64.5 million) worth of yarn fabrics from India, representing a share of 64% of the total yarn exports. Italy was the major importer during the same period at 17.5%.
According to UN Comtrade, in 2021, the trade value of wool exported from Australia to China amounted to about USD 1.9 billion. This was the highest trade value of wool exported from Australia that year. Australia is the leading global supplier of wool and the world's largest wool export nation, accounting for 39% of global wool exports. Given the dominance of fine Merino production in Australia, Australian wool is typically retailed as high-end fashion and lightweight knitwear. With the trend toward eco-friendly, sustainable, and biodegradable parameters in the Asia-Pacific apparel industry, the demand for wool is growing as it provides comfort. Thus, the market is driven explicitly by the millennial and Gen Z population in the region.
Additional Benefits:
- The market estimate (ME) sheet in Excel format
- 3 months of analyst support
TABLE OF CONTENTS
1 INTRODUCTION
- 1.1 Study Assumptions and Market Definition
- 1.2 Scope of the Study
2 RESEARCH METHODOLOGY
3 EXECUTIVE SUMMARY
4 MARKET DYNAMICS
- 4.1 Market Overview
- 4.2 Market Drivers
- 4.3 Market Restraints
- 4.4 Value Chain Analysis
5 MARKET SEGMENTATION
- 5.1 Geography (Production Analysis, Consumption Analysis by Value and Volume, Import Analysis by Value and Volume, Export Analysis by Value and Volume, and Price Trend Analysis)
- 5.1.1 United States
- 5.1.2 Mexico
- 5.1.3 Germany
- 5.1.4 Belgium
- 5.1.5 United Kingdom
- 5.1.6 Netherlands
- 5.1.7 Turkey
- 5.1.8 China
- 5.1.9 Australia
- 5.1.10 New Zealand
- 5.1.11 Morocco


