


 |
市場調查報告書
商品編碼
1850253
霧運算網路:市場佔有率分析、產業趨勢、統計數據和成長預測(2025-2030 年)Fog Networking - Market Share Analysis, Industry Trends & Statistics, Growth Forecasts (2025 - 2030) |
||||||
※ 本網頁內容可能與最新版本有所差異。詳細情況請與我們聯繫。
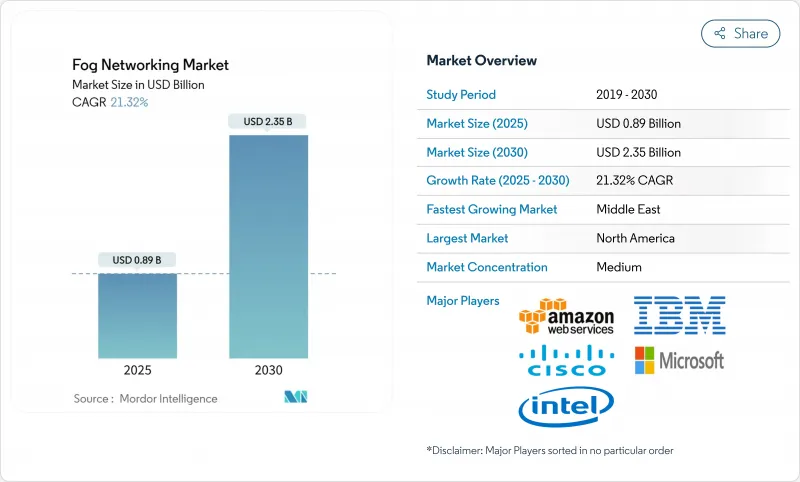
預計到 2025 年,霧運算網路市場規模將達到 8.9 億美元,到 2030 年將達到 23.5 億美元,年複合成長率為 21.32%。
儘管硬體閘道器和邊緣伺服器目前仍主導著大多數部署,但隨著企業尋求更靠近設備的即時資料處理,軟體定義編配和安全層正日益受到重視。 5G 和 Wi-Fi 7 的快速部署、物聯網感測器價格的下降以及日益嚴格的資料主權要求,都增強了在地化運算的商業價值。供應商不斷將人工智慧加速器整合到微型資料中心中,從而為自動駕駛汽車、精密製造和關鍵健康監測等領域提供低延遲分析。雖然安全性的複雜性和分散的編配堆疊阻礙了霧運算的短期普及,但對邊緣連接的持續投資和國家數位轉型計畫將支撐霧運算市場的長期發展。
全球霧運算網路市場趨勢與洞察
即時分析的需求日益成長
製造企業正在部署霧運算閘道來運行預測性維護模型,這些模型需要在 10 毫秒內做出回應。透過在生產邊緣整合機器學習,梅賽德斯-奔馳工廠在預測車輛測試時間方面實現了 82.88% 的準確率。一家醫院將遠距醫療工作負載從雲端遷移到本地霧運算節點後,延遲從 100 毫秒降低到 5 毫秒,攻擊面減少了 35%。類似的延遲改進也支援遠端醫療倉庫機器人、交通號誌最佳化和高階駕駛輔助系統 (ADAS)。獎勵不僅限於速度:能源效率研究表明,與集中式處理相比,霧運算可降低 25-30% 的能耗,證明了資本支出的合理性。
低成本物聯網感測器的普及
如今,成本低於 5 美元的工業感測器能夠實現對工廠和城市基礎設施的持續資產監控。工業網際網路聯盟強調,整合經濟高效的感測器是邊緣運算的關鍵催化劑。美國國家標準與技術研究院 (NIST) 的物聯網諮詢委員會也同樣認為,分散式架構對於保障國家關鍵基礎設施的韌性至關重要。低成本感測器正在為智慧電網、建築能源管理和漏水檢測等領域的即時最佳化循環提供數據,從而推動了對嵌入霧運算節點的本地分析功能的需求。
安全攻擊面的複雜性
每個分散式節點都會引入新的漏洞,醫療保健和製造業必須根據 HIPAA 和 GDPR 法規採取措施加以保護。歐洲防務局的 CLAUDIA計劃正在開發戰術性安全框架,但事件反應仍然分散。在操作技術環境中,安全漏洞會威脅到實體安全,因此需要投資零信任架構和跨霧運算叢集的執行時間完整性監控。
細分市場分析
到2024年,本地部署節點將佔霧運算網路市場佔有率的46%,這反映了醫療保健、金融和國防等產業對資料本地化的嚴格要求。重視確定性延遲和監管控制的行業會將計算資產部署在安全設施內或生產線上。西門子和微軟的混合架構將本地工業邊緣運行時與基於Azure的分析相結合,從而滿足了對靈活監控的需求。
隨著託管服務提供者將生命週期支援、威脅監控和容量調整等服務打包,託管霧運算即服務(Hosted fog-as-a-service)將以26%的複合年成長率快速成長。沒有內部IT部門的小型製造商和零售商將從中受益匪淺,他們無需購買和經營專用硬體即可獲得先進的人工智慧技術。隨著通訊業者和超大規模雲端服務商將其服務範圍擴展到現場運算領域,託管霧運算網路市場預計將在2025年至2030年間成長兩倍。
霧運算網路市場按元件(硬體、軟體、服務)、部署模式(本地部署、託管/管理、混合部署)、最終用戶應用(智慧電錶、其他)和地區進行細分。市場預測以美元計價。
區域分析
北美地區引領潮流,佔2024年營收的37%,這主要得益於企業數位化預算、成熟的5G網路覆蓋範圍以及清晰的監管環境。美國Start-Ups生態系統擁有203家邊緣運算公司,迄今已籌集111億美元資金。加拿大規模雖小但充滿活力的邊緣運算叢集,儘管在2024年有所回落,但仍獲得了2.14億美元的資金籌措。
接下來是歐洲,其發展將受到《一般資料保護規範》(GDPR)和《數位市場法案》的影響,這兩項法案都強調資料主權。議會就通訊基礎設施依賴性展開的辯論將推動對本土霧計算平台 Europarl 的投資。歐盟資助的初步試驗表明,尖端計算節點將使 2021 年至 2027 年間的裝置量成長率加倍。
中東地區將實現27%的複合年成長率,沙烏地阿拉伯和阿拉伯聯合大公國的智慧城市大型企劃將部署數千個道路感測器和監視錄影機,需要亞秒級的數據分析。各國的國家人工智慧戰略優先考慮自主資料處理,推動了該地區資料中心和霧運算閘道器的部署。在亞太地區,中國的工業物聯網政策、日本在機器人領域的領先地位以及印度5G的快速發展正在推動巨大的需求。安裝人事費用的下降將進一步提高投資報酬率,加速二線製造地的採用。
其他福利:
- Excel格式的市場預測(ME)表
- 3個月的分析師支持
目錄
第1章 引言
- 研究假設和市場定義
- 調查範圍
第2章調查方法
第3章執行摘要
第4章 市場情勢
- 市場概覽
- 市場促進因素
- 即時分析的需求日益成長
- 低成本物聯網感測器的普及
- 5G 和 Wi-Fi 7 密集化
- 採用 OpenFog/ETSI MEC 標準
- 邊緣人工智慧加速器出貨量激增
- 國家資料主權義務
- 市場限制
- 安全攻擊面的複雜性
- 碎片化的編配堆疊
- 棕地OT場地的資本支出負擔
- 迷霧人才庫限制
- 價值/供應鏈分析
- 監管環境
- 技術展望
- 波特五力分析
- 新進入者的威脅
- 買方的議價能力
- 供應商的議價能力
- 替代品的威脅
- 競爭的激烈程度
- 技術藍圖
第5章 市場規模與成長預測
- 按組件
- 硬體
- 霧之門
- 邊緣伺服器和微型資料中心
- 物聯網晶片組和加速器
- 軟體和服務
- 霧管理平台
- 安全與編配
- 硬體
- 按部署模式
- 本地部署
- 託管/管理
- 混合
- 透過最終用戶應用程式
- 智慧電錶
- 建築和家庭自動化
- 智慧製造
- 連線健診醫療
- 連網汽車
- 其他(石油和天然氣、零售等)
- 按地區
- 北美洲
- 美國
- 加拿大
- 墨西哥
- 南美洲
- 巴西
- 阿根廷
- 其他南美洲
- 歐洲
- 英國
- 德國
- 法國
- 義大利
- 其他歐洲地區
- 亞太地區
- 中國
- 日本
- 印度
- 韓國
- 亞太其他地區
- 中東
- 以色列
- 沙烏地阿拉伯
- 阿拉伯聯合大公國
- 土耳其
- 其他中東地區
- 非洲
- 南非
- 埃及
- 其他非洲地區
- 北美洲
第6章 競爭情勢
- 市場集中度
- 策略趨勢
- 市佔率分析
- 公司簡介
- Amazon Web Services
- Cisco Systems
- Dell Technologies
- IBM
- Intel
- Microsoft
- Nebbiolo Technologies
- Nokia
- Qualcomm
- Tata Consultancy Services
- Advantech
- HPE
- Huawei
- Arm
- Schneider Electric
- Bosch .IO
- GE Digital
- Saguna Networks
- ClearBlade
- FogHorn(Google)
- EdgeIQ
- Vapor IO
- Fastly
- Equinix Metal
第7章 市場機會與未來展望
The fog networking market size is estimated at USD 0.89 billion in 2025 and is forecast to reach USD 2.35 billion by 2030, advancing at a 21.32% CAGR.
Hardware gateways and edge servers currently anchor most deployments, while software-defined orchestration and security layers gain traction as enterprises seek real-time data processing close to devices. Rapid 5G and Wi-Fi 7 rollouts, falling IoT sensor prices, and stricter data-sovereignty mandates reinforce the business case for localized computing. Vendors continue integrating artificial-intelligence accelerators into micro-data-center form factors, enabling low-latency analytics for autonomous vehicles, precision manufacturing, and critical health monitoring. Although security complexity and fragmented orchestration stacks temper near-term uptake, sustained investment in edge connectivity and national digital-transformation programs underpins long-term expansion of the fog networking market
Global Fog Networking Market Trends and Insights
Expanding Real-Time Analytics Demand
Manufacturing organizations deploy fog gateways to run predictive-maintenance models that must respond in less than 10 milliseconds. A Mercedes-Benz plant recorded 82.88% accuracy in forecasting vehicle-test times by applying embedded machine learning at the production edge. Hospitals that shift telemedicine workloads from cloud to on-site fog nodes have cut latency from 100 milliseconds to 5 milliseconds and reduced the attack surface by 35%. Similar latency gains underpin automated warehouse robotics, traffic-signal optimization, and advanced driver-assistance systems. The economic incentive extends beyond speed: energy-efficiency studies show 25-30% lower power use versus centralized processing, reinforcing capital-spending justification.
Proliferation of Low-Cost IoT Sensors
Industrial-grade sensors priced below USD 5 now enable continuous asset monitoring across shop floors and city infrastructure. The Industrial Internet Consortium stresses cost-effective sensor integration as a primary edge-computing catalyst. NIST's IoT Advisory Board likewise classifies distributed architectures as essential for national critical-infrastructure resilience NIST. Cheap sensors feed real-time optimization loops for smart grids, building-energy management, and leakage detection, elevating demand for local analytics capacity embedded in fog nodes.
Security Attack-Surface Complexity
Every distributed node introduces new vulnerabilities that healthcare and manufacturing operators must secure in line with HIPAA and GDPR provisions. The European Defence Agency's CLAUDIA project addresses tactical-edge security frameworks, yet incident-response remains fragmented. In operational-technology environments, breaches risk physical safety, compelling investment in zero-trust architectures and runtime-integrity monitoring across fog clusters.
Other drivers and restraints analyzed in the detailed report include:
- 5G & Wi-Fi 7 Densification
- Edge AI Accelerator Shipments Surge
- Fragmented Orchestration Stacks
For complete list of drivers and restraints, kindly check the Table Of Contents.
Segment Analysis
On-premisess nodes accounted for 46% of the 2024 fog networking market share, mirroring strict data-localization mandates in healthcare, finance, and defense. Industries valuing deterministic latency and regulatory control keep compute assets within secured facilities or even inside production lines. Siemens and Microsoft's hybrid architecture combineson-premiseses Industrial Edge runtimes with Azure-based analytics, underscoring demand for flexible oversight.
Hosted fog-as-a-service grows fastest at 26% CAGR as managed-service providers bundle lifecycle support, threat-monitoring, and capacity right-sizing. Smaller manufacturers and retailers lacking in-house IT benefit most, accessing advanced AI without purchasing or operating specialized hardware. The fog networking market size for hosted services is projected to triple between 2025 and 2030 as telcos and hyperscale clouds extend service catalogues to field-level computing.
Fog Networking Market is Segmented by Component (Hardware, Software, Service), Deployment Model (On-Premise, Hosted/Managed, and Hybrid), End-User Application (Smart Metering, Smart Metering and More), and Geography. The Market Forecasts are Provided in Terms of Value (USD).
Geography Analysis
North America led with 37% of 2024 revenue, propelled by enterprise digitization budgets, mature 5G coverage, and supportive regulatory clarity. United States start-up ecosystems host 203 edge-computing firms that raised USD 11.1 billion to date Tracxn. Canada's smaller yet vibrant cluster recorded USD 214 million in funding despite a 2024 pullback.
Europe follows, shaped by GDPR and the Digital Markets Act that stress data sovereignty. Parliament debates on communications-infrastructure dependence reinforce investment in indigenous fog stacks Europarl. The continent's industrial pedigree underpins adoption in automotive and heavy machinery; EU-funded pilots show far-edge compute nodes doubling installed-base growth from 2021 to 2027.
The Middle East posts a 27% CAGR as smart-city megaprojects in Saudi Arabia and the UAE deploy thousands of roadside sensors and surveillance cameras requiring sub-second analytics. National AI strategies privilege sovereign data processing, catalysing regional data-center and fog-gateway rollouts Across APAC, China's industrial-IoT policy, Japan's robotics leadership, and India's 5G expansion foster sizeable demand. Lower installation labour costs further improve return on investment, accelerating adoption across tier-2 manufacturing hubs.
- Amazon Web Services
- Cisco Systems
- Dell Technologies
- IBM
- Intel
- Microsoft
- Nebbiolo Technologies
- Nokia
- Qualcomm
- Tata Consultancy Services
- Advantech
- HPE
- Huawei
- Arm
- Schneider Electric
- Bosch .IO
- GE Digital
- Saguna Networks
- ClearBlade
- FogHorn (Google)
- EdgeIQ
- Vapor IO
- Fastly
- Equinix Metal
Additional Benefits:
- The market estimate (ME) sheet in Excel format
- 3 months of analyst support
TABLE OF CONTENTS
1 INTRODUCTION
- 1.1 Study Assumptions and Market Definition
- 1.2 Scope of the Study
2 RESEARCH METHODOLOGY
3 EXECUTIVE SUMMARY
4 MARKET LANDSCAPE
- 4.1 Market Overview
- 4.2 Market Drivers
- 4.2.1 Expanding real-time analytics demand
- 4.2.2 Proliferation of low-cost IoT sensors
- 4.2.3 5G and Wi-Fi 7 densification
- 4.2.4 OpenFog/ETSI MEC standard adoption
- 4.2.5 Edge AI accelerator shipments surge
- 4.2.6 National data-sovereignty mandates
- 4.3 Market Restraints
- 4.3.1 Security attack-surface complexity
- 4.3.2 Fragmented orchestration stacks
- 4.3.3 CAPEX burden on brownfield OT sites
- 4.3.4 Limited fog talent pool
- 4.4 Value / Supply-Chain Analysis
- 4.5 Regulatory Landscape
- 4.6 Technological Outlook
- 4.7 Porter's Five Forces Analysis
- 4.7.1 Threat of New Entrants
- 4.7.2 Bargaining Power of Buyers
- 4.7.3 Bargaining Power of Suppliers
- 4.7.4 Threat of Substitutes
- 4.7.5 Intensity of Rivalry
- 4.8 Technology Roadmap
5 MARKET SIZE AND GROWTH FORECASTS (VALUE)
- 5.1 By Component (Value, USD)
- 5.1.1 Hardware
- 5.1.1.1 Fog gateways
- 5.1.1.2 Edge servers and micro-DCs
- 5.1.1.3 IoT chipsets and accelerators
- 5.1.2 Software and Services
- 5.1.2.1 Fog management platform
- 5.1.2.2 Security and orchestration
- 5.1.1 Hardware
- 5.2 By Deployment Model (Value, USD)
- 5.2.1 On-premise
- 5.2.2 Hosted/Managed
- 5.2.3 Hybrid
- 5.3 By End-user Application (Value, USD)
- 5.3.1 Smart Metering
- 5.3.2 Building and Home Automation
- 5.3.3 Smart Manufacturing
- 5.3.4 Connected Healthcare
- 5.3.5 Connected Vehicle
- 5.3.6 Others (Oil and Gas, Retail, etc.)
- 5.4 By Geography (Value, USD)
- 5.4.1 North America
- 5.4.1.1 United States
- 5.4.1.2 Canada
- 5.4.1.3 Mexico
- 5.4.2 South America
- 5.4.2.1 Brazil
- 5.4.2.2 Argentina
- 5.4.2.3 Rest of South America
- 5.4.3 Europe
- 5.4.3.1 United Kingdom
- 5.4.3.2 Germany
- 5.4.3.3 France
- 5.4.3.4 Italy
- 5.4.3.5 Rest of Europe
- 5.4.4 Asia-Pacific
- 5.4.4.1 China
- 5.4.4.2 Japan
- 5.4.4.3 India
- 5.4.4.4 South Korea
- 5.4.4.5 Rest of Asia-Pacific
- 5.4.5 Middle East
- 5.4.5.1 Israel
- 5.4.5.2 Saudi Arabia
- 5.4.5.3 United Arab Emirates
- 5.4.5.4 Turkey
- 5.4.5.5 Rest of Middle East
- 5.4.6 Africa
- 5.4.6.1 South Africa
- 5.4.6.2 Egypt
- 5.4.6.3 Rest of Africa
- 5.4.1 North America
6 COMPETITIVE LANDSCAPE
- 6.1 Market Concentration
- 6.2 Strategic Moves
- 6.3 Market Share Analysis
- 6.4 Company Profiles (includes Global level Overview, Market level overview, Core Segments, Financials as available, Strategic Information, Market Rank/Share, Products and Services, Recent Developments)
- 6.4.1 Amazon Web Services
- 6.4.2 Cisco Systems
- 6.4.3 Dell Technologies
- 6.4.4 IBM
- 6.4.5 Intel
- 6.4.6 Microsoft
- 6.4.7 Nebbiolo Technologies
- 6.4.8 Nokia
- 6.4.9 Qualcomm
- 6.4.10 Tata Consultancy Services
- 6.4.11 Advantech
- 6.4.12 HPE
- 6.4.13 Huawei
- 6.4.14 Arm
- 6.4.15 Schneider Electric
- 6.4.16 Bosch .IO
- 6.4.17 GE Digital
- 6.4.18 Saguna Networks
- 6.4.19 ClearBlade
- 6.4.20 FogHorn (Google)
- 6.4.21 EdgeIQ
- 6.4.22 Vapor IO
- 6.4.23 Fastly
- 6.4.24 Equinix Metal
7 MARKET OPPORTUNITIES AND FUTURE OUTLOOK
- 7.1 White-space and Unmet-need Assessment


