


 |
市場調查報告書
商品編碼
2120567
遊戲化:市場佔有率分析、產業趨勢與統計、成長預測(2026-2031)Gamification - Market Share Analysis, Industry Trends & Statistics, Growth Forecasts (2026 - 2031) |
||||||

※ 本網頁內容可能與最新版本有所差異。詳細情況請與我們聯繫。
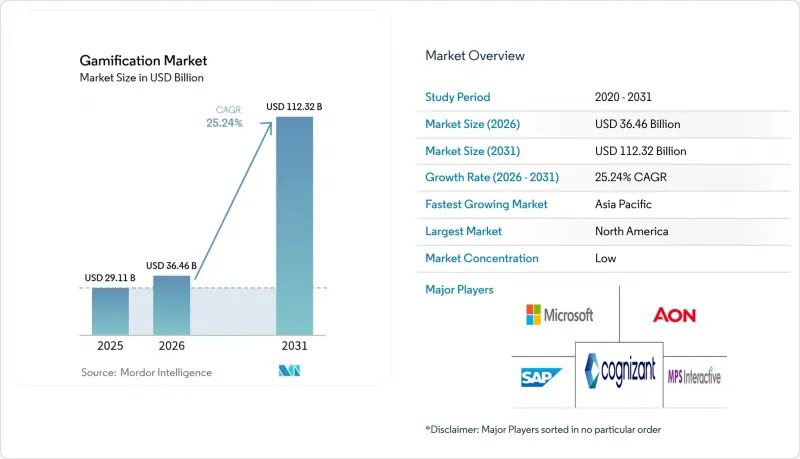
據 Mordor Intelligence 稱,2025 年遊戲化市場價值為 291.1 億美元,預計到 2031 年將達到 1123.2 億美元,而 2026 年為 364.6 億美元,預測期(2026-2031 年)的複合年成長率為 25.24%。
本報告按部署類型(本地部署、雲端部署)、組織規模(大型企業、中小企業)、產業領域(零售、銀行、金融服務和保險、政府、醫療保健及其他)、應用領域(行銷與銷售、人力資源與培訓、產品開發與創新、客戶支援與客戶體驗及其他)以及地區進行細分。市場預測以美元(USD)計價。
全球遊戲化市場趨勢與洞察
「雲端優先」數位化工作場所的採用率迅速提高。
加速雲端遷移的企業需要能夠在混合團隊中原生運作的互動工具。 Microsoft Power Apps 透過將遊戲機制直接整合到工作流程中,將部署時間從數月縮短至數週。雲端託管平台預計將以 27.58% 的複合年成長率成長,因為它們能夠整合資料流並向任何裝置提供即時排行榜。已將遊戲化整合到現有雲端基礎設施的組織報告稱,在遠端辦公環境下的生產力提高了高達 90%。基於訂閱的授權模式所帶來的成本優勢進一步加速了雲端原生技術的普及。隨著 IT 部門精簡本地資產,雲端原生供應商已獲得結構性優勢,這種優勢在預測期間內不太可能逆轉。
低程式碼遊戲化平台的普及
拖放式開發讓每個人都能輕鬆設計互動體驗。 SAP Build 讓非專業開發者無需說明程式碼即可將挑戰、徽章和獎勵整合到核心業務流程中,與客製化專案相比,開發成本降低了 70%。這種便利性將目標市場從大型企業擴展到先前缺乏必要技術資源的中小型企業 (SME)。平台供應商報告稱,專為銷售競賽和新用戶入職任務設計的模板數量激增,顯示該技術正在被商業界廣泛採用。此外,低程式碼堆疊可直接連接到 SaaS 生態系統,縮短「價值驗證 (PoV)」週期,而這對中小企業來說是一個重要的採購障礙。客製化開發需求的這種結構性下降與該細分市場中小企業市場 28.67% 的複合年成長率相吻合。
設計不良的項目會導致投資報酬率下降。
膚淺的「積分/徽章」式實施方案會導致員工流失和預算浪費。 Versus Systems 的客戶群在 2023 年從 16 家銳減至 5 家,原因在於其缺乏吸引力的實施方案未能持續激發用戶興趣。這清楚地顯示了人們對膚淺實施方案的抗拒。如今,企業在批准新計畫之前,會要求供應商提供諸如銷售額成長和錯誤率降低等業務成果指標。這種嚴格的審查延長了銷售週期,迫使供應商提供更強大的諮詢支援。此外,早期採用者實施失敗的案例也引發了後進企業的擔憂,導致他們減少短期支出。忽視教學設計和行為科學的供應商將面臨聲譽受損的風險,影響可能會波及整個遊戲化市場。
細分市場分析
預計到2025年,雲端解決方案將佔總收入的67.62%,到2031年,其複合年成長率預計將達到26.91%,在遊戲化市場中的佔有率預計將進一步成長。即時遙測、無縫更新和彈性儲存是雲端解決方案優勢的基礎,而安全認證的日益成熟也推動了雲端解決方案的普及,即使在較保守的行業也是如此。儘管在資料主權至關重要的場景下,本地部署的需求依然存在,但IT預算的縮減和網路保險費用的上漲正促使成本效益的平衡點向託管服務傾斜。
持續交付管道支援的快速迭代周期使雲端供應商無需應用客戶端修補程式即可微調績效演算法和 A/B 測試方案。當透過進階分析即時推薦個人化挑戰時,企業報告生產力提高了 37%。混合部署作為一種過渡方案,允許將互動邏輯部署在雲端,同時將敏感資料保留在本地。在整個預測期內,向公共雲端堆疊的遷移預計將標準化整合模式,從而降低總體擁有成本 (TCO) 並促進供應商整合。
到2025年,大型企業將佔總收入的57.02%,這反映出它們雄厚的預算和複雜的整合需求。相較之下,中小企業(SME)是遊戲化市場成長最快的細分市場,年複合成長率高達27.65%。免費增值定價、模板庫以及「按需收費」的模式正在降低中小企業的進入門檻。
中小企業通常專注於特定挑戰,例如提升銷售團隊士氣或季節性員工入職,這些挑戰往往能在幾週內帶來投資回報。在新加坡等市場,政府的數位津貼透過補貼訂閱費用進一步加速了數位轉型。隨著雲端平台以大眾市場價格提供企業級身分管理,功能差距正在縮小。因此,中型買家越來越需要符合 SOC 2 標準和單一登入功能,這迫使供應商在保持價格彈性的同時,加強其安全藍圖。
區域分析
北美地區受惠於SaaS的早期普及和強大的供應商生態系統,預計到2025年將佔全球收入的38.74%。企業正優先考慮與人力資源資訊系統(HRIS)和客戶關係管理(CRM)套件的整合,這推動了功能的快速部署並擴大了市場佔有率。在面臨聯邦無障礙訴訟風險的情況下,各平台正增加對符合WCAG標準的設計的投入,從而提高了所有供應商的品質標準。
亞太地區以28.6%的複合年成長率領先全球,這主要得益於行動優先的工作方式和政府主導的數位技能發展計畫。新加坡在公共服務領域所推行的遊戲化措施已證明其有效性,並正在推動私部門的採用。泰國的數位錢包計畫正在試點遊戲化的央行數位貨幣(CBDC)獎勵,這表明政策層面對此給予了支持。企業正透過提供針對低延遲5G網路最佳化的輕量級應用程式而獲益,這加速了印度和印尼等人口大國的5G普及。
在歐洲,儘管隱私法規嚴格,但需求依然強勁。 GDPR 的強制要求正在推動差分隱私分析領域的創新,以實現賠償資料的匿名化。擁有內部法律團隊的供應商在為受 MiFID-II 約束的金融機構客製化同意流程方面具有優勢。雖然南美、中東和非洲在絕對數量上落後於歐洲,但它們正受益於智慧型手機普及率的不斷提高,使得雲端託管的行動原生解決方案成為首選。在這些新興地區,語言和文化在地化仍然是影響轉換率的關鍵因素。
其他福利
- Excel格式的市場預測(ME)表
- 3個月的分析師支持
目錄
第1章:引言
- 研究假設和市場定義
- 調查範圍
第2章:調查方法
第3章執行摘要
第4章 市場洞察
- 市場概覽
- 市場促進因素
- 「雲端優先」數位化工作場所的採用率迅速提高。
- 低程式碼遊戲化平台的普及
- 零售業忠誠度計劃競爭日益激烈,推動了積分和徽章的普及。
- 現場員工的智慧型手機微學習
- 受隱私保護的互動分析
- 央行遊戲化數位貨幣試點項目
- 市場限制因素
- 設計不良的項目會導致投資報酬率下降。
- 平台間的資料所有權糾紛
- 行業特定合規性(HIPAA、MiFID-II)中的反賭博條款
- 因遊戲機制未考慮無障礙設計而引發的訴訟
- 價值鏈分析
- 監理情勢
- 技術展望
- 波特五力分析
- 工業生態系分析
- 主要用例和範例
- 宏觀經濟趨勢評估
- 投資分析
第5章 市場規模與成長預測
- 不同的發展
- 現場
- 雲
- 按組織規模
- 大公司
- 中小企業
- 按行業細分
- 零售
- BFSI
- 政府
- 衛生保健
- 教育/研究
- IT/通訊
- 其他
- 透過使用
- 行銷與銷售
- 人力資源與培訓
- 產品開發與創新
- 客戶支援與客戶體驗
- 其他
- 按地區
- 北美洲
- 美國
- 加拿大
- 墨西哥
- 南美洲
- 巴西
- 阿根廷
- 哥倫比亞
- 其他南美國家
- 歐洲
- 德國
- 英國
- 法國
- 義大利
- 西班牙
- 俄羅斯
- 荷蘭
- 其他歐洲國家
- 亞太地區
- 中國
- 日本
- 韓國
- 印度
- 澳洲
- 新加坡
- 其他亞太國家
- 中東和非洲
- 中東
- 沙烏地阿拉伯
- 阿拉伯聯合大公國
- 其他中東國家
- 非洲
- 南非
- 埃及
- 其他非洲地區
- 中東
- 北美洲
第6章 競爭情勢
- 市場集中度
- 策略趨勢
- 市佔率分析
- 公司簡介
- Microsoft Corporation
- SAP SE
- Cognizant Technology Solutions Corp.
- Axonify Inc.
- Aon plc(incl. Aon Assessment)
- Bunchball Inc.
- Salesforce公司(包括Trailhead)
- Cisco Systems Inc.
- LevelEleven LLC
- Badgeville Inc.
- Genesys Cloud Services Inc.
- Callidus Software Inc.(SAP Litmos)
- Ambition Solutions Inc.
- MPS Interactive Systems Ltd.
- IACTIONABLE Inc.
- G-Cube Solutions
- Gamifier Inc.
- BI Worldwide
- Kahoot!ASA
- Classcraft Studios Inc.
第7章 市場機會與未來展望
According to Mordor Intelligence, the gamification market size was valued at USD 29.11 billion in 2025 and estimated to grow from USD 36.46 billion in 2026 to reach USD 112.32 billion by 2031, at a CAGR of 25.24% during the forecast period (2026-2031).
This report is Segmented by Deployment (On-Premise, and Cloud), Organization Size (Small and Medium Enterprises, and Large Enterprises), Industry Vertical (Retail, BFSI, Government, Healthcare, and More), Application (Marketing and Sales, HR and Training, Product Development and Innovation, Customer Support and Experience, and Others), and Geography. The Market Forecasts are Provided in Terms of Value (USD).
Global Gamification Market Trends and Insights
Surge in Cloud-First Digital-Workplace Roll-Outs
Enterprises accelerating cloud migration need engagement tools that function natively across hybrid teams. Microsoft Power Apps embeds game mechanics directly into workflows, cutting rollout times from months to weeks . Cloud-hosted platforms generate the 27.58% CAGR forecast because they consolidate data streams and push real-time leaderboards to any device. Organizations integrating gamification with existing cloud infrastructure report up to 90% productivity improvement in remote work settings. The cost advantages of subscription licensing further accelerate adoption. As IT departments rationalize on-premise assets, cloud-native vendors gain a structural advantage that is unlikely to reverse over the outlook period.
Proliferation of Low-Code Gamification Platforms
Drag-and-drop development is democratizing the design of engagement experiences. SAP Build allows citizen developers to insert challenges, badges, and rewards into core business processes without writing code, trimming development spend by 70% against bespoke projects. The accessibility expands the total addressable base beyond large enterprises to SMEs that lacked technical resources. Platform vendors report a surge in templates focused on sales contests and onboarding missions, indicating mainstream business adoption. Because low-code stacks connect directly to SaaS ecosystems, they also shorten proof-of-value cycles, a key procurement hurdle for smaller firms. The structural decline in custom development aligns with the segment's 28.67% SME CAGR.
Poorly-Designed Programs Deliver Negative ROI
Superficial point-and-badge deployments risk disengagement and budget waste. Versus Systems' client roster fell from 16 to 5 in 2023 after lackluster implementations failed to sustain user interest, exemplifying backlash against gimmicky rollouts. Enterprises now demand business-outcome metrics, such as sales lift or error-rate reduction, before green-lighting new projects. This scrutiny lengthens sales cycles and forces vendors to provide stronger consultative support. Implementation missteps in early-adopter sectors also create caution among laggards, dampening near-term spend. Vendors that neglect instructional design and behavioral science risk reputational damage that can reverberate across the wider gamification market.
Other drivers and restraints analyzed in the detailed report include:
- Retail Loyalty Wars Escalating Points and Badges Adoption
- Smartphone-Centric Micro-Learning for Frontline Workforces
- Antigaming Clauses in Sector-Specific Compliance (HIPAA, MiFID-II)
For complete list of drivers and restraints, kindly check the Table Of Contents.
Segment Analysis
Cloud solutions accounted for 67.62% of 2025 revenue, and their share of the gamification market size is projected to climb further, given a 26.91% CAGR to 2031. Real-time telemetry, seamless updates, and elastic storage underpin the preference, while maturing security certifications sway even conservative sectors. On-premise packages remain relevant where data sovereignty is paramount, yet shrinking IT budgets and rising cyber-insurance premiums tilt cost-benefit equations toward managed hosting.
Rapid iteration cycles, achieved through continuous delivery pipelines, let cloud vendors fine-tune achievement algorithms and A/B-test narratives without client-side patches. Enterprises report 37% productivity gains when advanced analytics recommend personalized challenges in real time. Hybrid rollouts serve as a transitional choice, allowing sensitive data to stay on site while engagement logic resides in the cloud. Over the forecast, migration to public-cloud stacks is expected to standardize integration patterns, reducing total cost of ownership and consolidating vendor footprints.
Large enterprises contributed 57.02% to 2025 revenue, reflecting deep budgets and complex integration needs. In contrast, SMEs represent the fastest-growing slice of the gamification market, expanding at 27.65% CAGR. Freemium pricing, template libraries, and pay-as-you-grow architectures lower entry barriers for smaller firms.
SMEs typically target narrow pain points-motivating a sales pod or onboarding seasonal staff-allowing them to demonstrate ROI within weeks. Government digitalization grants in markets such as Singapore further stimulate uptake by offsetting subscription fees. Feature parity is narrowing because cloud platforms offer enterprise-grade identity management at mass-market price tiers. As a result, mid-market buyers increasingly insist on SOC 2 compliance and single-sign-on, forcing vendors to harden security roadmaps while keeping price elasticity.
Complete Report Scope:
- By Deployment
- On-Premise
- Cloud
- By Organization Size
- Large Enterprises
- Small and Medium Enterprises (SMEs)
- By Industry Vertical
- Retail
- BFSI
- Government
- Healthcare
- Education and Research
- IT and Telecom
- Others
- By Application
- Marketing and Sales
- HR and Training
- Product Development and Innovation
- Customer Support and Experience
- Others
- By Geography
- North America
- United States
- Canada
- Mexico
- South America
- Brazil
- Argentina
- Colombia
- Rest of South America
- Europe
- Germany
- United Kingdom
- France
- Italy
- Spain
- Russia
- Netherlands
- Rest of Europe
- Asia-Pacific
- China
- Japan
- South Korea
- India
- Australia
- Singapore
- Rest of Asia-Pacific
- Middle East and Africa
- Middle East
- Saudi Arabia
- United Arab Emirates
- Rest of Middle East
- Africa
- South Africa
- Egypt
- Rest of Africa
- Middle East
- North America
Geography Analysis
North America generated 38.74% of 2025 revenue, benefitting from early SaaS adoption and a deep vendor ecosystem. Corporations prioritize integrations with HRIS and CRM suites, leading to rapid feature rollouts that drive wallet share. Federal accessibility litigation risk motivates platforms to invest in WCAG-compliant design, raising quality thresholds for all suppliers.
Asia-Pacific records the highest regional CAGR at 28.6%, powered by mobile-first working patterns and government-sponsored digital-skills programs. Singapore's public-service gamification initiatives validate efficacy and encourage private-sector replication. Thailand's digital-wallet scheme experiments with gamified Central Bank Digital Currency incentives, signaling policy-level endorsement. Companies capitalize by shipping lightweight applications optimized for low-latency 5G networks, accelerating uptake in populous markets such as India and Indonesia.
Europe shows steady demand despite stringent privacy rules. GDPR obligations spur innovation in differential-privacy analytics that anonymize reward data. Vendors with in-house legal teams gain an edge when customizing consent flows for financial institutions subject to MiFID-II. South America and the Middle East and Africa trail in absolute dollars but benefit from growing smartphone penetration, making cloud-hosted, mobile-native solutions the default choice. Localization-both linguistic and cultural-remains a decisive factor in conversion rates across these emerging territories.
- Microsoft Corporation
- SAP SE
- Cognizant Technology Solutions Corp.
- Axonify Inc.
- Aon plc (incl. Aon Assessment)
- Bunchball Inc.
- Salesforce Inc. (incl. Trailhead)
- Cisco Systems Inc.
- LevelEleven LLC
- Badgeville Inc.
- Genesys Cloud Services Inc.
- Callidus Software Inc. (SAP Litmos)
- Ambition Solutions Inc.
- MPS Interactive Systems Ltd.
- IACTIONABLE Inc.
- G-Cube Solutions
- Gamifier Inc.
- BI Worldwide
- Kahoot! ASA
- Classcraft Studios Inc.
Additional Benefits:
- The market estimate (ME) sheet in Excel format
- 3 months of analyst support
TABLE OF CONTENTS
1 INTRODUCTION
- 1.1 Study Assumptions and Market Definition
- 1.2 Scope of the Study
2 RESEARCH METHODOLOGY
3 EXECUTIVE SUMMARY
4 MARKET INSIGHTS
- 4.1 Market Overview
- 4.2 Market Drivers
- 4.2.1 Surge in cloud-first digital-workplace roll-outs
- 4.2.2 Proliferation of low-code gamification platforms
- 4.2.3 Retail loyalty wars escalating points and badges adoption
- 4.2.4 Smartphone-centric micro-learning for frontline workforces
- 4.2.5 Privacy-preserving engagement analytics
- 4.2.6 Gamified CBDC pilots by central banks
- 4.3 Market Restraints
- 4.3.1 Poorly-designed programs deliver negative ROI
- 4.3.2 Inter-platform data-ownership disputes
- 4.3.3 Antigaming clauses in sector-specific compliance (HIPAA, MiFID-II)
- 4.3.4 Accessibility lawsuits on non-inclusive game mechanics
- 4.4 Value Chain Analysis
- 4.5 Regulatory Landscape
- 4.6 Technological Outlook
- 4.7 Porter's Five Forces Analysis
- 4.7.1 Bargaining Power of Suppliers
- 4.7.2 Bargaining Power of Buyers
- 4.7.3 Threat of New Entrants
- 4.7.4 Threat of Substitutes
- 4.7.5 Competitive Rivalry
- 4.8 Industry Ecosystem Analysis
- 4.9 Key Use Cases and Case Studies
- 4.10 Assessment of Macroeconomic Trends
- 4.11 Investment Analysis
5 MARKET SIZE AND GROWTH FORECASTS (VALUE)
- 5.1 By Deployment
- 5.1.1 On-Premise
- 5.1.2 Cloud
- 5.2 By Organization Size
- 5.2.1 Large Enterprises
- 5.2.2 Small and Medium Enterprises (SMEs)
- 5.3 By Industry Vertical
- 5.3.1 Retail
- 5.3.2 BFSI
- 5.3.3 Government
- 5.3.4 Healthcare
- 5.3.5 Education and Research
- 5.3.6 IT and Telecom
- 5.3.7 Others
- 5.4 By Application
- 5.4.1 Marketing and Sales
- 5.4.2 HR and Training
- 5.4.3 Product Development and Innovation
- 5.4.4 Customer Support and Experience
- 5.4.5 Others
- 5.5 By Geography
- 5.5.1 North America
- 5.5.1.1 United States
- 5.5.1.2 Canada
- 5.5.1.3 Mexico
- 5.5.2 South America
- 5.5.2.1 Brazil
- 5.5.2.2 Argentina
- 5.5.2.3 Colombia
- 5.5.2.4 Rest of South America
- 5.5.3 Europe
- 5.5.3.1 Germany
- 5.5.3.2 United Kingdom
- 5.5.3.3 France
- 5.5.3.4 Italy
- 5.5.3.5 Spain
- 5.5.3.6 Russia
- 5.5.3.7 Netherlands
- 5.5.3.8 Rest of Europe
- 5.5.4 Asia-Pacific
- 5.5.4.1 China
- 5.5.4.2 Japan
- 5.5.4.3 South Korea
- 5.5.4.4 India
- 5.5.4.5 Australia
- 5.5.4.6 Singapore
- 5.5.4.7 Rest of Asia-Pacific
- 5.5.5 Middle East and Africa
- 5.5.5.1 Middle East
- 5.5.5.1.1 Saudi Arabia
- 5.5.5.1.2 United Arab Emirates
- 5.5.5.1.3 Rest of Middle East
- 5.5.5.2 Africa
- 5.5.5.2.1 South Africa
- 5.5.5.2.2 Egypt
- 5.5.5.2.3 Rest of Africa
- 5.5.5.1 Middle East
- 5.5.1 North America
6 COMPETITIVE LANDSCAPE
- 6.1 Market Concentration
- 6.2 Strategic Moves
- 6.3 Market Share Analysis
- 6.4 Company Profiles (includes Global level Overview, Market level overview, Core Segments, Financials as available, Strategic Information, Market Rank/Share for key companies, Products and Services, and Recent Developments)
- 6.4.1 Microsoft Corporation
- 6.4.2 SAP SE
- 6.4.3 Cognizant Technology Solutions Corp.
- 6.4.4 Axonify Inc.
- 6.4.5 Aon plc (incl. Aon Assessment)
- 6.4.6 Bunchball Inc.
- 6.4.7 Salesforce Inc. (incl. Trailhead)
- 6.4.8 Cisco Systems Inc.
- 6.4.9 LevelEleven LLC
- 6.4.10 Badgeville Inc.
- 6.4.11 Genesys Cloud Services Inc.
- 6.4.12 Callidus Software Inc. (SAP Litmos)
- 6.4.13 Ambition Solutions Inc.
- 6.4.14 MPS Interactive Systems Ltd.
- 6.4.15 IACTIONABLE Inc.
- 6.4.16 G-Cube Solutions
- 6.4.17 Gamifier Inc.
- 6.4.18 BI Worldwide
- 6.4.19 Kahoot! ASA
- 6.4.20 Classcraft Studios Inc.
7 MARKET OPPORTUNITIES AND FUTURE OUTLOOK
- 7.1 White-space and Unmet-Need Assessment

 銷售遊戲化軟體市場:按組件、整合類型、部署模式、組織規模、應用程式和產業分類-2026-2032年全球市場預測
 2026-2030年全球遊戲化市場
 全球教育遊戲化市場規模、佔有率、趨勢和成長分析報告(2026-2034)
 遊戲化市場(至2035年):按組件類型、應用領域、部署模式、組織規模、最終用戶產業、地區和主要參與者分類:產業趨勢和全球市場預測
 遊戲化市場-全球產業規模、佔有率、趨勢、機會與預測:按解決方案、部署類型、組織規模、最終用戶產業、地區和競爭對手分類,2021-2031年
 遊戲化市場規模、佔有率、趨勢和預測:按組件、部署模式、企業規模、行業和地區分類,2026-2034 年遊戲化市場:全球市場按類型、平台、應用、最終用戶和部署方式分類的預測——2026-2032年
 2026年全球學習遊戲化市場報告2026年全球教育遊戲化市場報告
 遊戲化市場:按組件、部署方式、最終用戶產業和地區分類