


 |
市場調查報告書
商品編碼
1851648
自然語言處理:市場佔有率分析、行業趨勢、統計數據和成長預測(2025-2030 年)Natural Language Processing - Market Share Analysis, Industry Trends & Statistics, Growth Forecasts (2025 - 2030) |
||||||
※ 本網頁內容可能與最新版本有所差異。詳細情況請與我們聯繫。
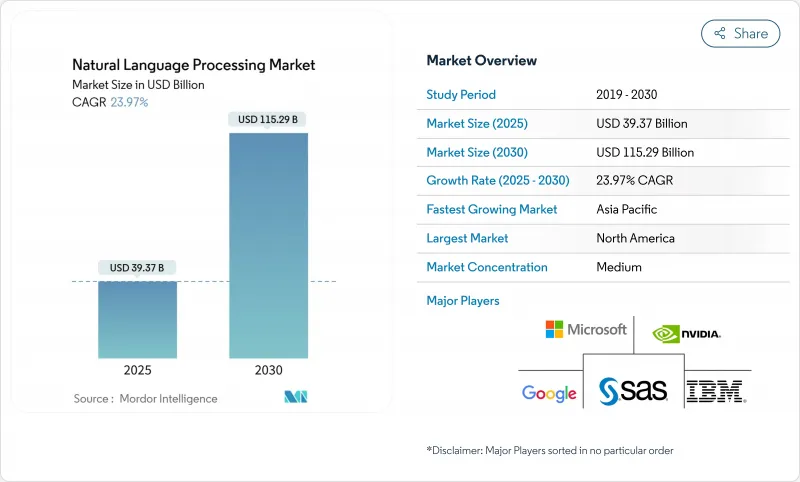
預計到 2025 年,自然語言處理市場規模將達到 393.7 億美元,到 2030 年將達到 1,152.9 億美元,預測期(2025-2030 年)複合年成長率為 23.97%。
受生成式人工智慧精準度不斷提升以及企業持續增加對話式配置投入的推動,市場需求依然強勁。科技巨頭承諾在2025年向人工智慧領域投資3,000億美元,將增強長期資本的可用性。雲端採用率佔自然語言處理(NLP)市場的63.40%,預計到2030年,隨著企業傾向可擴展的推理基礎設施,該細分市場將以24.95%的複合年成長率成長。大型企業佔總市場佔有率的57.80%,而中小企業的採用率預計將以25.01%的年成長率成長,這表明易於使用的雲端API正在降低採用門檻。軟體仍然是最大的組成部分,佔46.00%的佔有率,但實施服務正以26.08%的複合年成長率成長,反映出對專家模型整合的需求日益成長。北美佔全球收入的 33.30%,而亞太地區是成長最快的地區,複合年成長率達 25.85%,這得益於當地語言模式舉措和公共資金的推動。
全球自然語言處理市場趨勢與洞察
利用生成式人工智慧提高模型精度
新型大規模語言模式如今能夠在複雜任務中維持更低的錯誤率,使企業能夠將更多工作負載投入運作。 Anthropic 的 Claude 家族模式便是其成功的有力證明。隨著程式碼產生技術在企業中的應用日益廣泛,其年收入從 2024 年 12 月的 10 億美元成長至 2025 年 5 月的 30 億美元。在醫療保健領域,CHECK 框架將臨床語言模型的誤判率從 31% 降低至 0.3%,為高風險環境下的自動化合規鋪平了道路。金融機構更青睞業界客製化的模型,例如 Baichuan4-Finance,它在認證測試中表現優於通用模型,同時保持了廣泛的推理能力。由於準確性直接影響監管核准和投資報酬率,企業持續投入預算用於模型的微調和評估流程。
對話式人工智慧在客戶支援領域的應用激增
自動化客服人員能夠解決大部分第一線諮詢,從而顯著節省人力成本。 Intercom 在其客服系統中整合 Claude AI 後,實現了 45 種語言 86% 的問題解決率。受阿里巴巴和 HDFC 銀行等服務於多語言客戶群的企業部署的推動,亞太地區對話式人工智慧市場預計到 2032 年將以 24.1% 的複合年成長率成長。 Teneo.ai 在保持 95% 自然語言理解準確率的同時,實現了每次自動化通話 5.60 美元的成本節約。隨著翻譯品質的提升,企業正在全部區域部署單一的機器人,而不是各自獨立的語言團隊,這進一步增強了加速採用該技術的商業價值。
缺乏高品質、無偏的訓練數據
特定領域資料集的匱乏阻礙了專業應用的效能。越南透過發布ViGPT解決了本地語言差距問題。歐盟人工智慧法進一步強制要求對高風險系統進行偏見監控,加重了合規負擔。醫療保健和金融業面臨的挑戰尤其嚴峻,因為隱私法規限制了可用資料池,並有利於擁有專有資料集的公司。
細分市場分析
預計到2024年,雲端運算將佔據自然語言處理(NLP)市場63.40%的佔有率,並在2030年之前以24.95%的複合年成長率成長。基於使用量的定價和彈性運算是推動雲端運算領先地位的主要因素,因為企業無需投資本地硬體即可嘗試產生式工作負載。微軟Azure AI服務的年收入超過130億美元,年增157%。混合模式將推理任務分配到本地集群和公共雲端,服務於資料持久性規則嚴格的監管行業。邊緣配置正在為對延遲敏感的任務提供雲端運算的補充,充分利用智慧型手機的運算能力,而智慧型手機的總運算能力正以每年25%的速度成長。這種組合表明,NLP市場將圍繞特定工作負載的部署模式進行組織,而不是由單一的主導模式主導。
到2024年,大型企業將佔據自然語言處理(NLP)市場57.80%的佔有率,這主要得益於其資料資產和內部人工智慧團隊。然而,預計到2030年,中小企業將以25.01%的複合年成長率超越大型企業,因為承包的API使他們能夠訪問高級模型。研究表明,中小企業最初專注於客戶支援和文件處理,之後才會擴展到高級分析。基於API的計量收費消除了前期投資,使中小企業能夠快速證明投資回報。相反,大型企業則投入資源進行客製化微調,並建立內部語言學習管理(LLM)中心,以解決合規性和安全性問題。這種脫節將迫使NLP產業在滿足中小企業的規模成長和滿足大型企業的高價值客製化計劃需求之間取得平衡。
自然語言處理市場報告配置(本地部署、雲端部署)、組織規模(大型企業、中小企業)、組件(硬體、軟體、服務)、處理類型(文字、語音/語音、圖像/視覺)、最終用戶行業(銀行、金融服務和保險、醫療保健/生命科學、IT/電信、零售/電子商務、製造業、其他)和地區進行細分。
區域分析
北美仍將是最大的區域貢獻者,預計2024年營收將成長33.30%。微軟雲端業務營收預計在2025會計年度第三季達到424億美元,年增20%,其中人工智慧服務是主要驅動力。資金籌措和更法規環境正在加速企業採用雲端技術。
亞太地區預計將以25.85%的複合年成長率成長,這主要得益於政府人工智慧專案和本地語言模型的發展。日本致力於支持東南亞地區的本地語言模型能力建設,顯示其正努力減少對外國供應商的依賴。到2032年,該地區對話式人工智慧收入將以24.1%的複合年成長率成長,預示著市場對多語言客戶參與工具的需求將持續旺盛。
在歐洲,歐盟人工智慧法案即將生效,該法案鼓勵技術創新並要求嚴格遵守相關規定。預計到2025年第一季,德國人工智慧市場規模將達到100億歐元,年增25%,其中西門子等公司已實現90%的文件工作流程自動化。該法規詳細的風險等級分類有利於能夠記錄其流程的供應商,從而支持謹慎而穩健的成長。儘管南美洲和中東及非洲地區仍在發展中,但公共雲端和智慧型設備的日益普及表明,自然語言處理(NLP)市場仍蘊藏著巨大的潛力。
其他福利:
- Excel格式的市場預測(ME)表
- 3個月的分析師支持
目錄
第1章 引言
- 研究假設和市場定義
- 調查範圍
第2章調查方法
第3章執行摘要
第4章 市場情勢
- 市場概覽
- 市場促進因素
- 利用生成式人工智慧提高模型精度
- 對話式人工智慧在客戶支援領域的應用激增
- 將自然語言處理技術整合到嵌入式/邊緣設備中
- 為受監管產業推廣特定領域的LLM課程
- 汽車和智慧型設備對即時語音辨識的需求日益成長
- 多模態平台模式開啟了新的垂直市場
- 市場限制
- 缺乏高品質、無偏的訓練數據
- 大型模型的推理成本不斷增加
- 跨境資料駐留的合規障礙
- 大規模訓練運算的環境足跡
- 價值/供應鏈分析
- 監管環境
- 技術展望
- 波特五力分析
- 供應商的議價能力
- 買方的議價能力
- 新進入者的威脅
- 替代品的威脅
- 競爭對手之間的競爭
- 新冠疫情的影響及宏觀經濟放緩
- 投資分析
第5章 市場規模與成長預測
- 透過部署
- 本地部署
- 雲
- 按組織規模
- 主要企業
- 小型企業
- 按組件
- 硬體
- 軟體
- 服務
- 按處理類型
- 文字
- 言語/聲音
- 圖像/視覺
- 按最終用戶行業分類
- BFSI
- 醫療保健和生命科學
- 資訊科技和電訊
- 零售與電子商務
- 製造業
- 媒體與娛樂
- 教育
- 其他
- 按地區
- 北美洲
- 美國
- 加拿大
- 墨西哥
- 南美洲
- 巴西
- 阿根廷
- 其他南美洲
- 歐洲
- 英國
- 德國
- 法國
- 義大利
- 西班牙
- 其他歐洲地區
- 亞太地區
- 中國
- 日本
- 印度
- 韓國
- 亞太其他地區
- 中東和非洲
- 中東
- 沙烏地阿拉伯
- 阿拉伯聯合大公國
- 土耳其
- 其他中東地區
- 非洲
- 南非
- 奈及利亞
- 其他非洲地區
- 北美洲
第6章 競爭情勢
- 市場集中度
- 策略趨勢
- 市佔率分析
- 公司簡介
- Microsoft Corp.
- Google LLC(Alphabet)
- Amazon Web Services
- IBM Corp.
- NVIDIA Corp.
- OpenAI LP
- Meta Platforms Inc.
- SAP SE
- Oracle Corp.
- Baidu Inc.
- Intel Corp.
- Qualcomm Inc.
- SAS Institute Inc.
- Adobe Inc.
- Salesforce Inc.
- Apple Inc.
- Verint Systems Inc.
- Nuance Communications(Microsoft)
- Cohere Inc.
- Hugging Face
- Grammarly Inc.
第7章 市場機會與未來展望
The Natural Language Processing Market size is estimated at USD 39.37 billion in 2025, and is expected to reach USD 115.29 billion by 2030, at a CAGR of 23.97% during the forecast period (2025-2030).
Continued enterprise spending on generative AI accuracy gains and conversational deployments keeps demand strong, with technology majors committing USD 300 billion to AI investments in 2025, reinforcing long-term capital availability. Cloud deployment holds 63.40% of the NLP market, and the segment is expected to post a 24.95% CAGR to 2030 as organizations favor scalable inference infrastructure. Large enterprises account for 57.80% of overall adoption, yet SME uptake is projected to climb 25.01% annually, signaling that accessible cloud APIs are lowering adoption barriers. Software remains the largest component at 46.00% share, while implementation services, expanding at 26.08% CAGR, reflect growing demand for expert model integration. North America contributes 33.30% of global revenues, though Asia Pacific is the fastest-growing region at 25.85% CAGR, thanks to local language model initiatives and supportive public funding.
Global Natural Language Processing Market Trends and Insights
Generative-AI-powered model accuracy gains
Enterprises are moving more workloads into production because newer large language models can now sustain far lower error rates in complex tasks. Anthropic's Claude family illustrates the jump: annualized revenue rose from USD 1 billion in December 2024 to USD 3 billion by May 2025 as code-generation deployments scaled inside corporations. In healthcare, the CHECK framework cut hallucinations in clinical language models from 31% to 0.3%, opening a path for compliance-ready automation in high-risk settings. Financial institutions prefer sector-tuned options such as Baichuan4-Finance, which outperforms general models on certification exams while preserving broad reasoning ability. Because accuracy drives both regulatory acceptance and ROI, firms continue allocating budgets toward fine-tuning and evaluation pipelines that squeeze incremental gains from every new model release.
Surge in conversational AI adoption in customer support
Automated agents are now resolving a majority of frontline queries, unlocking sizable labor savings. Intercom reports 86% full resolution across 45 languages after embedding Claude AI into its support stack. The Asia-Pacific conversational AI market is expanding at a 24.1% CAGR through 2032, helped by rollouts at Alibaba and HDFC Bank that serve multilingual customer bases. Teneo.ai documents USD 5.60 cost reduction for every call it automates while maintaining 95% natural-language understanding accuracy. As translation quality improves, enterprises deploy a single bot across regions rather than running siloed language teams, strengthening the business case for faster uptake.
Shortage of High-Quality, Bias-Free Training Data
Limited domain-specific datasets impede performance for specialized uses. Vietnam responded by releasing ViGPT to address local linguistic gaps. The EU AI Act further mandates bias monitoring for high-risk systems, raising compliance workloads. Healthcare and finance feel the squeeze hardest, as privacy regulations restrict usable data pools, giving firms with proprietary datasets a head start.
Other drivers and restraints analyzed in the detailed report include:
- Integration of NLP in embedded/edge devices
- Proliferation of domain-specific LLMs for regulated industries
- Escalating Inference Costs for Large Models
For complete list of drivers and restraints, kindly check the Table Of Contents.
Segment Analysis
Cloud accounts for 63.40% of the NLP market share in 2024, and the segment is projected to log a 24.95% CAGR to 2030. Usage-based pricing and elastic compute underpin its lead as enterprises experiment with generative workloads without investing in on-prem hardware. Microsoft Azure AI services grew 157% year-over-year to surpass USD 13 billion annualized revenue. Hybrid models serve regulated industries where data residency rules persist, splitting inference between local clusters and public clouds. Edge deployments now supplement cloud for latency-sensitive tasks, leveraging smartphones whose aggregate compute rises 25% yearly. This mix suggests the NLP market will organize around workload-specific deployment rather than a single dominant mode.
Large enterprises held 57.80% of the NLP market share in 2024, sustained by data assets and in-house AI staff. Yet SMEs are expected to outpace with a 25.01% CAGR through 2030 as turnkey APIs make advanced models accessible. Studies note SMEs pivot first on customer support and document processing before scaling to advanced analytics. API-based pay-as-you-go removes upfront capital, allowing SMEs to prove ROI quickly. Conversely, large firms pour resources into custom fine-tuning, spinning internal LLM centers of excellence to navigate compliance and security. This divergence will keep the NLP industry balanced between volume growth from SMEs and high-value bespoke projects at larger corporations.
The Natural Language Processing Market Report is Segmented by Deployment (On-Premise and Cloud), Organization Size (Large Organizations and Small and Medium Enterprises [SMEs]), Component (Hardware, Software, and Services), Processing Type (Text, Speech/Voice, and Image/Vision), End-User Industry (BFSI, Healthcare and Life Sciences, IT and Telecom, Retail and E-Commerce, Manufacturing, and More), and Geography.
Geography Analysis
North America commanded 33.30% revenue in 2024 and remains the largest regional contributor. Microsoft Cloud revenue reached USD 42.4 billion in FY 2025 Q3, up 20% year-over-year, with AI services a key driver. Venture funding and an enabling regulatory setting combine to accelerate enterprise rollouts.
Asia Pacific is projected to post a 25.85% CAGR, propelled by sovereign AI programs and local-language model development. Japan's commitment to support Southeast Asian LLM capacity showcases efforts to cut reliance on foreign providers. Regional conversational AI revenue tracks at 24.1% CAGR to 2032, indicating sustained demand for multilingual customer engagement tools.
Europe advances under the EU AI Act, balancing innovation with stringent compliance. Germany's AI market climbed 25% year-on-year to EUR 10 billion in Q1 2025, with companies like Siemens achieving 90% automation in document workflows. The regulation's detailed risk tiers favor vendors able to document processes, and this supports steady though measured growth. South America and MEA remain nascent, yet rising public-cloud footprints and smart-device adoption foreshadow untapped potential for the NLP market.
- Microsoft Corp.
- Google LLC (Alphabet)
- Amazon Web Services
- IBM Corp.
- NVIDIA Corp.
- OpenAI LP
- Meta Platforms Inc.
- SAP SE
- Oracle Corp.
- Baidu Inc.
- Intel Corp.
- Qualcomm Inc.
- SAS Institute Inc.
- Adobe Inc.
- Salesforce Inc.
- Apple Inc.
- Verint Systems Inc.
- Nuance Communications (Microsoft)
- Cohere Inc.
- Hugging Face
- Grammarly Inc.
Additional Benefits:
- The market estimate (ME) sheet in Excel format
- 3 months of analyst support
TABLE OF CONTENTS
1 INTRODUCTION
- 1.1 Study Assumptions and Market Definition
- 1.2 Scope of the Study
2 RESEARCH METHODOLOGY
3 EXECUTIVE SUMMARY
4 MARKET LANDSCAPE
- 4.1 Market Overview
- 4.2 Market Drivers
- 4.2.1 Generative-AI-powered model accuracy gains
- 4.2.2 Surge in conversational AI adoption in customer support
- 4.2.3 Integration of NLP in embedded/edge devices
- 4.2.4 Proliferation of domain-specific LLMs for regulated industries
- 4.2.5 Rising demand for real-time speech recognition in automotive and smart devices
- 4.2.6 Multimodal foundation models unlocking new verticals
- 4.3 Market Restraints
- 4.3.1 Shortage of high-quality, bias-free training data
- 4.3.2 Escalating inference costs for large models
- 4.3.3 Cross-border data residency compliance barriers
- 4.3.4 Environmental footprint of large-scale training compute
- 4.4 Value/Supply-Chain Analysis
- 4.5 Regulatory Landscape
- 4.6 Technological Outlook
- 4.7 Porter's Five Forces Analysis
- 4.7.1 Bargaining Power of Suppliers
- 4.7.2 Bargaining Power of Buyers
- 4.7.3 Threat of New Entrants
- 4.7.4 Threat of Substitutes
- 4.7.5 Intensity of Competitive Rivalry
- 4.8 Impact of COVID-19 and Macro Slowdown
- 4.9 Investment Analysis
5 MARKET SIZE AND GROWTH FORECASTS (VALUE)
- 5.1 By Deployment
- 5.1.1 On-premise
- 5.1.2 Cloud
- 5.2 By Organization Size
- 5.2.1 Large Enterprises
- 5.2.2 Small and Medium Enterprises (SMEs)
- 5.3 By Component
- 5.3.1 Hardware
- 5.3.2 Software
- 5.3.3 Services
- 5.4 By Processing Type
- 5.4.1 Text
- 5.4.2 Speech/Voice
- 5.4.3 Image/Vision
- 5.5 By End-user Industry
- 5.5.1 BFSI
- 5.5.2 Healthcare and Life Sciences
- 5.5.3 IT and Telecom
- 5.5.4 Retail and E-commerce
- 5.5.5 Manufacturing
- 5.5.6 Media and Entertainment
- 5.5.7 Education
- 5.5.8 Others
- 5.6 By Geography
- 5.6.1 North America
- 5.6.1.1 United States
- 5.6.1.2 Canada
- 5.6.1.3 Mexico
- 5.6.2 South America
- 5.6.2.1 Brazil
- 5.6.2.2 Argentina
- 5.6.2.3 Rest of South America
- 5.6.3 Europe
- 5.6.3.1 United Kingdom
- 5.6.3.2 Germany
- 5.6.3.3 France
- 5.6.3.4 Italy
- 5.6.3.5 Spain
- 5.6.3.6 Rest of Europe
- 5.6.4 Asia-Pacific
- 5.6.4.1 China
- 5.6.4.2 Japan
- 5.6.4.3 India
- 5.6.4.4 South Korea
- 5.6.4.5 Rest of Asia-Pacific
- 5.6.5 Middle East and Africa
- 5.6.5.1 Middle East
- 5.6.5.1.1 Saudi Arabia
- 5.6.5.1.2 United Arab Emirates
- 5.6.5.1.3 Turkey
- 5.6.5.1.4 Rest of Middle East
- 5.6.5.2 Africa
- 5.6.5.2.1 South Africa
- 5.6.5.2.2 Nigeria
- 5.6.5.2.3 Rest of Africa
- 5.6.1 North America
6 COMPETITIVE LANDSCAPE
- 6.1 Market Concentration
- 6.2 Strategic Moves
- 6.3 Market Share Analysis
- 6.4 Company Profiles (includes Global level Overview, Market level overview, Core Segments, Financials as available, Strategic Information, Market Rank/Share, Products and Services, Recent Developments)
- 6.4.1 Microsoft Corp.
- 6.4.2 Google LLC (Alphabet)
- 6.4.3 Amazon Web Services
- 6.4.4 IBM Corp.
- 6.4.5 NVIDIA Corp.
- 6.4.6 OpenAI LP
- 6.4.7 Meta Platforms Inc.
- 6.4.8 SAP SE
- 6.4.9 Oracle Corp.
- 6.4.10 Baidu Inc.
- 6.4.11 Intel Corp.
- 6.4.12 Qualcomm Inc.
- 6.4.13 SAS Institute Inc.
- 6.4.14 Adobe Inc.
- 6.4.15 Salesforce Inc.
- 6.4.16 Apple Inc.
- 6.4.17 Verint Systems Inc.
- 6.4.18 Nuance Communications (Microsoft)
- 6.4.19 Cohere Inc.
- 6.4.20 Hugging Face
- 6.4.21 Grammarly Inc.
7 MARKET OPPORTUNITIES AND FUTURE OUTLOOK
- 7.1 White-space and Unmet-need Assessment
 自然語言處理市場:預測(至2034年)-按組件、部署方式、技術類型、語言類型、應用、最終用戶和地區分類的全球分析
 教育領域自然語言處理(NLP)市場規模、佔有率和成長分析:按服務類型、外包形式、公司規模、應用、產業和地區分類-2026-2033年產業預測
 2026-2030年全球模型推理最佳化工具市場
 2026-2030年全球模型評估與基準測試工具市場
 自然語言處理市場:按組件、部署類型、組織規模、應用程式和最終用戶分類-2026-2032年全球市場預測
 2026年全球多模態評估工具市場報告教育領域自然語言處理市場:按應用、組件、部署、交付和最終用戶分類-2026年至2032年全球市場預測
 自然語言處理市場:按元件類型、應用程式、部署模式、最終用戶產業和地區分類
 自然語言處理(NLP)市場報告:按類型、技術、部署模式、組織規模、最終用戶和地區分類,2026-2034年
 全球自然語言處理市場規模、佔有率、趨勢和成長分析報告(2026-2034)