


 |
市場調查報告書
商品編碼
1273486
芋頭市場 - COVID-19 的增長、趨勢、影響和預測 (2023-2028)Taro Market - Growth, Trends, and Forecasts (2023 - 2028) |
||||||
※ 本網頁內容可能與最新版本有所差異。詳細情況請與我們聯繫。
在預測期內,全球芋頭市場預計將以 3.5% 的複合年增長率增長。
主要亮點
- 芋頭 (Colocasia esculenta) 富含碳水化合物,是小麥粉的良好替代品。 然而,眾所周知,它經常被資源匱乏的農民種植,因為即使在貧瘠的土壤條件下,它也可以在很少或沒有作物投入的情況下產生合理的產量,因此是糧食安全的受益者。應該是有幫助的。 芋頭粉也越來越受歡迎,預計將在未來幾年推動市場增長。
- 芋頭是錦葵科植物中栽培最廣泛的品種。 美國、澳大利亞、日本和新西蘭等國家是主要的進口市場。 主要生產國是中國、厄瓜多爾、哥斯達黎加、斐濟和印度尼西亞。
- 在全球範圍內,北美在芋頭進口中占主導地位。 例如,2021年,美國將進口芋頭佔總進口量的35.7%。 北美和亞太國家不斷增長的需求推動了芋頭的生產。 2021年芋頭產量1230萬噸。 由於全球大流行的影響,這比上一年的 1260 萬噸產量略有下降。
芋頭市場趨勢
芋頭產量穩定
芋頭是碳水化合物的極好來源,可用於嬰兒食品和適合糖尿病患者的低血糖食品。 芋頭塊莖的澱粉分子比馬鈴薯、玉米和小麥小,可用作化妝品和藥片的粘合劑。 球莖和葉子都含有優質蛋白質,並且是磷、鉀、鈣和現成鐵的來源。 此外,芋頭塊莖中的澱粉有可能解決世界塑料問題,並可用於製造可隨時間降解的塑料。 芋頭因其高營養價值而在世界範圍內需求量很大。 因此,農民們正在增加芋頭的種植面積。
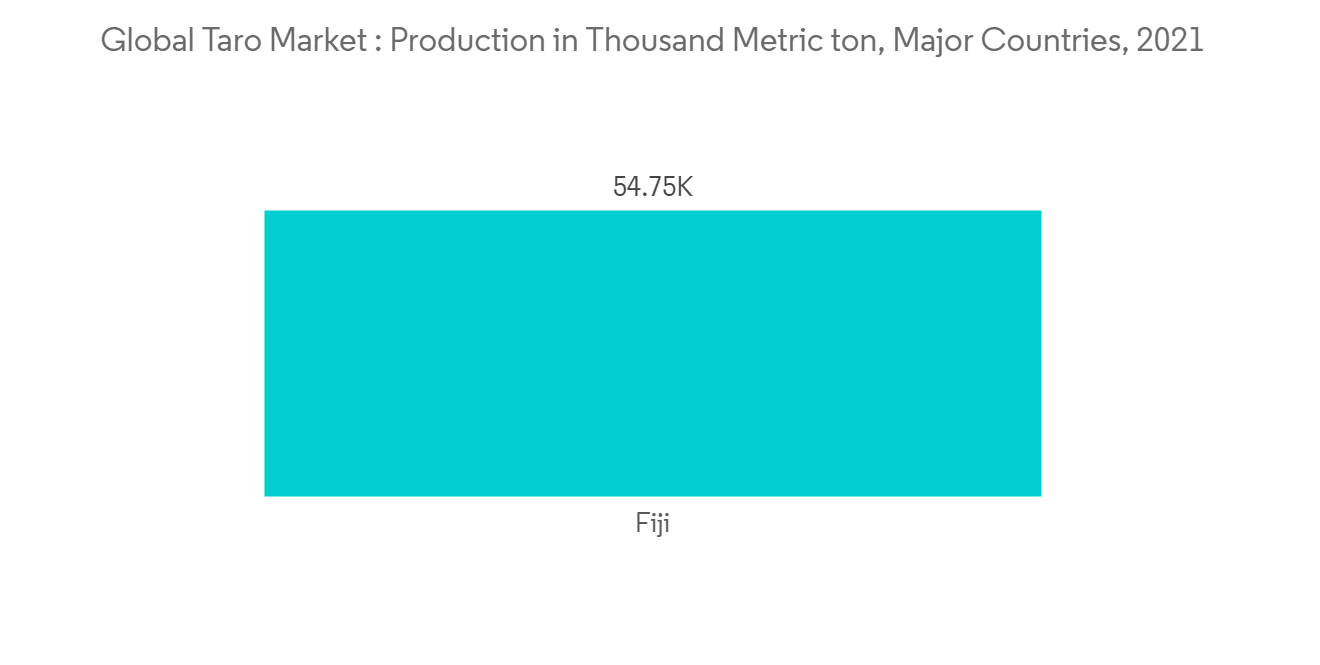
根據 FAOSTAT 的數據,受全球大流行的影響,芋頭產量為 1230 萬噸,略低於上年的 1260 萬噸。 中國、厄瓜多爾、哥斯達黎加、斐濟和印度尼西亞等主要生產國當年的產量佔世界的近86.3%,其中中國產量最高,達190萬噸,其次是斐濟。 這將在預測期內提振亞洲地區的芋頭市場。
北美主導世界進口
北美是芋頭的最大市場,由於消費者需求旺盛,它在全球市場中佔有壓倒性的份額。 在餐館裡,芋頭最常用於製作薯片,是玉米片或薯片的健康替代品。 根據 ITC Trade 的數據,2021 年全球進口額將達到 18125.8 萬美元,比 2020 年增長 21%。 2021年,美國和加拿大位居主要進口國之列,其中美國是北美地區最大的芋頭進口國。
2021年美國進口芋頭價值6467.4萬美元,佔全球進口的35.9%。 厄瓜多爾、墨西哥和哥斯達黎加是美國的主要出口國。 據ITC Trade稱,2021年,厄瓜多爾將向美國出口筒倉3530.9萬美元,墨西哥902.1萬美元,哥斯達黎加733.6萬美元。
此外,cocoyam 的高營養價值可能導致其在歐洲和美國的新市場中被用作其他蔬菜(例如菠菜)的替代品。 預計這將在預測期內推動市場擴張。

芋頭產業概況
其他福利:
- Excel 格式的市場預測 (ME) 表
- 3 個月的分析師支持
內容
第一章介紹
- 研究假設和市場定義
- 本次調查的範圍
第二章研究方法論
第 3 章執行摘要
第四章市場動態
- 市場概覽
- 市場驅動力
- 市場製約因素
- 價值鏈分析
第 5 章市場細分
- 地區
- 北美
- 美國
- 生產分析
- 消費市場分析和市場價值
- 進口市場分析(數量和價值)
- 出口市場分析(數量和價值)
- 價格趨勢分析
- 加拿大
- 生產分析
- 消費市場分析和市場價值
- 進口市場分析(數量和價值)
- 出口市場分析(數量和價值)
- 價格趨勢分析
- 歐洲
- 法國
- 生產分析
- 消費市場分析和市場價值
- 進口市場分析(數量和價值)
- 出口市場分析(數量和價值)
- 價格趨勢分析
- 德國
- 生產分析
- 消費市場分析和市場價值
- 進口市場分析(數量和價值)
- 出口市場分析(數量和價值)
- 價格趨勢分析
- 波蘭
- 生產分析
- 消費市場分析和市場價值
- 進口市場分析(數量和價值)
- 出口市場分析(數量和價值)
- 價格趨勢分析
- 俄羅斯
- 生產分析
- 消費市場分析和市場價值
- 進口市場分析(數量和價值)
- 出口市場分析(數量/價值)
- 價格趨勢分析
- 智利
- 生產分析
- 消費市場分析和市場價值
- 進口市場分析(數量和價值)
- 出口市場分析(數量和價值)
- 價格趨勢分析
- 亞太地區
- 中國
- 產量分析
- 消費市場分析和市場價值
- 進口市場分析(數量和價值)
- 出口市場分析(數量和價值)
- 價格趨勢分析
- 日本
- 生產分析
- 消費市場分析和市場價值
- 進口市場分析(數量和價值)
- 出口市場分析(數量和價值)
- 價格趨勢分析
- 馬來西亞
- 生產分析
- 消費市場分析和市場價值
- 進口市場分析(數量和價值)
- 出口市場分析(數量/價值)
- 價格趨勢分析
- 澳大利亞
- 生產分析
- 消費市場分析和市場價值
- 進口市場分析(數量和價值)
- 出口市場分析(數量和價值)
- 價格趨勢分析
- 印度
- 生產分析
- 消費市場分析和市場價值
- 進口市場分析(數量和價值)
- 出口市場分析(數量/價值)
- 價格趨勢分析
- 南美洲
- 巴西
- 生產分析
- 消費市場分析和市場價值
- 進口市場分析(數量和價值)
- 出口市場分析(數量和價值)
- 價格趨勢分析
- 阿根廷
- 生產分析
- 消費市場分析和市場價值
- 進口市場分析(數量和價值)
- 出口市場分析(數量和價值)
- 價格趨勢分析
- 中東和非洲
- 土耳其人
- 生產分析
- 消費市場分析和市場價值
- 進口市場分析(數量/價格)
- 出口市場分析(數量/價值)
- 價格趨勢分析
- 南非
- 生產分析
- 消費市場分析和市場價值
- 進口市場分析(數量和價值)
- 出口市場分析(數量/價值)
- 價格趨勢分析
- 北美
第六章市場機會與未來趨勢
The Global Taro Market is projected to register a CAGR of 3.5% during the forecast period.
Key Highlights
- Taro (Colocasia esculenta) is rich in carbohydrates and a good replacement for wheat flour. However, it is well-known to farmers for its ability to produce a reasonable yield in poor soil conditions with less or no farm inputs and often grown by resource-limited farmers, and is regarded as a good source of food security. Taro powder is also becoming popular, and this will boost the growth of the market in the coming years.
- Taro is the most widely cultivated species in the family Araceae, which is used as a vegetable. Countries such as the United States, Australia, Japan, and New Zealand are the key import market. Major producing countries are China, Ecuador, Costa Rica, Fiji, and Indonesia.
- Globally, North America is dominating taro imports. For instance, in 2021, the United States imported 35.7% of the total taro imports. Rising demand from North America and Asia-Pacific countries is driving taro production. In 2021, taro production was 12.3 million tons. This was which is slightly declined compared to the previous year's production which is 12.6 million metric ton due to the pandemic effect in the world.
Taro Market Trends
Strong Growth in Taro Production
Taro is a great source of carbohydrate used in infant weaning diets and low glycaemic index foods suitable for diabetics. Its tuber has starch molecules which are smaller than those of potato, corn and wheat and can be used in cosmetics and in pharmaceuticals as binders in tablets. Both corms and leaves contain good-quality protein and are good sources of phosphorus, potassium, calcium, and readily available iron. Moreover, the starch in taro's tuber has the capacity to end the world's plastic menace and it can be used to make plastic that degenerates over time. Due to its nutritional benefit and other industrial, the demand for the taro is increasing across the globe. To satisfy the rising demand, farmers are increasing the area cultivated under taro.
According to FAOSTAT, taro production was 12.3 million ton which slightly declined compared to the previous year's production which is 12.6 million metric ton due to the pandemic effect in the world. During the same year, nearly 86.3% of global production was dominated by major producing countries such as China, Ecuador, Costa Rica, Fiji, and Indonesia in which China showed the highest production value compared to all countries with 1.9 million metric ton followed by Fiji. This will boost the taro market in the Asia region during the forecasting period.
North America Dominates the Global Imports
North America is the largest market for Taro which dominates globally due to the high consumer demand. In restaurants, Taro root is most commonly used to make chips and is a healthier alternative to corn or potato chips. According to ITC Trade, in 2021, Global import value was valued at USD 181,258 thousand, which increased by 21% compared to 2020. In 2021, the United States and Canada were among the major importing countries, and the United States is the largest importer of taro in the North American region.
In 2021, the United States imported taros worth USD 64,674 thousand, depicting 35.9% of the global imports. Ecuador, Mexico, and Costa Rica are the major exporting countries to the United States. According to ITC Trade, in 2021, Ecuador exported USD 35,309 thousand worth of taros to the United States, Mexico exported USD 9,021 thousand worth of taros, and the exports from Costa Rica were valued at USD 7,336 thousand.
Moreover, the high nutritional value of cocoyam could be explored in new markets in Europe and the United States of America to substitute for other vegetables, such as spinach. This is expected to lead to the market growth over the forecast period.
Taro Industry Overview
Additional Benefits:
- The market estimate (ME) sheet in Excel format
- 3 months of analyst support
TABLE OF CONTENTS
1 INTRODUCTION
- 1.1 Study Assumptions & Market Definitions
- 1.2 Scope of the Study
2 RESEARCH METHODOLOGY
3 EXECUTIVE SUMMARY
4 MARKET DYNAMICS
- 4.1 Market Overview
- 4.2 Market Drivers
- 4.3 Market Restraints
- 4.4 Value Chain Analysis
5 MARKET SEGMENTATION
- 5.1 Geography
- 5.1.1 North America
- 5.1.1.1 United States
- 5.1.1.1.1 Production Analysis
- 5.1.1.1.2 Consumption Analysis and Market Value
- 5.1.1.1.3 Import Market Analysis (Volume and Value)
- 5.1.1.1.4 Export Market Analysis (Volume and Value)
- 5.1.1.1.5 Price Trend Analysis
- 5.1.1.2 Canada
- 5.1.1.2.1 Production Analysis
- 5.1.1.2.2 Consumption Analysis and Market Value
- 5.1.1.2.3 Import Market Analysis (Volume and Value)
- 5.1.1.2.4 Export Market Analysis (Volume and Value)
- 5.1.1.2.5 Price Trend Analysis
- 5.1.2 Europe
- 5.1.2.1 France
- 5.1.2.1.1 Production Analysis
- 5.1.2.1.2 Consumption Analysis and Market Value
- 5.1.2.1.3 Import Market Analysis (Volume and Value)
- 5.1.2.1.4 Export Market Analysis (Volume and Value)
- 5.1.2.1.5 Price Trend Analysis
- 5.1.2.2 Germany
- 5.1.2.2.1 Production Analysis
- 5.1.2.2.2 Consumption Analysis and Market Value
- 5.1.2.2.3 Import Market Analysis (Volume and Value)
- 5.1.2.2.4 Export Market Analysis (Volume and Value)
- 5.1.2.2.5 Price Trend Analysis
- 5.1.2.3 Poland
- 5.1.2.3.1 Production Analysis
- 5.1.2.3.2 Consumption Analysis and Market Value
- 5.1.2.3.3 Import Market Analysis (Volume and Value)
- 5.1.2.3.4 Export Market Analysis (Volume and Value)
- 5.1.2.3.5 Price Trend Analysis
- 5.1.2.4 Russia
- 5.1.2.4.1 Production Analysis
- 5.1.2.4.2 Consumption Analysis and Market Value
- 5.1.2.4.3 Import Market Analysis (Volume and Value)
- 5.1.2.4.4 Export Market Analysis (Volume and Value)
- 5.1.2.4.5 Price Trend Analysis
- 5.1.2.5 Chile
- 5.1.2.5.1 Production Analysis
- 5.1.2.5.2 Consumption Analysis and Market Value
- 5.1.2.5.3 Import Market Analysis (Volume and Value)
- 5.1.2.5.4 Export Market Analysis (Volume and Value)
- 5.1.2.5.5 Price Trend Analysis
- 5.1.3 Asia-Pacific
- 5.1.3.1 China
- 5.1.3.1.1 Production Analysis
- 5.1.3.1.2 Consumption Analysis and Market Value
- 5.1.3.1.3 Import Market Analysis (Volume and Value)
- 5.1.3.1.4 Export Market Analysis (Volume and Value)
- 5.1.3.1.5 Price Trend Analysis
- 5.1.3.2 Japan
- 5.1.3.2.1 Production Analysis
- 5.1.3.2.2 Consumption Analysis and Market Value
- 5.1.3.2.3 Import Market Analysis (Volume and Value)
- 5.1.3.2.4 Export Market Analysis (Volume and Value)
- 5.1.3.2.5 Price Trend Analysis
- 5.1.3.3 Malaysia
- 5.1.3.3.1 Production Analysis
- 5.1.3.3.2 Consumption Analysis and Market Value
- 5.1.3.3.3 Import Market Analysis (Volume and Value)
- 5.1.3.3.4 Export Market Analysis (Volume and Value)
- 5.1.3.3.5 Price Trend Analysis
- 5.1.3.4 Australia
- 5.1.3.4.1 Production Analysis
- 5.1.3.4.2 Consumption Analysis and Market Value
- 5.1.3.4.3 Import Market Analysis (Volume and Value)
- 5.1.3.4.4 Export Market Analysis (Volume and Value)
- 5.1.3.4.5 Price Trend Analysis
- 5.1.3.5 India
- 5.1.3.5.1 Production Analysis
- 5.1.3.5.2 Consumption Analysis and Market Value
- 5.1.3.5.3 Import Market Analysis (Volume and Value)
- 5.1.3.5.4 Export Market Analysis (Volume and Value)
- 5.1.3.5.5 Price Trend Analysis
- 5.1.4 South America
- 5.1.4.1 Brazil
- 5.1.4.1.1 Production Analysis
- 5.1.4.1.2 Consumption Analysis and Market Value
- 5.1.4.1.3 Import Market Analysis (Volume and Value)
- 5.1.4.1.4 Export Market Analysis (Volume and Value)
- 5.1.4.1.5 Price Trend Analysis
- 5.1.4.2 Argentina
- 5.1.4.2.1 Production Analysis
- 5.1.4.2.2 Consumption Analysis and Market Value
- 5.1.4.2.3 Import Market Analysis (Volume and Value)
- 5.1.4.2.4 Export Market Analysis (Volume and Value)
- 5.1.4.2.5 Price Trend Analysis
- 5.1.5 Middle East And Africa
- 5.1.5.1 Turkey
- 5.1.5.1.1 Production Analysis
- 5.1.5.1.2 Consumption Analysis and Market Value
- 5.1.5.1.3 Import Market Analysis (Volume and Value)
- 5.1.5.1.4 Export Market Analysis (Volume and Value)
- 5.1.5.1.5 Price Trend Analysis
- 5.1.5.2 South Africa
- 5.1.5.2.1 Production Analysis
- 5.1.5.2.2 Consumption Analysis and Market Value
- 5.1.5.2.3 Import Market Analysis (Volume and Value)
- 5.1.5.2.4 Export Market Analysis (Volume and Value)
- 5.1.5.2.5 Price Trend Analysis
- 5.1.1 North America