

 |
市場調查報告書
商品編碼
2152958
PFAS檢測市場:依產品類型、技術、應用和地區分類-全球預測至2031年PFAS Testing Market by Product Type, Technology, Application and Region - Global Forecast to 2031 |
||||||


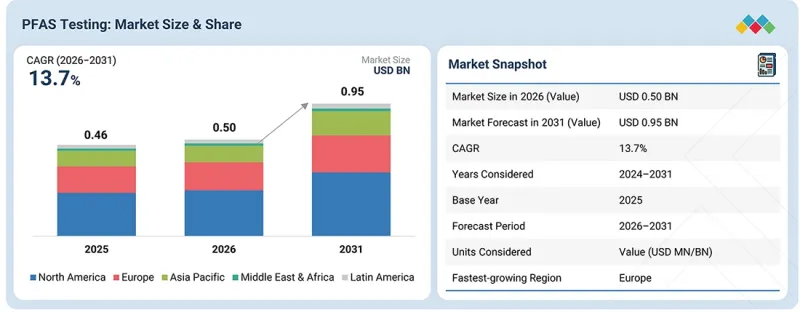
全球 PFAS 檢測市場預計將從 2026 年的 5 億美元成長到 2031 年的 9.5 億美元,2026 年至 2031 年的複合年成長率為 13.7%。
隨著檢測實驗室和監管機構擴大採用高靈敏度 LC-MS/MS、高解析度質譜 (HRMS)、自動化樣品製備系統和先進的層析法技術來滿足嚴格的檢測和合規性要求,該市場正在經歷強勁成長。
| 調查範圍 | |
|---|---|
| 調查期 | 2026-2031 |
| 基準年 | 2025 |
| 預測期 | 2026-2031 |
| 計算單位 | 金額(10億美元) |
| 部分 | 產品類型、技術、方法、應用和地區 |
| 目標區域 | 北美、歐洲、亞太地區、拉丁美洲、中東和非洲 |
隨著對更廣泛的 PFAS 檢測項目、新型 PFAS 化合物以及飲用水、污水、土壤、沉積物、食品和工業樣品中微量污染分析的需求不斷成長,實驗室正在提升其分析能力。同時,自動化固相萃取 (SPE)、高通量檢測流程、PFAS 專用色譜管柱和耗材、污染控制解決方案以及整合資料分析軟體的應用,正在提高檢測效率、準確性、重現性和檢查室處理能力。這些技術進步,加上監管監測和環境修復活動的不斷擴展,預計將支持持續投資並推動全球 PFAS 檢測市場的成長。
“到2025年,設備領域將佔據最大的市場佔有率。”
依產品類型分類,PFAS檢測市場可細分為儀器(液相層析法-質譜聯用儀 (LC-MS)、氣相層析法質譜儀 (GC-MS)、獨立質譜儀、核磁共振波譜儀及其他儀器)、耗材(樣品製備產品、層析管柱、參考物質和分析標準品、溶劑膜過濾器及其他儀器)、耗材(樣品製備產品、層析管柱、參考物質和分析標準品、溶劑膜過濾器及其他儀器)以及軟體包裝器和軟體劑。預計到2025年,儀器部分將佔據PFAS檢測市場最大的佔有率。分析儀器是主要的成長要素,這得益於高靈敏度LC-MS/MS和高解析度質譜 (HRMS) 在微量檢測和更廣泛的PFAS分析中的日益普及。雖然LC-MS/MS仍然是常規標靶分析和法規遵循的主要平台,但HRMS在疑似和非標靶篩檢新型PFAS化合物方面正日益受到關注。為了提高處理能力、重現性和數據質量,實驗室擴大採用自動化固相萃取 (SPE)、高通量樣品製備系統、直接進樣工作流程以及專門針對 PFAS 的污染控制組件。同時,儀器製造商正致力於提高靈敏度、加快分析速度、拓寬分析物範圍並增強自動化程度,以滿足飲用水和環境監測日益嚴格的要求。
“到2025年,液相層析法串聯式質譜質譜(LC-MS/MS)領域將佔據最大的市場佔有率。”
從分析方法來看,PFAS檢測市場可分為液相層析法-串聯式質譜質譜法(LC-MS/MS)、氣相層析法質譜法(GC-MS)、核磁共振波譜法(NMR)、質譜法、燃燒離子層析法、酵素免疫分析法(ELISA)等方法。預計到2025年,液相層析法-串聯式質譜質譜法(LC-MS/MS)將佔據PFAS檢測市場最大的佔有率。層析法層析串聯式質譜質譜法(LC-MS/MS)憑藉其高靈敏度和選擇性,以及能夠定量分析複雜環境基質中微量和超痕量PFAS的能力,在PFAS檢測市場中呈現強勁成長勢頭。近期監管政策的調整進一步推動了市場需求。美國環保署(EPA)的分析方法533和537.1採用了液相層析-串聯質譜(LC-MS/MS)技術進行飲用水分析,而分析方法1633A則將LC-MS/MS應用於污水、地表水、地下水、土壤、生物固形物、沉積物、掩埋滲濾液和組織樣本中40種全氟烷基(PFAS)的物質。為了滿足更廣泛的PFAS檢測需求和四極的檢測要求,各實驗室正在升級到具有更高靈敏度、多重反應監測(MRM)、同位素稀釋工作流程、自動化樣品製備和高通量能力的先進三重四極桿LC-MS/MS系統。同時,儘管在疑似新型PFAS和非標靶篩檢中,高解析度質譜(HRMS)正日益成為LC-MS/MS的補充,但LC-MS/MS仍然是常規標靶定量和法規遵從性檢測的主要平台。
“預計在預測期內,水質檢測應用領域將錄得最高的複合年成長率。”
按應用領域分類,PFAS檢測市場可細分為水質檢測(包括地下水和飲用水檢測、污水檢測)、土壤檢測、食品飲料檢測、血液和血清檢測、空氣監測、微生物檢測以及其他應用。預計到2025年,水質檢測領域將佔據PFAS檢測市場最大的佔有率。在PFAS檢測市場中,水質檢測正經歷強勁成長。這主要得益於人們對飲用水、地下水、地表水和污水中PFAS污染日益成長的關注,以及更嚴格的監管要求和不斷擴大的監測項目。在美國,EPA方法533和537.1允許檢測實驗室測量飲用水中的29種PFAS,而EPA方法1633A則將檢測範圍擴大到污水和其他環境基質中的40種PFAS,從而增加了對高靈敏度和標準化分析流程的需求。在歐洲,2026年1月生效的PFAS-20法規也推動了飲用水中PFAS監測的普及。因此,檢測實驗室擴大採用液相層析串聯質譜(LC-MS/MS)、自動化固相萃取(SPE)、高通量樣品製備、PFAS專用色譜管柱以及污染控制方案,以實現更低的檢測極限、更廣泛的PFAS分析以及更高的檢測重複性。這些法規和技術進步表明,水質檢測將繼續作為PFAS檢測的主要應用領域而不斷發展。
“在預測期內,歐洲市場預計將呈現最高的成長率。”
在歐洲 PFAS 檢測市場,水質檢測領域正經歷強勁成長。這主要得益於更嚴格的監管要求、公眾對 PFAS 污染日益成長的認知,以及飲用水、地下水、地表水和工業污水系統性監測計畫的實施。德國正崛起為歐洲主要市場之一,這得益於其《飲用水條例》中引入的 PFAS基準值,其中包括自 2026 年起 PFAS-20 的基準值100 ng/L,以及自 2028 年起 PFAS-4 的基準值20 ng/L。此外,PFOA、PFOS、PFHxS 和更廣泛的 PFAS 類物質的檢測要求不斷提高,進一步推動了這一趨勢。同時,檢測實驗室正在採用液相層析串聯質譜 (LC-MS/MS)、自動化樣品製備、PFAS 專用耗材和低檢測極限工作流程,以實現微量分析。人們越來越關注工業場所、消防泡沫和受污染水源造成的污染,再加上歐洲各地不斷增加對水質監測和 PFAS 監管的力度,預計這將進一步增加整個歐洲大陸對 PFAS 水質檢測的需求。
本報告中提及的主要參與公司組成如下:
- 按公司類型分類:一級供應商 - 48%,二級供應商 - 36%,三級供應商 - 16%
- 依職位等級分類:C級主管 -10%,總監級主管 -14%,其他 -76%
- 依地區分類:北美 40%,歐洲 32%,亞太地區 20%,拉丁美洲 5%,中東和非洲 3%
調查範圍
本報告按產品類型、技術、方法、應用和地區分析了 PFAS 檢測市場。報告還涵蓋了影響市場成長的因素,分析了機會和挑戰,並提供了領導企業競爭格局的詳細資訊。此外,報告也分析了各細分市場的成長趨勢,並對五大主要地區(以及這些地區內的各個國家)的市場細分進行了收入預測。
購買本報告的理由
本報告為市場領導和新參與企業提供最準確的 PFAS 檢測市場及其細分市場整體收入估算。這有助於相關人員了解競爭格局,更有效地進行業務定位,並獲得制定合適打入市場策略所需的洞察。此外,本報告還有助於相關人員掌握市場趨勢,並提供關鍵市場促進因素、挑戰和機會的資訊。
本報告深入分析了以下幾點:
- 分析影響 PFAS 檢測市場成長的關鍵市場促進因素(飲用水和環境樣品中 PFAS 污染監管法規的日益實施)、阻礙因素(LC-MS/MS 等先進分析儀器和相關檢測耗材的高成本)、機遇(PFAS 檢測和環境監測計劃資金的增加)以及挑戰(各國和各地區缺乏統一的 PFAS 檢測統一的 PFAS)。
- 產品開發與創新:深入了解 PFAS 檢測市場的未來技術、研發活動以及新產品/服務的推出。
- 市場趨勢:這份全面的 PFAS 檢測市場報告分析了各地區的 PFAS 檢測市場。
- 市場多元化:全面介紹 PFAS 檢測市場的新產品和服務、未開發的地區、近期趨勢和投資情況。
- 競爭分析:對主要公司的市場佔有率、成長策略和服務產品進行詳細評估。
目錄
第1章:引言
第2章執行摘要
第3章重要考察
- PFAS檢測市場概覽
- PFAS檢測市場:依產品類型分類,2026年與2031年比較
- PFAS檢測市場:依產品類型和地區分類,2025年
- PFAS檢測市場:區域成長機會
- 區域細分:PFAS檢測市場,2024-2031年
第4章 市場概覽
- 市場動態
- 促進因素
- 抑制因子
- 機會
- 任務
第5章 產業趨勢
- 波特五力分析
- 競爭公司之間的競爭
- 供應商的議價能力
- 買方的議價能力
- 替代品的威脅
- 新進入者的威脅
- 宏觀經濟展望
- GDP趨勢與預測
- 全球 PFAS 檢測市場趨勢
- 價值鏈分析
- 研究與開發
- 原物料採購
- 製造業
- 分配
- 行銷與銷售
- 售後服務
- 生態系分析
- 價格分析
- 主要製造商生產的液相層析質譜聯用儀平均銷售價格趨勢(2025 年)
- 2025年PFAS分析儀平均售價趨勢(依類型分列)
- 各地區平均售價趨勢(2023-2025 年)
- 貿易數據分析
- HS編碼390460的進口數據
- HS編碼390460的出口數據
- 重大會議和活動(2026-2027)
- 影響客戶業務的趨勢和變化
- 投資和資金籌措場景
- 案例研究分析
- 開發用於飲用水的高靈敏度 PFAS 檢測能力
- 飲用水中 PFAS 的大規模監測
- 擴大污水和生物固形物中 PFAS 分析的範圍
- 美國關稅對 PFAS 檢測市場的影響
- 主要關稅稅率
- 價格影響分析
- 對國家和地區的影響
- 對最終用戶的影響
第6章:透過採用技術、專利和人工智慧實現策略轉型
- 主要技術
- 層析法
- 質譜分析
- 離子層析法
- 互補技術
- 總有機氟(TOF)分析
- 人工智慧影像處理和診斷軟體
- 相關技術
- 環境監測技術
- 水處理和過濾技術
- 專利分析
- 人工智慧/生成式人工智慧對 PFAS 檢測市場的影響
- 主要應用場景和市場潛力
- PFAS檢測市場企業的最佳實踐
- 人工智慧/生成式人工智慧在 PFAS 檢測市場引入的案例研究
- 相互關聯的生態系統及其對市場參與者的影響
- PFAS檢測市場中客戶對人工智慧/基因工程人工智慧應用的準備情況
- 成功案例和實際應用
第7章 監理情勢
- 監管情景
- 監理情勢
- 監管指南
第8章:顧客趨勢與購買行為
- 決策流程
- 買方相關人員和採購評估標準
- 採購過程中的關鍵相關人員
- 主要購買標準
- 實施障礙和內部挑戰
- 來自不同終端使用者的未滿足需求
第9章 PFAS 檢測市場:依產品類型分類
- 測量設備
- 消耗品
- 軟體和服務
第10章 PFAS檢測市場:依技術分類
- 液相層析法串聯式質譜質譜法(LC-MS/MS)
- 氣相層析層析法聯用(GC-MS)
- 核磁共振波譜(NMR波譜)
- 質譜分析
- 燃燒離子層析法
- 酵素免疫分析法(ELISA)
- 其他方法
第11章 PFAS 檢測市場:依檢測方法分類
- EPA
- DIN
- ISO
- ASTM
- 其他方法
第12章 PFAS 檢測市場:依應用領域分類
- 水質檢測
- 土壤檢測
- 食品和飲料檢測
- 血液和血清檢測
- 大氣監測
- 微生物檢測
- 其他用途
第13章 PFAS檢測市場:按地區分類
- 北美洲
- 北美宏觀經濟展望
- 美國
- 加拿大
- 歐洲
- 歐洲宏觀經濟展望
- 德國
- 英國
- 法國
- 義大利
- 西班牙
- 其他歐洲國家
- 亞太地區
- 亞太地區宏觀經濟展望
- 日本
- 中國
- 印度
- 澳洲
- 韓國
- 亞太其他地區
- 拉丁美洲
- 拉丁美洲宏觀經濟展望
- 巴西
- 墨西哥
- 其他拉丁美洲
- 中東和非洲
- 中東和非洲宏觀經濟展望
- 海灣合作理事會國家
- 其他中東和非洲地區
第14章 競爭格局
- 主要參與企業的策略/優勢
- PFAS檢測市場主要參與者策略概述
- 收入分析(2022-2025)
- 市佔率分析(2025 年)
- 市場排名分析(2025 年)
- 企業估值矩陣:主要公司,2025 年
- 明星公司
- 新興領導者
- 企業發展範圍廣泛的公司
- 參與企業
- 企業企業發展:主要公司,2025 年
- 公司估值矩陣:新創企業/中小企業,2025 年
- 先進公司
- 應對力的公司
- 充滿活力的公司
- 起始點
- 2025年初創企業/中小企業競爭標竿分析
- 競爭格局
- 產品發布
- 交易
- 業務拓展
- 企業估值和財務指標
- 品牌和產品對比
第15章:公司簡介
- 大公司
- AGILENT TECHNOLOGIES, INC.
- DANAHER CORPORATION
- WATERS CORPORATION
- THERMO FISHER SCIENTIFIC INC.
- SHIMADZU CORPORATION
- MERCK KGAA
- PERKINELMER INC.
- LGC LIMITED
- BIOTAGE
- MACHEREY-NAGEL GMBH &CO. KG
- ACCUSTANDARD
- WELLINGTON LABORATORIES INC.
- CAMBRIDGE ISOTOPE LABORATORIES, INC.
- CHIRON AS
- METROHM INULA GMBH
- 其他公司
- RESTEK CORPORATION
- MICROSAIC
- EVONIK
- LCTECH
- ABSOLUTE STANDARDS INC.
- CYTIVA
- AVANTOR, INC.
- GREYHOUND CHROMATOGRAPHY AND ALLIED CHEMICALS LTD.
- LANXESS
- THE CHEMOURS COMPANY
第16章調查方法
第17章附錄
The global PFAS testing market is projected to reach USD 0.95 billion by 2031, up from USD 0.50 billion in 2026, reflecting a 13.7% CAGR from 2026 to 2031. The market is experiencing strong growth as laboratories and regulatory agencies increasingly adopt high-sensitivity LC-MS/MS, high-resolution mass spectrometry (HRMS), automated sample-preparation systems, and advanced chromatography technologies to meet stringent detection and compliance requirements.
| Scope of the Report | |
|---|---|
| Years Considered for the Study | 2026-2031 |
| Base Year | 2025 |
| Forecast Period | 2026-2031 |
| Units Considered | Value (USD billion) |
| Segments | Product Type, Techniques, Method, Application, and Region |
| Regions covered | North America, Europe, Asia Pacific, Latin America, and Middle East and Africa |
Growing demand for broader PFAS panels, emerging PFAS compounds, and trace-level contamination analysis across drinking water, wastewater, soil, sediment, food, and industrial samples is prompting laboratories to upgrade their analytical capabilities. In parallel, adoption of automated solid-phase extraction (SPE), high-throughput testing workflows, PFAS-specific columns and consumables, contamination-control solutions, and integrated data-analysis software is improving testing efficiency, accuracy, reproducibility, and laboratory throughput. These technological advancements, combined with expanding regulatory monitoring and environmental remediation activities, are expected to support continued investment and drive growth in the global PFAS testing market.
"The instruments segment held the largest share of the market in 2025"
By product type, the PFAS testing market is segmented into instruments (liquid chromatography-mass spectrometry (LC-MS), gas chromatography-mass spectrometry (GC-MS), standalone mass spectrometry, nuclear magnetic resonance spectroscopy, other instruments), consumables (sample preparation products, chromatography columns, reference materials & analytical standards, solvents, membrane & syringe filters, reagents, other consumables), and software & services. The instruments segment held the largest share of the PFAS testing market in 2025. Instruments are a major growth driver, supported by the increasing adoption of high-sensitivity LC-MS/MS and high-resolution mass spectrometry (HRMS) for ultra-trace detection and broader PFAS panels. LC-MS/MS remains the dominant platform for routine targeted analysis and regulatory compliance, while HRMS is gaining traction for suspect and non-targeted screening of emerging PFAS compounds. Laboratories are increasingly adopting automated solid-phase extraction (SPE), high-throughput sample-preparation systems, direct-injection workflows, and PFAS-specific contamination-control components to improve throughput, reproducibility, and data quality. At the same time, instrument manufacturers are focusing on higher sensitivity, faster analysis, broader analyte coverage, and improved automation to address stricter drinking-water and environmental monitoring requirements.
"The liquid chromatography with tandem mass spectrometry (LC-MS/MS) segment held the largest share of the market in 2025"
By technique, the PFAS testing market is segmented into liquid chromatography with tandem mass spectrometry (LC-MS/MS), gas chromatography-mass spectrometry (GC-MS), nuclear magnetic resonance spectroscopy (NMR), mass spectrometry, combustion ion chromatography, enzyme-linked immunosorbent assays (ELISA), and other techniques. The liquid chromatography with tandem mass spectrometry (LC-MS/MS) segment held the largest share of the PFAS testing market in 2025. The liquid chromatography-tandem mass spectrometry (LC-MS/MS) technique is experiencing strong growth in the PFAS testing market, driven by its high sensitivity, selectivity, and ability to quantify PFAS at trace and ultra-trace concentrations across complex environmental matrices. Recent regulatory developments are further strengthening demand, with EPA Methods 533 and 537.1 using LC-MS/MS for drinking-water analysis and Method 1633A applying LC-MS/MS to 40 PFAS across wastewater, surface water, groundwater, soil, biosolids, sediment, landfill leachate, and tissue samples. Laboratories are increasingly upgrading to advanced triple-quadrupole LC-MS/MS systems with improved sensitivity, multiple-reaction monitoring, isotope-dilution workflows, automated sample preparation, and higher-throughput capabilities to support broader PFAS panels and stringent detection requirements. At the same time, LC-MS/MS is increasingly being complemented by HRMS for suspect and non-targeted screening of emerging PFAS, while LC-MS/MS remains a key platform for routine targeted quantification and regulatory compliance testing.
"The water testing application segment is projected to register the highest CAGR during the forecast period"
Based on application, the PFAS testing market is segmented into water testing (ground & potable water testing, wastewater testing), soil testing, food & beverage testing, blood/serum testing, air monitoring, microbial testing, and other applications. The water testing segment held the largest share of the PFAS testing market in 2025. Water testing is experiencing strong growth in the PFAS testing market, driven by rising concerns about PFAS contamination in drinking water, groundwater, surface water, and wastewater, along with tightening regulatory requirements and expanding monitoring programs. In the US, EPA Methods 533 and 537.1 enable laboratories to measure 29 PFAS in drinking water, while EPA Method 1633A expands testing to 40 PFAS across wastewater and other environmental matrices, increasing demand for sensitive, standardized analytical workflows. In Europe, PFAS-20 requirements, effective from January 2026, are also supporting broader monitoring of PFAS in drinking water. As a result, laboratories are increasingly adopting LC-MS/MS, automated SPE, high-throughput sample preparation, PFAS-specific columns, and contamination-control solutions to achieve lower detection limits, analyze broader PFAS panels, and improve testing reproducibility. These regulatory and technological developments are expected to sustain water testing as a key application area for PFAS testing.
"The market in Europe is expected to witness the highest growth during the forecast period."
The water testing application is witnessing strong growth in the European PFAS testing market, driven by tightening regulatory requirements, increasing awareness of PFAS contamination, and the implementation of systematic monitoring programs for drinking water, groundwater, surface water, and industrial wastewater. Germany is emerging as a key market within Europe, supported by the implementation of PFAS limits under its Drinking Water Ordinance, including a 100 ng/L limit for PFAS-20 from 2026 and an additional 20 ng/L limit for PFAS-4 from 2028. The trend is further supported by increasing testing requirements for PFOA, PFOS, PFHxS, and broader PFAS groups, while laboratories are adopting LC-MS/MS, automated sample preparation, PFAS-specific consumables, and low-detection-limit workflows to enable trace-level analysis. Growing concerns around contamination from industrial sites, firefighting-foam applications, and contaminated water sources, together with expanding European water-quality monitoring and PFAS regulatory initiatives, are expected to further increase demand for PFAS water testing across Europe.
A breakdown of the primary participants referred to for this report is provided below:
- By Company Type: Tier 1-48%, Tier 2-36%, and Tier 3- 16%
- By Designation: C-level-10%, Director-level-14%, and Others-76%
- By Region: North America-40%, Europe-32%, Asia Pacific-20%, Latin America-5%, and the Middle East & Africa-3%
The prominent players in the PFAS testing market are Thermo Fisher Scientific Inc. (US), Danaher Corporation (US), Merck Kgaa (Germany), Shimadzu Corporation (Japan), among others.
Research Coverage
This report studies the PFAS testing market by product type, techniques, methods, applications, and region. It also covers the factors affecting market growth, analyzes the opportunities and challenges in the market, and provides details of the competitive landscape for market leaders. Furthermore, the report analyzes micromarkets with respect to their growth trends and forecasts the revenue of the market segments with respect to five main regions (and the respective countries in these regions).
Reasons to Buy the Report
The report will provide market leaders and new entrants with the closest approximations of revenue for the overall PFAS testing market and its subsegments. It will help stakeholders understand the competitive landscape and gain insights to position their businesses more effectively and plan suitable go-to-market strategies. The report also helps stakeholders understand the market pulse and provides information on key market drivers, restraints, challenges, and opportunities.
This report provides insights on the following pointers:
- Analysis of key drivers (Increasing implementation of regulations governing PFAS contamination in drinking water and environmental samples), restraints (High cost of advanced analytical instruments, such as LC-MS/MS, and associated testing consumables), opportunities (Increasing funding for PFAS testing and environmental monitoring programs), and challenges (Lack of harmonized PFAS testing standards and regulatory requirements across countries and regions) influencing the growth of the PFAS testing market
- Product Development/Innovation: Detailed insights on upcoming technologies, research & development activities, and new product & service launches in the PFAS testing market
- Market Development: Comprehensive information about PFAS testing market report analyses the PFAS testing market across varied regions
- Market Diversification: Exhaustive information about new products & services, untapped geographies, recent developments, and investments in the PFAS testing market
- Competitive Assessment: In-depth assessment of market shares, growth strategies, and service offerings of leading players like Thermo Fisher Scientific Inc. (US), Danaher Corporation (US), Agilent Technologies, Inc. (US), Waters Corporation (US), Shimadzu Corporation (Japan), among others.
TABLE OF CONTENTS
1 INTRODUCTION
- 1.1 STUDY OBJECTIVES
- 1.2 MARKET DEFINITION
- 1.3 STUDY SCOPE
- 1.3.1 MARKETS COVERED AND REGIONAL SCOPE
- 1.3.2 INCLUSIONS & EXCLUSIONS
- 1.3.3 YEARS CONSIDERED
- 1.3.4 CURRENCY CONSIDERED
- 1.4 STAKEHOLDERS
- 1.5 SUMMARY OF CHANGES
2 EXECUTIVE SUMMARY
- 2.1 MARKET HIGHLIGHTS AND KEY INSIGHTS
- 2.2 DISRUPTIVE TRENDS IN PFAS TESTING MARKET
- 2.3 HIGH GROWTH SEGMENTS
- 2.4 REGIONAL SNAPSHOT: MARKET SIZE, GROWTH RATE, AND FORECAST
3 PREMIUM INSIGHTS
- 3.1 PFAS TESTING MARKET OVERVIEW
- 3.2 PFAS TESTING MARKET, BY PRODUCT TYPE, 2026 VS. 2031 (USD MILLION)
- 3.3 PFAS TESTING MARKET, BY PRODUCT TYPE & REGION (2025)
- 3.4 PFAS TESTING MARKET: GEOGRAPHIC GROWTH OPPORTUNITIES
- 3.5 REGIONAL MIX: PFAS TESTING MARKET, 2024-2031 (USD MILLION)
4 MARKET OVERVIEW
- 4.1 INTRODUCTION
- 4.2 MARKET DYNAMICS
- 4.2.1 DRIVERS
- 4.2.1.1 Regulatory reforms addressing environmental pollution
- 4.2.1.2 Growing concerns over PFAS contamination in water
- 4.2.1.3 Favorable investment climate driving improvements in testing
- 4.2.1.4 Increasing financial support for wastewater treatment projects and programs
- 4.2.2 RESTRAINTS
- 4.2.2.1 Limited adoption due to high cost of consumables and maintenance of MS instruments
- 4.2.2.2 Strict storage requirements for PFAS testing reagents and analytical standards
- 4.2.3 OPPORTUNITIES
- 4.2.3.1 Growth opportunities presented by major markets
- 4.2.3.2 Growing financial support for treatment projects and programs
- 4.2.3.3 Higher public awareness regarding pollution levels
- 4.2.4 CHALLENGES
- 4.2.4.1 Lack of standardized testing methods across regions
- 4.2.4.2 Limited availability of skilled labor
- 4.2.1 DRIVERS
5 INDUSTRY TRENDS
- 5.1 PORTER'S FIVE FORCES ANALYSIS
- 5.1.1 INTENSITY OF COMPETITIVE RIVALRY
- 5.1.2 BARGAINING POWER OF SUPPLIERS
- 5.1.3 BARGAINING POWER OF BUYERS
- 5.1.4 THREAT OF SUBSTITUTES
- 5.1.5 THREAT OF NEW ENTRANTS
- 5.2 MACROECONOMIC OUTLOOK
- 5.2.1 INTRODUCTION
- 5.2.2 GDP TRENDS AND FORECAST
- 5.2.3 TRENDS IN GLOBAL PFAS TESTING MARKET
- 5.2.3.1 Growing adoption of advanced LC-MS/MS technologies
- 5.2.3.2 Increasing adoption of HRMS for emerging PFAS analysis
- 5.2.3.3 Growing automation of PFAS sample preparation
- 5.2.3.4 Expansion of PFAS testing across multiple sample matrices
- 5.2.3.5 Increasing demand for broader PFAS testing panels
- 5.3 VALUE CHAIN ANALYSIS
- 5.3.1 RESEARCH & DEVELOPMENT
- 5.3.2 RAW MATERIAL PROCUREMENT
- 5.3.3 MANUFACTURING
- 5.3.4 DISTRIBUTION
- 5.3.5 MARKETING & SALES
- 5.3.6 POST-SALES SERVICES
- 5.4 ECOSYSTEM ANALYSIS
- 5.5 PRICING ANALYSIS
- 5.5.1 AVERAGE SELLING PRICE TREND OF LC-MS INSTRUMENTS, BY KEY PLAYER, 2025
- 5.5.2 AVERAGE SELLING PRICE TREND OF PFAS INSTRUMENTS, BY TYPE, 2025
- 5.5.3 AVERAGE SELLING PRICE TREND, BY REGION, 2023-2025
- 5.6 TRADE DATA ANALYSIS
- 5.6.1 IMPORT DATA FOR HS CODE 390460
- 5.6.2 EXPORT DATA FOR HS CODE 390460
- 5.7 KEY CONFERENCES & EVENTS, 2026-2027
- 5.8 TRENDS/DISRUPTIONS IMPACTING CUSTOMER BUSINESS
- 5.9 INVESTMENT & FUNDING SCENARIO
- 5.10 CASE STUDY ANALYSIS
- 5.10.1 BUILDING HIGH-SENSITIVITY PFAS TESTING CAPABILITY FOR DRINKING WATER
- 5.10.2 LARGE-SCALE PFAS MONITORING IN DRINKING WATER
- 5.10.3 EXPANDING PFAS ANALYSIS IN WASTEWATER AND BIOSOLIDS
- 5.11 IMPACT OF US TARIFF - PFAS TESTING MARKET
- 5.11.1 INTRODUCTION
- 5.11.2 KEY TARIFF RATES
- 5.11.3 PRICE IMPACT ANALYSIS
- 5.11.4 IMPACT ON COUNTRIES/REGIONS
- 5.11.4.1 US
- 5.11.4.2 Europe
- 5.11.4.3 Asia Pacific
- 5.11.5 IMPACT ON END USERS
6 STRATEGIC DISRUPTION THROUGH TECHNOLOGY, PATENTS, AND AI ADOPTION
- 6.1 KEY TECHNOLOGIES
- 6.1.1 CHROMATOGRAPHY
- 6.1.2 MASS SPECTROMETRY
- 6.1.3 ION CHROMATOGRAPHY
- 6.2 COMPLEMENTARY TECHNOLOGIES
- 6.2.1 TOTAL ORGANIC FLUORINE (TOF) ANALYSIS
- 6.2.2 AI-BASED IMAGE PROCESSING AND DIAGNOSTIC SOFTWARE
- 6.3 ADJACENT TECHNOLOGIES
- 6.3.1 ENVIRONMENTAL MONITORING TECHNOLOGIES
- 6.3.2 WATER TREATMENT AND FILTRATION TECHNOLOGIES
- 6.4 PATENT ANALYSIS
- 6.5 IMPACT OF AI/GEN AI ON PFAS TESTING MARKET
- 6.5.1 TOP USE CASES AND MARKET POTENTIAL
- 6.5.2 BEST PRACTICES FOLLOWED BY COMPANIES IN PFAS TESTING MARKET
- 6.5.3 CASE STUDIES RELATED TO AI/GEN AI IMPLEMENTATION IN PFAS TESTING MARKET
- 6.5.4 INTERCONNECTED ECOSYSTEM AND IMPACT ON MARKET PLAYERS
- 6.5.5 CLIENT'S READINESS TO ADOPT AI/GEN AI IN PFAS TESTING MARKET
- 6.6 SUCCESS STORIES AND REAL-WORLD APPLICATIONS
7 REGULATORY LANDSCAPE
- 7.1 REGULATORY SCENARIO
- 7.1.1 REGULATORY LANDSCAPE
- 7.1.2 REGULATORY GUIDELINES
- 7.1.2.1 North America
- 7.1.2.1.1 US
- 7.1.2.1.1.1 Water quality guidelines
- 7.1.2.1.1.2 Air quality guidelines
- 7.1.2.1.1.3 Food quality guidelines
- 7.1.2.1.2 Canada
- 7.1.2.1.2.1 Water quality guidelines
- 7.1.2.1.2.2 Air quality guidelines
- 7.1.2.1.2.3 Food quality guidelines
- 7.1.2.1.1 US
- 7.1.2.2 Europe
- 7.1.2.2.1 UK
- 7.1.2.2.1.1 Water quality guidelines
- 7.1.2.2.1.2 Air quality guidelines
- 7.1.2.2.1.3 Food quality guidelines
- 7.1.2.2.2 France
- 7.1.2.2.2.1 Water quality guidelines
- 7.1.2.2.2.2 Air quality guidelines
- 7.1.2.2.2.3 Food quality guidelines
- 7.1.2.2.3 Germany
- 7.1.2.2.3.1 Water quality guidelines
- 7.1.2.2.3.2 Air quality guidelines
- 7.1.2.2.3.3 Food quality guidelines
- 7.1.2.2.1 UK
- 7.1.2.3 Asia Pacific
- 7.1.2.3.1 China
- 7.1.2.3.1.1 Water quality guidelines
- 7.1.2.3.1.2 Air quality guidelines
- 7.1.2.3.1.3 Food quality guidelines
- 7.1.2.3.2 Japan
- 7.1.2.3.2.1 Water quality guidelines
- 7.1.2.3.2.2 Air quality guidelines
- 7.1.2.3.2.3 Food quality guidelines
- 7.1.2.3.3 India
- 7.1.2.3.3.1 Water quality guidelines
- 7.1.2.3.3.2 Air quality guidelines
- 7.1.2.3.3.3 Food quality guidelines
- 7.1.2.3.1 China
- 7.1.2.4 Latin America
- 7.1.2.4.1 Brazil
- 7.1.2.4.1.1 Water quality guidelines
- 7.1.2.4.1.2 Air quality guidelines
- 7.1.2.4.1.3 Food quality guidelines
- 7.1.2.4.1 Brazil
- 7.1.2.5 Middle East & Africa
- 7.1.2.5.1 UAE
- 7.1.2.5.1.1 Water quality guidelines
- 7.1.2.5.1.2 Air quality guidelines
- 7.1.2.5.1.3 Food quality guidelines
- 7.1.2.5.1 UAE
- 7.1.2.1 North America
8 CUSTOMER LANDSCAPE AND BUYER BEHAVIOR
- 8.1 DECISION MAKING PROCESS
- 8.2 BUYER STAKEHOLDERS & BUYING EVALUATION CRITERIA
- 8.2.1 KEY STAKEHOLDERS IN BUYING PROCESS
- 8.2.2 KEY BUYING CRITERIA
- 8.3 ADOPTION BARRIERS AND INTERNAL CHALLENGES
- 8.4 UNMET NEEDS FROM VARIOUS END USE CUSTOMERS
9 PFAS TESTING MARKET, BY PRODUCT TYPE
- 9.1 INTRODUCTION
- 9.2 INSTRUMENTS
- 9.2.1 LIQUID CHROMATOGRAPHY-MASS SPECTROMETRY (LC-MS)
- 9.2.1.1 Advancements in LC-MS to boost market
- 9.2.2 GAS CHROMATOGRAPHY-MASS SPECTROMETRY (GC-MS)
- 9.2.2.1 Strict regulations, environmental concerns, and rising demand for PFAS testing to drive segmental growth
- 9.2.3 STANDALONE MASS SPECTROMETRY
- 9.2.3.1 Stringent regulations to drive adoption of mass spectrometry
- 9.2.4 NUCLEAR MAGNETIC RESONANCE SPECTROSCOPY
- 9.2.4.1 Advancements in drug discovery and structural analysis to drive NMR instrument growth
- 9.2.5 OTHER INSTRUMENTS
- 9.2.1 LIQUID CHROMATOGRAPHY-MASS SPECTROMETRY (LC-MS)
- 9.3 CONSUMABLES
- 9.3.1 SAMPLE PREPARATION PRODUCTS
- 9.3.1.1 Rising demand for high-quality analytical results to drive growth of sample preparation products
- 9.3.2 CHROMATOGRAPHY COLUMNS
- 9.3.2.1 Increasing demand for high-performance separation in chromatography to drive market growth
- 9.3.3 REFERENCE MATERIALS & ANALYTICAL STANDARDS
- 9.3.3.1 Stringent regulatory standards and quality control requirements to drive propel growth
- 9.3.4 SOLVENTS
- 9.3.4.1 Growing demand for high-purity solvents in analytical testing to fuel growth
- 9.3.5 MEMBRANE & SYRINGE FILTERS
- 9.3.5.1 Increasing demand for sample purification and contamination control in laboratories to boost market
- 9.3.6 REAGENTS
- 9.3.6.1 Rising demand for high-quality reagents in research to favor growth
- 9.3.7 OTHER CONSUMABLES
- 9.3.1 SAMPLE PREPARATION PRODUCTS
- 9.4 SOFTWARE & SERVICES
10 PFAS TESTING MARKET, BY TECHNIQUE
- 10.1 INTRODUCTION
- 10.2 LIQUID CHROMATOGRAPHY WITH TANDEM MASS SPECTROMETRY (LC-MS/MS)
- 10.2.1 PREFERRED ANALYTICAL TECHNIQUE FOR DETECTION AND ANALYSIS OF PFAS COMPOUNDS TO DRIVE MARKET GROWTH
- 10.3 GAS CHROMATOGRAPHY-MASS SPECTROMETRY (GC-MS)
- 10.3.1 HIGH COST OF GC INSTRUMENTS AND CONSUMABLES TO LIMIT WIDESPREAD ADOPTION AMONG END USERS
- 10.4 NUCLEAR MAGNETIC RESONANCE SPECTROSCOPY (NMR SPECTROSCOPY)
- 10.4.1 DEMAND FOR HIGH-SPEED, ACCURATE, AND RELIABLE DETECTION CAPABILITIES TO FAVOR GROWTH
- 10.5 MASS SPECTROMETRY
- 10.5.1 AUTOMATED TECHNIQUES WITH MULTI-ANALYTE PFAS DETECTION CAPABILITIES TO CONTRIBUTE TO GROWTH
- 10.6 COMBUSTION ION CHROMATOGRAPHY
- 10.6.1 SHORTAGE OF TRAINED PROFESSIONALS TO OPERATE CHROMATOGRAPHY INSTRUMENTS TO RESTRAIN MARKET GROWTH
- 10.7 ENZYME-LINKED IMMUNOSORBENT ASSAYS (ELISA)
- 10.7.1 COST-EFFECTIVE SAMPLE PREPARATION AND USER-FRIENDLY METHODS TO DRIVE ADOPTION
- 10.8 OTHER TECHNIQUES
11 PFAS TESTING MARKET, BY METHOD
- 11.1 INTRODUCTION
- 11.2 EPA
- 11.2.1 GROWING NEED TO MONITOR AND LIMIT PFAS CONTAMINATION IN DRINKING WATER TO DRIVE MARKET GROWTH
- 11.3 DIN
- 11.3.1 GROWING CONCERNS ABOUT AIR AND WATER POLLUTION TO DRIVE MARKET GROWTH
- 11.4 ISO
- 11.4.1 INCREASING DISCHARGE OF INDUSTRIAL WASTEWATER AND EFFLUENTS TO BOOST GROWTH
- 11.5 ASTM
- 11.5.1 GOVERNMENT REGULATIONS AIMED AT CONTROLLING WATER POLLUTION TO FAVOR MARKET GROWTH
- 11.6 OTHER METHODS
12 PFAS TESTING MARKET, BY APPLICATION
- 12.1 INTRODUCTION
- 12.2 WATER TESTING
- 12.2.1 GROUND & POTABLE WATER TESTING
- 12.2.1.1 Rising demand for water quality testing driven by PFAS contamination to boost market
- 12.2.2 WASTEWATER TESTING
- 12.2.2.1 Rising demand for wastewater and irrigation water testing to propel market
- 12.2.1 GROUND & POTABLE WATER TESTING
- 12.3 SOIL TESTING
- 12.3.1 GROWING DEMAND FOR SOIL TESTING TO DRIVE MARKET GROWTH
- 12.4 FOOD & BEVERAGE TESTING
- 12.4.1 GROWING DEMAND FOR ADVANCED ANALYTICAL METHODS IN FOOD & BEVERAGE INDUSTRY TO FUEL GROWTH
- 12.5 BLOOD/SERUM TESTING
- 12.5.1 EFFORTS BY REGULATORY AGENCIES TO MONITOR AND RESTRICT PFAS CONTAMINATION TO CREATE OPPORTUNITIES
- 12.6 AIR MONITORING
- 12.6.1 COLLABORATIVE REGULATORY ACTIONS DRIVING ENVIRONMENTAL REMEDIATION TO AID GROWTH
- 12.7 MICROBIAL TESTING
- 12.7.1 GROWING RESEARCH FUNDING TO DRIVE GROWTH
- 12.8 OTHER APPLICATIONS
13 PFAS TESTING MARKET, BY REGION
- 13.1 INTRODUCTION
- 13.2 NORTH AMERICA
- 13.2.1 MACROECONOMIC OUTLOOK FOR NORTH AMERICA
- 13.2.2 US
- 13.2.2.1 US to dominate North American PFAS testing market
- 13.2.3 CANADA
- 13.2.3.1 Increasing government funding to drive adoption of PFAS testing instruments
- 13.3 EUROPE
- 13.3.1 MACROECONOMIC OUTLOOK FOR EUROPE
- 13.3.2 GERMANY
- 13.3.2.1 Germany to dominate market for PFAS testing in Europe
- 13.3.3 UK
- 13.3.3.1 Favorable funding & investment scenario to drive market growth.
- 13.3.4 FRANCE
- 13.3.4.1 Rising industrial contaminants & pollution drive market growth
- 13.3.5 ITALY
- 13.3.5.1 High levels of water pollution to offer growth opportunities
- 13.3.6 SPAIN
- 13.3.6.1 Strict food regulations and high agricultural imports to drive market growth in Spain
- 13.3.7 REST OF EUROPE
- 13.4 ASIA PACIFIC
- 13.4.1 MACROECONOMIC OUTLOOK FOR ASIA PACIFIC
- 13.4.2 JAPAN
- 13.4.2.1 Rising awareness about analytical technologies to support market growth
- 13.4.3 CHINA
- 13.4.3.1 Increasing R&D expenditure to drive market growth
- 13.4.4 INDIA
- 13.4.4.1 Rising funding programs to drive market
- 13.4.5 AUSTRALIA
- 13.4.5.1 Growing government regulation to support adoption and development of analytical technologies
- 13.4.6 SOUTH KOREA
- 13.4.6.1 Increasing alliances & investments in research to drive market
- 13.4.7 REST OF ASIA PACIFIC
- 13.5 LATIN AMERICA
- 13.5.1 MACROECONOMIC OUTLOOK FOR LATIN AMERICA
- 13.5.2 BRAZIL
- 13.5.2.1 Brazil to dominate Latin American market during forecast period
- 13.5.3 MEXICO
- 13.5.3.1 Strong pharmaceutical industry and increased government support to augment market
- 13.5.4 REST OF LATIN AMERICA
- 13.6 MIDDLE EAST & AFRICA
- 13.6.1 MACROECONOMIC OUTLOOK FOR MIDDLE EAST & AFRICA
- 13.6.2 GCC COUNTRIES
- 13.6.2.1 Lack of regulations for PFAS substances to restrict market growth
- 13.6.3 REST OF MIDDLE EAST & AFRICA
14 COMPETITIVE LANDSCAPE
- 14.1 INTRODUCTION
- 14.2 KEY PLAYER STRATEGIES/RIGHT TO WIN
- 14.2.1 OVERVIEW OF STRATEGIES ADOPTED BY PLAYERS IN PFAS TESTING MARKET
- 14.3 REVENUE ANALYSIS, 2022-2025
- 14.4 MARKET SHARE ANALYSIS, 2025
- 14.5 MARKET RANKING ANALYSIS, 2025
- 14.6 COMPANY EVALUATION MATRIX: KEY PLAYERS, 2025
- 14.6.1 STARS
- 14.6.2 EMERGING LEADERS
- 14.6.3 PERVASIVE PLAYERS
- 14.6.4 PARTICIPANTS
- 14.6.5 COMPANY FOOTPRINT: KEY PLAYERS, 2025
- 14.6.5.1 Company footprint
- 14.6.5.2 Region footprint
- 14.6.5.3 Product type footprint
- 14.6.5.4 Technique footprint
- 14.6.5.5 Method footprint
- 14.6.5.6 Application footprint
- 14.7 COMPANY EVALUATION MATRIX: STARTUPS/SMES, 2025
- 14.7.1 PROGRESSIVE COMPANIES
- 14.7.2 RESPONSIVE COMPANIES
- 14.7.3 DYNAMIC COMPANIES
- 14.7.4 STARTING BLOCKS
- 14.7.5 COMPETITIVE BENCHMARKING OF STARTUPS/SMES, 2025
- 14.7.5.1 Detailed list of key startups/SMEs
- 14.7.5.2 Competitive benchmarking of key startups/SMEs
- 14.8 COMPETITIVE SCENARIO
- 14.8.1 PRODUCT LAUNCHES
- 14.8.2 DEALS
- 14.8.3 EXPANSIONS
- 14.9 COMPANY VALUATION & FINANCIAL METRICS
- 14.10 BRAND/PRODUCT COMPARISON
15 COMPANY PROFILES
- 15.1 KEY PLAYERS
- 15.1.1 AGILENT TECHNOLOGIES, INC.
- 15.1.1.1 Business overview
- 15.1.1.2 Products offered
- 15.1.1.3 Recent developments
- 15.1.1.3.1 Product launches
- 15.1.1.3.2 Deals
- 15.1.1.3.3 Expansions
- 15.1.1.4 MnM view
- 15.1.1.4.1 Key strengths
- 15.1.1.4.2 Strategic choices
- 15.1.1.4.3 Weaknesses & competitive threats
- 15.1.2 DANAHER CORPORATION
- 15.1.2.1 Business overview
- 15.1.2.2 Products offered
- 15.1.2.3 Recent developments
- 15.1.2.3.1 Product launches
- 15.1.2.3.2 Deals
- 15.1.2.4 MnM view
- 15.1.2.4.1 Key strengths
- 15.1.2.4.2 Strategic choices
- 15.1.2.4.3 Weaknesses & competitive threats
- 15.1.3 WATERS CORPORATION
- 15.1.3.1 Business overview
- 15.1.3.2 Products offered
- 15.1.3.3 Recent developments
- 15.1.3.3.1 Product launches
- 15.1.3.4 MnM view
- 15.1.3.4.1 Key strengths
- 15.1.3.4.2 Strategic choices
- 15.1.3.4.3 Weaknesses & competitive threats
- 15.1.4 THERMO FISHER SCIENTIFIC INC.
- 15.1.4.1 Business overview
- 15.1.4.2 Products offered
- 15.1.4.3 Recent developments
- 15.1.4.3.1 Product launches
- 15.1.4.3.2 Expansions
- 15.1.4.4 MnM view
- 15.1.4.4.1 Key strengths
- 15.1.4.4.2 Strategic choices
- 15.1.4.4.3 Weaknesses & competitive threats
- 15.1.5 SHIMADZU CORPORATION
- 15.1.5.1 Business overview
- 15.1.5.2 Products offered
- 15.1.5.3 Recent developments
- 15.1.5.3.1 Product launches
- 15.1.5.3.2 Expansions
- 15.1.5.4 MnM view
- 15.1.5.4.1 Key strengths
- 15.1.5.4.2 Strategic choices
- 15.1.5.4.3 Weaknesses & competitive threats
- 15.1.6 MERCK KGAA
- 15.1.6.1 Business overview
- 15.1.6.2 Products offered
- 15.1.6.3 Recent developments
- 15.1.6.3.1 Deals
- 15.1.6.3.2 Expansions
- 15.1.7 PERKINELMER INC.
- 15.1.7.1 Business overview
- 15.1.7.2 Products offered
- 15.1.7.3 Recent developments
- 15.1.7.3.1 Product launches
- 15.1.7.3.2 Deals
- 15.1.8 LGC LIMITED
- 15.1.8.1 Business overview
- 15.1.8.2 Products offered
- 15.1.8.3 Recent developments
- 15.1.8.3.1 Product launches
- 15.1.8.3.2 Deals
- 15.1.8.3.3 Expansions
- 15.1.9 BIOTAGE
- 15.1.9.1 Business overview
- 15.1.9.2 Products offered
- 15.1.9.3 Recent developments
- 15.1.9.3.1 Product launches
- 15.1.9.3.2 Expansions
- 15.1.10 MACHEREY-NAGEL GMBH & CO. KG
- 15.1.10.1 Business overview
- 15.1.10.2 Products offered
- 15.1.10.3 Recent developments
- 15.1.10.3.1 Product launches
- 15.1.11 ACCUSTANDARD
- 15.1.11.1 Business overview
- 15.1.11.2 Products offered
- 15.1.11.3 Recent developments
- 15.1.11.3.1 Product launches
- 15.1.12 WELLINGTON LABORATORIES INC.
- 15.1.12.1 Business overview
- 15.1.12.2 Products offered
- 15.1.12.3 Recent developments
- 15.1.12.3.1 Product launches
- 15.1.13 CAMBRIDGE ISOTOPE LABORATORIES, INC.
- 15.1.13.1 Business overview
- 15.1.13.2 Products offered
- 15.1.13.3 Recent developments
- 15.1.13.3.1 Expansions
- 15.1.14 CHIRON AS
- 15.1.14.1 Business overview
- 15.1.14.2 Products offered
- 15.1.15 METROHM INULA GMBH
- 15.1.15.1 Business overview
- 15.1.15.2 Products offered
- 15.1.1 AGILENT TECHNOLOGIES, INC.
- 15.2 OTHER COMPANIES
- 15.2.1 RESTEK CORPORATION
- 15.2.2 MICROSAIC
- 15.2.3 EVONIK
- 15.2.4 LCTECH
- 15.2.5 ABSOLUTE STANDARDS INC.
- 15.2.6 CYTIVA
- 15.2.7 AVANTOR, INC.
- 15.2.8 GREYHOUND CHROMATOGRAPHY AND ALLIED CHEMICALS LTD.
- 15.2.9 LANXESS
- 15.2.10 THE CHEMOURS COMPANY
16 RESEARCH METHODOLOGY
- 16.1 RESEARCH DATA
- 16.1.1 SECONDARY RESEARCH
- 16.1.1.1 Key secondary sources
- 16.1.1.2 Key data from secondary sources
- 16.1.2 PRIMARY RESEARCH
- 16.1.2.1 Key primary sources
- 16.1.2.2 Key supply- and demand-side participants
- 16.1.2.3 Breakdown of primary interviews
- 16.1.2.4 Key primary insights
- 16.1.1 SECONDARY RESEARCH
- 16.2 MARKET SIZE ESTIMATION METHODOLOGY
- 16.2.1 REVENUE MAPPING-BASED MARKET ESTIMATION
- 16.2.2 END USER-BASED MAPPING MARKET ESTIMATION
- 16.3 GROWTH FORECASTING MODEL
- 16.4 DATA TRIANGULATION AND MARKET BREAKDOWN
- 16.5 RESEARCH ASSUMPTIONS
- 16.6 RESEARCH LIMITATIONS
- 16.7 RISK ANALYSIS
17 APPENDIX
- 17.1 DISCUSSION GUIDE
- 17.2 KNOWLEDGESTORE: MARKETSANDMARKETS' SUBSCRIPTION PORTAL
- 17.3 CUSTOMIZATION OPTIONS
- 17.4 RELATED REPORTS
- 17.5 AUTHOR DETAILS
List of Tables
- TABLE 1 PFAS TESTING MARKET: INCLUSIONS & EXCLUSIONS
- TABLE 2 WASTEWATER, DRINKING WATER, AND WATER SUPPLY INFRASTRUCTURE: FEDERAL FUNDING FOR PROJECTS AND PROGRAMS
- TABLE 3 RESEARCH GRANTS FOR PFAS UPTAKE AND BIOACCUMULATION IN PLANTS AND ANIMALS IN AGRICULTURAL, RURAL, AND TRIBAL COMMUNITIES
- TABLE 4 PFAS TESTING MARKET: PORTER'S FIVE FORCES ANALYSIS
- TABLE 5 PFAS TESTING MARKET: ROLE OF ECOSYSTEM
- TABLE 6 AVERAGE SELLING PRICE TREND OF LC-MS INSTRUMENTS, BY KEY PLAYER, 2023-2025 (USD THOUSAND)
- TABLE 7 AVERAGE SELLING PRICE OF INSTRUMENTS, BY REGION, 2023-2025, (USD THOUSAND)
- TABLE 8 IMPORT DATA FOR HS CODE 390460-COMPLIANT PRODUCTS, BY COUNTRY, 2021-2025 (USD MILLION)
- TABLE 9 EXPORT DATA FOR HS CODE 390460-COMPLIANT PRODUCTS, BY COUNTRY, 2021-2025 (USD THOUSAND)
- TABLE 10 LIST OF KEY CONFERENCES AND EVENTS, 2026-2027
- TABLE 11 US-ADJUSTED RECIPROCAL TARIFF RATES IN PFAS TESTING INDUSTRY
- TABLE 12 ESTIMATED IMPACT OF US TARIFFS ON PRICES OF PFAS TESTING EQUIPMENT AND CONSUMABLES
- TABLE 13 PFAS TESTING MARKET: KEY PATENTS, 2022-2026
- TABLE 14 KEY COMPANIES IMPLEMENTING AI/GEN AI IN PFAS TESTING MARKET
- TABLE 15 KEY APPLICATIONS AND CLINICAL OUTCOMES ENABLED BY PFAS TESTING
- TABLE 16 NORTH AMERICA: REGULATORY BODIES, GOVERNMENT AGENCIES, AND OTHER ORGANIZATIONS
- TABLE 17 EUROPE: REGULATORY BODIES, GOVERNMENT AGENCIES, AND OTHER ORGANIZATIONS
- TABLE 18 ASIA PACIFIC: REGULATORY BODIES, GOVERNMENT AGENCIES, AND OTHER ORGANIZATIONS
- TABLE 19 REST OF THE WORLD: REGULATORY BODIES, GOVERNMENT AGENCIES, AND OTHER ORGANIZATIONS
- TABLE 20 INFLUENCE OF STAKEHOLDERS ON BUYING PROCESS (%)
- TABLE 21 KEY BUYING CRITERIA FOR PFAS TESTING, BY PRODUCT TYPE
- TABLE 22 PFAS TESTING MARKET: UNMET NEEDS
- TABLE 23 PFAS TESTING MARKET, BY PRODUCT TYPE, 2024-2031 (USD MILLION)
- TABLE 24 PFAS TESTING INSTRUMENTS MARKET, BY TYPE, 2024-2031 (USD MILLION)
- TABLE 25 PFAS TESTING INSTRUMENTS MARKET, BY REGION, 2024-2031 (USD MILLION)
- TABLE 26 NORTH AMERICA: PFAS TESTING INSTRUMENTS MARKET, BY COUNTRY, 2024-2031 (USD MILLION)
- TABLE 27 EUROPE: PFAS TESTING INSTRUMENTS MARKET, BY COUNTRY, 2024-2031 (USD MILLION)
- TABLE 28 ASIA PACIFIC: PFAS TESTING INSTRUMENTS MARKET, BY COUNTRY, 2024-2031 (USD MILLION)
- TABLE 29 PFAS TESTING INSTRUMENTS MARKET FOR LC-MS, BY REGION, 2024-2031 (USD MILLION)
- TABLE 30 NORTH AMERICA: PFAS TESTING INSTRUMENTS MARKET FOR LC-MS, BY COUNTRY, 2024-2031 (USD MILLION)
- TABLE 31 EUROPE: PFAS TESTING INSTRUMENTS MARKET FOR LC-MS, BY COUNTRY, 2024-2031 (USD MILLION)
- TABLE 32 ASIA PACIFIC: PFAS TESTING INSTRUMENTS MARKET FOR LC-MS, BY COUNTRY, 2024-2031 (USD MILLION)
- TABLE 33 PFAS TESTING INSTRUMENTS MARKET FOR GC-MS, BY REGION, 2024-2031 (USD MILLION)
- TABLE 34 NORTH AMERICA: PFAS TESTING INSTRUMENTS MARKET FOR GC-MS, BY COUNTRY, 2024-2031 (USD MILLION)
- TABLE 35 EUROPE: PFAS TESTING INSTRUMENTS MARKET FOR GC-MS, BY COUNTRY, 2024-2031 (USD MILLION)
- TABLE 36 ASIA PACIFIC: PFAS TESTING INSTRUMENTS MARKET FOR GC-MS, BY COUNTRY, 2024-2031 (USD MILLION)
- TABLE 37 PFAS TESTING INSTRUMENTS MARKET FOR STANDALONE MASS SPECTROMETRY, BY REGION, 2024-2031 (USD MILLION)
- TABLE 38 NORTH AMERICA: PFAS TESTING INSTRUMENTS MARKET FOR STANDALONE MASS SPECTROMETRY, BY COUNTRY, 2024-2031 (USD MILLION)
- TABLE 39 EUROPE: PFAS TESTING INSTRUMENTS MARKET FOR STANDALONE MASS SPECTROMETRY, BY COUNTRY, 2024-2031 (USD MILLION)
- TABLE 40 ASIA PACIFIC: PFAS TESTING INSTRUMENTS MARKET FOR STANDALONE MASS SPECTROMETRY, BY COUNTRY, 2024-2031 (USD MILLION)
- TABLE 41 PFAS TESTING INSTRUMENTS MARKET FOR NUCLEAR MAGNETIC RESONANCE SPECTROSCOPY, BY REGION, 2024-2031 (USD MILLION)
- TABLE 42 NORTH AMERICA: PFAS TESTING INSTRUMENTS MARKET FOR NUCLEAR MAGNETIC RESONANCE SPECTROSCOPY, BY COUNTRY, 2024-2031 (USD MILLION)
- TABLE 43 EUROPE: PFAS TESTING INSTRUMENTS MARKET FOR NUCLEAR MAGNETIC RESONANCE SPECTROSCOPY, BY COUNTRY, 2024-2031 (USD MILLION)
- TABLE 44 ASIA PACIFIC: PFAS TESTING INSTRUMENTS MARKET FOR NUCLEAR MAGNETIC RESONANCE SPECTROSCOPY, BY COUNTRY, 2024-2031 (USD MILLION)
- TABLE 45 OTHER PFAS TESTING INSTRUMENTS MARKET, BY REGION,
024-2031 (USD MILLION)
- TABLE 46 NORTH AMERICA: OTHER PFAS TESTING INSTRUMENTS MARKET, BY COUNTRY, 2024-2031 (USD MILLION)
- TABLE 47 EUROPE: OTHER PFAS TESTING INSTRUMENTS MARKET, BY COUNTRY, 2024-2031 (USD MILLION)
- TABLE 48 ASIA PACIFIC: OTHER PFAS TESTING INSTRUMENTS MARKET, BY COUNTRY, 2024-2031 (USD MILLION)
- TABLE 49 PFAS TESTING CONSUMABLES MARKET, BY TYPE, 2024-2031 (USD MILLION)
- TABLE 50 PFAS TESTING CONSUMABLES MARKET, BY REGION, 2024-2031 (USD MILLION)
- TABLE 51 NORTH AMERICA: PFAS TESTING CONSUMABLES MARKET, BY COUNTRY, 2024-2031 (USD MILLION)
- TABLE 52 EUROPE: PFAS TESTING CONSUMABLES MARKET, BY COUNTRY, 2024-2031 (USD MILLION)
- TABLE 53 ASIA PACIFIC: PFAS TESTING CONSUMABLES MARKET, BY COUNTRY, 2024-2031 (USD MILLION)
- TABLE 54 PFAS TESTING CONSUMABLES MARKET FOR SAMPLE PREPARATION PRODUCTS, BY REGION, 2024-2031 (USD MILLION)
- TABLE 55 NORTH AMERICA: PFAS TESTING CONSUMABLES MARKET FOR SAMPLE PREPARATION PRODUCTS, BY COUNTRY, 2024-2031 (USD MILLION)
- TABLE 56 EUROPE: PFAS TESTING CONSUMABLES MARKET FOR SAMPLE PREPARATION PRODUCTS, BY COUNTRY, 2024-2031 (USD MILLION)
- TABLE 57 ASIA PACIFIC: PFAS TESTING CONSUMABLES MARKET FOR SAMPLE PREPARATION PRODUCTS, BY COUNTRY, 2024-2031 (USD MILLION)
- TABLE 58 PFAS TESTING CONSUMABLES MARKET FOR CHROMATOGRAPHY COLUMNS, BY REGION, 2024-2031 (USD MILLION)
- TABLE 59 NORTH AMERICA: PFAS TESTING CONSUMABLES MARKET FOR CHROMATOGRAPHY COLUMNS, BY COUNTRY, 2024-2031 (USD MILLION)
- TABLE 60 EUROPE: PFAS TESTING CONSUMABLES MARKET FOR CHROMATOGRAPHY COLUMNS, BY COUNTRY, 2024-2031 (USD MILLION)
- TABLE 61 ASIA PACIFIC: PFAS TESTING CONSUMABLES MARKET FOR CHROMATOGRAPHY COLUMNS, BY COUNTRY, 2024-2031 (USD MILLION)
- TABLE 62 TOTAL NUMBER OF PFAS TESTS PERFORMED WORLDWIDE, BY REGION, 2024
- TABLE 63 PFAS TESTING CONSUMABLES MARKET FOR REFERENCE MATERIALS & ANALYTICAL STANDARDS, BY REGION, 2024-2031 (USD MILLION)
- TABLE 64 NORTH AMERICA: PFAS TESTING CONSUMABLES MARKET FOR REFERENCE MATERIALS & ANALYTICAL STANDARDS, BY COUNTRY, 2024-2031 (USD MILLION)
- TABLE 65 EUROPE: PFAS TESTING CONSUMABLES MARKET FOR REFERENCE MATERIALS & ANALYTICAL STANDARDS, BY COUNTRY, 2024-2031 (USD MILLION)
- TABLE 66 ASIA PACIFIC: PFAS TESTING CONSUMABLES MARKET FOR REFERENCE MATERIALS & ANALYTICAL STANDARDS, BY COUNTRY, 2024-2031 (USD MILLION)
- TABLE 67 PFAS TESTING CONSUMABLES MARKET FOR SOLVENTS, BY REGION, 2024-2031 (USD MILLION)
- TABLE 68 NORTH AMERICA: PFAS TESTING CONSUMABLES MARKET FOR SOLVENTS, BY COUNTRY, 2024-2031 (USD MILLION)
- TABLE 69 EUROPE: PFAS TESTING CONSUMABLES MARKET FOR SOLVENTS, BY COUNTRY, 2024-2031 (USD MILLION)
- TABLE 70 ASIA PACIFIC: PFAS TESTING CONSUMABLES MARKET FOR SOLVENTS, BY COUNTRY, 2024-2031 (USD MILLION)
- TABLE 71 PFAS TESTING CONSUMABLES MARKET FOR MEMBRANE & SYRINGE FILTERS, BY REGION, 2024-2031 (USD MILLION)
- TABLE 72 NORTH AMERICA: PFAS TESTING CONSUMABLES MARKET FOR MEMBRANE & SYRINGE FILTERS, BY COUNTRY, 2024-2031 (USD MILLION)
- TABLE 73 EUROPE: PFAS TESTING CONSUMABLES MARKET FOR MEMBRANE & SYRINGE FILTERS, BY COUNTRY, 2024-2031 (USD MILLION)
- TABLE 74 ASIA PACIFIC: PFAS TESTING CONSUMABLES MARKET FOR MEMBRANE & SYRINGE FILTERS, BY COUNTRY, 2024-2031 (USD MILLION)
- TABLE 75 PFAS TESTING CONSUMABLES MARKET FOR REAGENTS, BY REGION, 2024-2031 (USD MILLION)
- TABLE 76 NORTH AMERICA: PFAS TESTING CONSUMABLES MARKET FOR REAGENTS, BY COUNTRY, 2024-2031 (USD MILLION)
- TABLE 77 EUROPE: PFAS TESTING CONSUMABLES MARKET FOR REAGENTS, BY COUNTRY, 2024-2031 (USD MILLION)
- TABLE 78 ASIA PACIFIC: PFAS TESTING CONSUMABLES MARKET FOR REAGENTS, BY COUNTRY, 2024-2031 (USD MILLION)
- TABLE 79 OTHER PFAS TESTING CONSUMABLES MARKET, BY REGION, 2024-2031 (USD MILLION)
- TABLE 80 NORTH AMERICA: OTHER PFAS TESTING CONSUMABLES MARKET, BY COUNTRY, 2024-2031 (USD MILLION)
- TABLE 81 EUROPE: OTHER PFAS TESTING CONSUMABLES MARKET, BY COUNTRY, 2024-2031 (USD MILLION)
- TABLE 82 ASIA PACIFIC: OTHER PFAS TESTING CONSUMABLES MARKET, BY COUNTRY, 2024-2031 (USD MILLION)
- TABLE 83 PFAS TESTING SOFTWARE & SERVICES MARKET, BY REGION, 2024-2031 (USD MILLION)
- TABLE 84 NORTH AMERICA: PFAS TESTING SOFTWARE & SERVICES MARKET, BY COUNTRY, 2024-2031 (USD MILLION)
- TABLE 85 EUROPE: PFAS TESTING SOFTWARE & SERVICES MARKET, BY COUNTRY, 2024-2031 (USD MILLION)
- TABLE 86 ASIA PACIFIC: PFAS TESTING SOFTWARE & SERVICES MARKET, BY COUNTRY, 2024-2031 (USD MILLION)
- TABLE 87 PFAS TESTING MARKET, BY TECHNIQUE, 2024-2031 (USD MILLION)
- TABLE 88 PFAS TESTING TECHNIQUES MARKET, BY REGION, 2024-2031 (USD MILLION)
- TABLE 89 PFAS TESTING MARKET FOR LC-MS/MS, BY REGION, 2024-2031 (USD MILLION)
- TABLE 90 PFAS TESTING MARKET FOR GC-MS, BY REGION, 2024-2031 (USD MILLION)
- TABLE 91 PFAS TESTING MARKET FOR NMR SPECTROSCOPY, BY REGION, 2024-2031 (USD MILLION)
- TABLE 92 PFAS TESTING MARKET FOR MASS SPECTROMETRY, BY REGION, 2024-2031 (USD MILLION)
- TABLE 93 PFAS TESTING MARKET FOR COMBUSTION ION CHROMATOGRAPHY, BY REGION, 2024-2031 (USD MILLION)
- TABLE 94 PFAS TESTING MARKET FOR ELISA, BY REGION, 2024-2031 (USD MILLION)
- TABLE 95 PFAS TESTING MARKET FOR OTHER TECHNIQUES, BY REGION, 2024-2031 (USD MILLION)
- TABLE 96 PFAS TESTING MARKET, BY METHOD, 2024-2031 (USD MILLION)
- TABLE 97 PFAS TESTING METHODS MARKET, BY REGION, 2024-2031 (USD MILLION)
- TABLE 98 APPLICATIONS OF EPA METHODS FOR PFAS TESTING ACROSS VARIOUS SAMPLE TYPES
- TABLE 99 PFAS TESTING MARKET FOR EPA METHODS, BY REGION, 2024-2031 (USD MILLION)
- TABLE 100 APPLICATIONS OF DIN METHODS FOR PFAS TESTING ACROSS VARIOUS SAMPLE TYPES
- TABLE 101 PFAS TESTING MARKET FOR DIN METHODS, BY REGION, 2024-2031 (USD MILLION)
- TABLE 102 APPLICATIONS OF ISO METHODS FOR PFAS TESTING ACROSS VARIOUS SAMPLE TYPES
- TABLE 103 PFAS TESTING MARKET FOR ISO METHODS, BY REGION, 2024-2031 (USD MILLION)
- TABLE 104 APPLICATIONS OF ASTM METHODS FOR PFAS TESTING ACROSS VARIOUS SAMPLE TYPES
- TABLE 105 PFAS TESTING MARKET FOR ASTM METHODS, BY REGION, 2024-2031 (USD MILLION)
- TABLE 106 APPLICATIONS OF OTHER METHODS FOR PFAS TESTING ACROSS VARIOUS SAMPLE TYPES
- TABLE 107 PFAS TESTING MARKET FOR OTHER METHODS, BY REGION, 2024-2031 (USD MILLION)
- TABLE 108 PFAS TESTING MARKET, BY APPLICATION, 2024-2031 (USD MILLION)
- TABLE 109 PFAS TESTING APPLICATIONS MARKET, BY REGION, 2024-2031 (USD MILLION)
- TABLE 110 PFAS TESTING MARKET FOR WATER TESTING APPLICATIONS, BY TYPE, 2024-2031 (USD MILLION)
- TABLE 111 PFAS TESTING MARKET FOR GROUND & POTABLE WATER TESTING APPLICATIONS, BY REGION, 2024-2031 (USD MILLION)
- TABLE 112 PFAS TESTING MARKET FOR WASTEWATER TESTING APPLICATIONS, BY REGION, 2024-2031 (USD MILLION)
- TABLE 113 PFAS TESTING MARKET FOR SOIL TESTING APPLICATIONS, BY REGION, 2024-2031 (USD MILLION)
- TABLE 114 PFAS TESTING MARKET FOR FOOD & BEVERAGE TESTING APPLICATIONS, BY REGION, 2024-2031 (USD MILLION)
- TABLE 115 PFAS TESTING MARKET FOR BLOOD/SERUM TESTING APPLICATIONS, BY REGION, 2024-2031 (USD MILLION)
- TABLE 116 PFAS TESTING MARKET FOR AIR MONITORING APPLICATIONS, BY REGION, 2024-2031 (USD MILLION)
- TABLE 117 PFAS TESTING MARKET FOR MICROBIAL TESTING APPLICATIONS, BY REGION, 2024-2031 (USD MILLION)
- TABLE 118 PFAS TESTING MARKET FOR OTHER APPLICATIONS, BY REGION, 2024-2031 (USD MILLION)
- TABLE 119 PFAS TESTING MARKET, BY REGION, 2024-2031 (USD MILLION)
- TABLE 120 NORTH AMERICA: PFAS TESTING MARKET, BY COUNTRY, 2024-2031 (USD MILLION)
- TABLE 121 NORTH AMERICA: PFAS TESTING MARKET, BY PRODUCT TYPE, 2024-2031 (USD MILLION)
- TABLE 122 NORTH AMERICA: PFAS TESTING INSTRUMENTS MARKET, BY TYPE, 2024-2031 (USD MILLION)
- TABLE 123 NORTH AMERICA: PFAS TESTING CONSUMABLES MARKET, BY TYPE, 2024-2031 (USD MILLION)
- TABLE 124 NORTH AMERICA: PFAS TESTING MARKET, BY TECHNIQUE, 2024-2031 (USD MILLION)
- TABLE 125 NORTH AMERICA: PFAS TESTING MARKET, BY METHOD, 2024-2031 (USD MILLION)
- TABLE 126 NORTH AMERICA: PFAS TESTING MARKET, BY APPLICATION, 2024-2031 (USD MILLION)
- TABLE 127 NORTH AMERICA: PFAS TESTING MARKET FOR WATER TESTING APPLICATIONS, BY TYPE, 2024-2031 (USD MILLION)
- TABLE 128 MACROECONOMIC OUTLOOK FOR NORTH AMERICA
- TABLE 129 US: PFAS TESTING MARKET, BY PRODUCT TYPE, 2024-2031 (USD MILLION)
- TABLE 130 US: PFAS TESTING INSTRUMENTS MARKET, BY TYPE, 2024-2031 (USD MILLION)
- TABLE 131 US: PFAS TESTING CONSUMABLES MARKET, BY TYPE, 2024-2031 (USD MILLION)
- TABLE 132 CANADA: PFAS TESTING MARKET, BY PRODUCT TYPE, 2024-2031 (USD MILLION)
- TABLE 133 CANADA: PFAS TESTING INSTRUMENTS MARKET, BY TYPE, 2024-2031 (USD MILLION)
- TABLE 134 CANADA: PFAS TESTING CONSUMABLES MARKET, BY TYPE, 2024-2031 (USD MILLION)
- TABLE 135 EUROPE: PFAS TESTING MARKET, BY COUNTRY, 2024-2031 (USD MILLION)
- TABLE 136 EUROPE: PFAS TESTING MARKET, BY PRODUCT TYPE, 2024-2031 (USD MILLION)
- TABLE 137 EUROPE: PFAS TESTING INSTRUMENTS MARKET, BY TYPE, 2024-2031 (USD MILLION)
- TABLE 138 EUROPE: PFAS TESTING CONSUMABLES MARKET, BY TYPE, 2024-2031 (USD MILLION)
- TABLE 139 EUROPE: PFAS TESTING MARKET, BY TECHNIQUE, 2024-2031 (USD MILLION)
- TABLE 140 EUROPE: PFAS TESTING MARKET, BY METHOD, 2024-2031 (USD MILLION)
- TABLE 141 EUROPE: PFAS TESTING MARKET, BY APPLICATION, 2024-2031 (USD MILLION)
- TABLE 142 EUROPE: PFAS TESTING MARKET FOR WATER TESTING APPLICATIONS, BY TYPE, 2024-2031 (USD MILLION)
- TABLE 143 MACROECONOMIC OUTLOOK FOR EUROPE
- TABLE 144 GERMANY: PFAS TESTING MARKET, BY PRODUCT TYPE, 2024-2031 (USD MILLION)
- TABLE 145 GERMANY: PFAS TESTING INSTRUMENTS MARKET, BY TYPE, 2024-2031 (USD MILLION)
- TABLE 146 GERMANY: PFAS TESTING CONSUMABLES MARKET, BY TYPE, 2024-2031 (USD MILLION)
- TABLE 147 UK: PFAS TESTING MARKET, BY PRODUCT TYPE, 2024-2031 (USD MILLION)
- TABLE 148 UK: PFAS TESTING INSTRUMENTS MARKET, BY TYPE, 2024-2031 (USD MILLION)
- TABLE 149 UK: PFAS TESTING CONSUMABLES MARKET, BY TYPE, 2024-2031 (USD MILLION)
- TABLE 150 FRANCE: PFAS TESTING MARKET, BY PRODUCT TYPE, 2024-2031 (USD MILLION)
- TABLE 151 FRANCE: PFAS TESTING INSTRUMENTS MARKET, BY TYPE, 2024-2031 (USD MILLION)
- TABLE 152 FRANCE: PFAS TESTING CONSUMABLES MARKET, BY TYPE, 2024-2031 (USD MILLION)
- TABLE 153 ITALY: PFAS TESTING MARKET, BY PRODUCT TYPE, 2024-2031 (USD MILLION)
- TABLE 154 ITALY: PFAS TESTING INSTRUMENTS MARKET, BY TYPE, 2024-2031 (USD MILLION)
- TABLE 155 ITALY: PFAS TESTING CONSUMABLES MARKET, BY TYPE, 2024-2031 (USD MILLION)
- TABLE 156 SPAIN: PFAS TESTING MARKET, BY PRODUCT TYPE, 2024-2031 (USD MILLION)
- TABLE 157 SPAIN: PFAS TESTING INSTRUMENTS MARKET, BY TYPE, 2024-2031 (USD MILLION)
- TABLE 158 SPAIN: PFAS TESTING CONSUMABLES MARKET, BY TYPE, 2024-2031 (USD MILLION)
- TABLE 159 REST OF EUROPE: PFAS TESTING MARKET, BY PRODUCT TYPE, 2024-2031 (USD MILLION)
- TABLE 160 REST OF EUROPE: PFAS TESTING INSTRUMENTS MARKET, BY TYPE, 2024-2031 (USD MILLION)
- TABLE 161 REST OF EUROPE: PFAS TESTING CONSUMABLES MARKET, BY TYPE, 2024-2031 (USD MILLION)
- TABLE 162 ASIA PACIFIC: PFAS TESTING MARKET, BY COUNTRY, 2024-2031 (USD MILLION)
- TABLE 163 ASIA PACIFIC: PFAS TESTING MARKET, BY PRODUCT TYPE, 2024-2031 (USD MILLION)
- TABLE 164 ASIA PACIFIC: PFAS TESTING INSTRUMENTS MARKET, BY TYPE, 2024-2031 (USD MILLION)
- TABLE 165 ASIA PACIFIC: PFAS TESTING CONSUMABLES MARKET, BY TYPE, 2024-2031 (USD MILLION)
- TABLE 166 ASIA PACIFIC: PFAS TESTING MARKET, BY TECHNIQUE, 2024-2031 (USD MILLION)
- TABLE 167 ASIA PACIFIC: PFAS TESTING MARKET, BY METHOD, 2024-2031 (USD MILLION)
- TABLE 168 ASIA PACIFIC: PFAS TESTING MARKET, BY APPLICATION, 2024-2031 (USD MILLION)
- TABLE 169 ASIA PACIFIC: PFAS TESTING MARKET FOR WATER TESTING APPLICATIONS, BY TYPE, 2024-2031 (USD MILLION)
- TABLE 170 MACROECONOMIC OUTLOOK FOR ASIA PACIFIC
- TABLE 171 JAPAN: PFAS TESTING MARKET, BY PRODUCT TYPE, 2024-2031 (USD MILLION)
- TABLE 172 JAPAN: PFAS TESTING INSTRUMENTS MARKET, BY TYPE, 2024-2031 (USD MILLION)
- TABLE 173 JAPAN: PFAS TESTING CONSUMABLES MARKET, BY TYPE, 2024-2031 (USD MILLION)
- TABLE 174 CHINA: PFAS TESTING MARKET, BY PRODUCT TYPE, 2024-2031 (USD MILLION)
- TABLE 175 CHINA: PFAS TESTING INSTRUMENTS MARKET, BY TYPE, 2024-2031 (USD MILLION)
- TABLE 176 CHINA: PFAS TESTING CONSUMABLES MARKET, BY TYPE, 2024-2031 (USD MILLION)
- TABLE 177 INDIA: PFAS TESTING MARKET, BY PRODUCT TYPE, 2024-2031 (USD MILLION)
- TABLE 178 INDIA: PFAS TESTING INSTRUMENTS MARKET, BY TYPE, 2024-2031 (USD MILLION)
- TABLE 179 INDIA: PFAS TESTING CONSUMABLES MARKET, BY TYPE, 2024-2031 (USD MILLION)
- TABLE 180 AUSTRALIA: PFAS TESTING MARKET, BY PRODUCT TYPE, 2024-2031 (USD MILLION)
- TABLE 181 AUSTRALIA: PFAS TESTING INSTRUMENTS MARKET, BY TYPE, 2024-2031 (USD MILLION)
- TABLE 182 AUSTRALIA: PFAS TESTING CONSUMABLES MARKET, BY TYPE, 2024-2031 (USD MILLION)
- TABLE 183 SOUTH KOREA: PFAS TESTING MARKET, BY PRODUCT TYPE, 2024-2031 (USD MILLION)
- TABLE 184 SOUTH KOREA: PFAS TESTING INSTRUMENTS MARKET, BY TYPE, 2024-2031 (USD MILLION)
- TABLE 185 SOUTH KOREA: PFAS TESTING CONSUMABLES MARKET, BY TYPE, 2024-2031 (USD MILLION)
- TABLE 186 REST OF ASIA PACIFIC: PFAS TESTING MARKET, BY PRODUCT TYPE, 2024-2031 (USD MILLION)
- TABLE 187 REST OF ASIA PACIFIC: PFAS TESTING INSTRUMENTS MARKET, BY TYPE, 2024-2031 (USD MILLION)
- TABLE 188 REST OF ASIA PACIFIC: PFAS TESTING CONSUMABLES MARKET, BY TYPE, 2024-2031 (USD MILLION)
- TABLE 189 LATIN AMERICA: PFAS TESTING MARKET, BY COUNTRY, 2024-2031 (USD MILLION)
- TABLE 190 LATIN AMERICA: PFAS TESTING MARKET, BY PRODUCT TYPE, 2024-2031 (USD MILLION)
- TABLE 191 LATIN AMERICA: PFAS TESTING INSTRUMENTS MARKET, BY TYPE, 2024-2031 (USD MILLION)
- TABLE 192 LATIN AMERICA: PFAS TESTING CONSUMABLES MARKET, BY TYPE, 2024-2031 (USD MILLION)
- TABLE 193 LATIN AMERICA: PFAS TESTING MARKET, BY TECHNIQUE, 2024-2031 (USD MILLION)
- TABLE 194 LATIN AMERICA: PFAS TESTING MARKET, BY METHOD, 2024-2031 (USD MILLION)
- TABLE 195 LATIN AMERICA: PFAS TESTING MARKET, BY APPLICATION, 2024-2031 (USD MILLION)
- TABLE 196 LATIN AMERICA: PFAS TESTING MARKET FOR WATER TESTING APPLICATIONS, BY TYPE, 2024-2031 (USD MILLION)
- TABLE 197 MACROECONOMIC OUTLOOK FOR LATIN AMERICA
- TABLE 198 BRAZIL: PFAS TESTING MARKET, BY PRODUCT TYPE, 2024-2031 (USD MILLION)
- TABLE 199 BRAZIL: PFAS TESTING INSTRUMENTS MARKET, BY TYPE, 2024-2031 (USD MILLION)
- TABLE 200 BRAZIL: PFAS TESTING CONSUMABLES MARKET, BY TYPE, 2024-2031 (USD MILLION)
- TABLE 201 MEXICO: PFAS TESTING MARKET, BY PRODUCT TYPE, 2024-2031 (USD MILLION)
- TABLE 202 MEXICO: PFAS TESTING INSTRUMENTS MARKET, BY TYPE, 2024-2031 (USD MILLION)
- TABLE 203 MEXICO: PFAS TESTING CONSUMABLES MARKET, BY TYPE, 2024-2031 (USD MILLION)
- TABLE 204 REST OF LATIN AMERICA: PFAS TESTING MARKET, BY PRODUCT TYPE, 2024-2031 (USD MILLION)
- TABLE 205 REST OF LATIN AMERICA: PFAS TESTING INSTRUMENTS MARKET, BY TYPE, 2024-2031 (USD MILLION)
- TABLE 206 REST OF LATIN AMERICA: PFAS TESTING CONSUMABLES MARKET, BY TYPE, 2024-2031 (USD MILLION)
- TABLE 207 MIDDLE EAST & AFRICA: PFAS TESTING MARKET, BY COUNTRY, 2024-2031 (USD MILLION)
- TABLE 208 MIDDLE EAST & AFRICA: PFAS TESTING MARKET, BY PRODUCT TYPE, 2024-2031 (USD MILLION)
- TABLE 209 MIDDLE EAST & AFRICA: PFAS TESTING INSTRUMENTS MARKET, BY TYPE, 2024-2031 (USD MILLION)
- TABLE 210 MIDDLE EAST & AFRICA: PFAS TESTING CONSUMABLES MARKET, BY TYPE, 2024-2031 (USD MILLION)
- TABLE 211 MIDDLE EAST & AFRICA: PFAS TESTING MARKET, BY TECHNIQUE, 2024-2031 (USD MILLION)
- TABLE 212 MIDDLE EAST & AFRICA: PFAS TESTING MARKET, BY METHOD, 2024-2031 (USD MILLION)
- TABLE 213 MIDDLE EAST & AFRICA: PFAS TESTING MARKET, BY APPLICATION, 2024-2031 (USD MILLION)
- TABLE 214 MIDDLE EAST & AFRICA: PFAS TESTING MARKET FOR WATER TESTING APPLICATIONS, BY TYPE, 2024-2031 (USD MILLION)
- TABLE 215 MACROECONOMIC OUTLOOK FOR MIDDLE EAST & AFRICA
- TABLE 216 GCC COUNTRIES: PFAS TESTING MARKET, BY PRODUCT TYPE, 2024-2031 (USD MILLION)
- TABLE 217 GCC COUNTRIES: PFAS TESTING INSTRUMENTS MARKET, BY TYPE, 2024-2031 (USD MILLION)
- TABLE 218 GCC COUNTRIES: PFAS TESTING CONSUMABLES MARKET, BY TYPE, 2024-2031 (USD MILLION)
- TABLE 219 REST OF MIDDLE EAST & AFRICA: PFAS TESTING MARKET, BY PRODUCT TYPE, 2024-2031 (USD MILLION)
- TABLE 220 REST OF MIDDLE EAST & AFRICA: PFAS TESTING INSTRUMENTS MARKET, BY TYPE, 2024-2031 (USD MILLION)
- TABLE 221 REST OF MIDDLE EAST & AFRICA: PFAS TESTING CONSUMABLES MARKET, BY TYPE, 2024-2031 (USD MILLION)
- TABLE 222 OVERVIEW OF STRATEGIES ADOPTED BY PLAYERS IN PFAS TESTING MARKET
- TABLE 223 PFAS TESTING MARKET: DEGREE OF COMPETITION
- TABLE 224 PFAS TESTING MARKET: REGION FOOTPRINT
- TABLE 225 PFAS TESTING MARKET: PRODUCT TYPE FOOTPRINT
- TABLE 226 PFAS TESTING MARKET: TECHNIQUE FOOTPRINT
- TABLE 227 PFAS TESTING MARKET: METHOD FOOTPRINT
- TABLE 228 PFAS TESTING MARKET: APPLICATION FOOTPRINT
- TABLE 229 PFAS TESTING MARKET: DETAILED LIST OF KEYS STARTUPS/SMES
- TABLE 230 PFAS TESTING MARKET: COMPETITIVE BENCHMARKING OF KEY STARTUPS/SMES
- TABLE 231 PFAS TESTING MARKET: PRODUCT LAUNCHES, JANUARY 2022-SEPTEMBER 2026
- TABLE 232 PFAS TESTING MARKET: DEALS, JANUARY 2022-SEPTEMBER 2026
- TABLE 233 PFAS TESTING MARKET: EXPANSIONS, JANUARY 2022-SEPTEMBER 2026
- TABLE 234 AGILENT TECHNOLOGIES, INC.: COMPANY OVERVIEW
- TABLE 235 AGILENT TECHNOLOGIES, INC.: PRODUCTS OFFERED
- TABLE 236 AGILENT TECHNOLOGIES, INC.: PRODUCT LAUNCHES, JANUARY 2022-SEPTEMBER 2026
- TABLE 237 AGILENT TECHNOLOGIES, INC.: DEALS, JANUARY 2022-SEPTEMBER 2026
- TABLE 238 AGILENT TECHNOLOGIES, INC.: EXPANSIONS, JANUARY 2022-SEPTEMBER 2026
- TABLE 239 DANAHER CORPORATION: COMPANY OVERVIEW
- TABLE 240 PHENOMENEX INC.: PRODUCTS OFFERED
- TABLE 241 SCIEX: PRODUCTS OFFERED
- TABLE 242 DANAHER CORPORATION: PRODUCT LAUNCHES, JANUARY 2022-SEPTEMBER 2026
- TABLE 243 DANAHER CORPORATION: DEALS, JANUARY 2022-SEPTEMBER 2026
- TABLE 244 WATERS CORPORATION: COMPANY OVERVIEW
- TABLE 245 WATERS CORPORATION: PRODUCTS OFFERED
- TABLE 246 WATERS CORPORATION: PRODUCT LAUNCHES, JANUARY 2022-SEPTEMBER 2026
- TABLE 247 THERMO FISHER SCIENTIFIC INC.: COMPANY OVERVIEW
- TABLE 248 THERMO FISHER SCIENTIFIC INC.: PRODUCTS OFFERED
- TABLE 249 THERMO FISHER SCIENTIFIC INC.: PRODUCT LAUNCHES, JANUARY 2022-SEPTEMBER 2026
- TABLE 250 SHIMADZU CORPORATION: EXPANSIONS, JANUARY 2022-SEPTEMBER 2026
- TABLE 251 SHIMADZU CORPORATION: COMPANY OVERVIEW
- TABLE 252 SHIMADZU CORPORATION: PRODUCTS OFFERED
- TABLE 253 SHIMADZU CORPORATION: PRODUCT LAUNCHES, JANUARY 2022-SEPTEMBER 2026
- TABLE 254 SHIMADZU CORPORATION: EXPANSIONS, JANUARY 2022-SEPTEMBER 2026
- TABLE 255 MERCK KGAA: COMPANY OVERVIEW
- TABLE 256 MERCK KGAA: PRODUCTS OFFERED
- TABLE 257 MERCK KGAA: DEALS, JANUARY 2022-SEPTEMBER 2026
- TABLE 258 MERCK KGAA: EXPANSIONS, JANUARY 2022-SEPTEMBER 2026
- TABLE 259 PERKINELMER INC.: COMPANY OVERVIEW
- TABLE 260 PERKINELMER INC.: PRODUCTS OFFERED
- TABLE 261 PERKINELMER INC: PRODUCT LAUNCHES, JANUARY 2022-SEPTEMBER 2026
- TABLE 262 PERKINELMER INC: DEALS, JANUARY 2022-SEPTEMBER 2026
- TABLE 263 LGC LIMITED: COMPANY OVERVIEW
- TABLE 264 LGC LIMITED: PRODUCTS OFFERED
- TABLE 265 LGC LIMITED: PRODUCT LAUNCHES, JANUARY 2022-SEPTEMBER 2026
- TABLE 266 LGC LIMITED: DEALS, JANUARY 2022-SEPTEMBER 2026
- TABLE 267 LGC LIMITED: EXPANSIONS, JANUARY 2022-SEPTEMBER 2026
- TABLE 268 BIOTAGE: COMPANY OVERVIEW
- TABLE 269 BIOTAGE: PRODUCTS OFFERED
- TABLE 270 BIOTAGE: PRODUCT LAUNCHES, JANUARY 2022-SEPTEMBER 2026
- TABLE 271 BIOTAGE: EXPANSIONS, JANUARY 2022-SEPTEMBER 2026
- TABLE 272 MACHEREY-NAGEL GMBH & CO. KG: COMPANY OVERVIEW
- TABLE 273 MACHEREY-NAGEL GMBH & CO. KG: PRODUCTS OFFERED
- TABLE 274 MACHEREY-NAGEL GMBH & CO. KG: PRODUCT LAUNCHES, JANUARY 2022-SEPTEMBER 2026
- TABLE 275 ACCUSTANDARD: COMPANY OVERVIEW
- TABLE 276 ACCUSTANDARD: PRODUCTS OFFERED
- TABLE 277 ACCUSTANDARD: PRODUCT LAUNCHES, JANUARY 2022-SEPTEMBER 2026
- TABLE 278 WELLINGTON LABORATORIES INC.: COMPANY OVERVIEW
- TABLE 279 WELLINGTON LABORATORIES INC.: PRODUCTS OFFERED
- TABLE 280 WELLINGTON LABORATORIES INC.: PRODUCT LAUNCHES, JANUARY 2022-SEPTEMBER 2026
- TABLE 281 CAMBRIDGE ISOTOPE LABORATORIES, INC.: COMPANY OVERVIEW
- TABLE 282 CAMBRIDGE ISOTOPE LABORATORIES, INC.: PRODUCTS OFFERED
- TABLE 283 CAMBRIDGE ISOTOPE LABORATORIES, INC.: EXPANSIONS, JANUARY 2022-SEPTEMBER 2026
- TABLE 284 CHIRON AS: COMPANY OVERVIEW
- TABLE 285 CHIRON AS: PRODUCTS OFFERED
- TABLE 286 METROHM INULA GMBH: COMPANY OVERVIEW
- TABLE 287 METROHM INULA GMBH: PRODUCTS OFFERED
- TABLE 288 PFAS TESTING MARKET: RISK ANALYSIS
List of Figures
- FIGURE 1 PFAS TESTING MARKET SEGMENTATION AND REGIONAL SCOPE
- FIGURE 2 PFAS TESTING MARKET: YEARS CONSIDERED
- FIGURE 3 MARKET SCENARIO
- FIGURE 4 GLOBAL PFAS TESTING MARKET, 2024-2031
- FIGURE 5 MAJOR STRATEGIES ADOPTED BY KEY PLAYERS IN PFAS TESTING MARKET, 2022-2026
- FIGURE 6 DISRUPTIONS INFLUENCING GROWTH OF PFAS TESTING MARKET
- FIGURE 7 HIGH-GROWTH SEGMENTS IN PFAS TESTING MARKET, 2026-2031
- FIGURE 8 ASIA PACIFIC TO REGISTER HIGHEST CAGR IN PFAS TESTING MARKET DURING FORECAST PERIOD
- FIGURE 9 RISING PFAS CONTAMINATION CONCERNS IN WATER INCREASE DEMAND FOR SENSITIVE ANALYTICAL TESTING
- FIGURE 10 INSTRUMENTS TO BE LARGEST SEGMENT IN 2031
- FIGURE 11 US AND INSTRUMENTS ACCOUNTED FOR LARGEST MARKET SHARE IN NORTH AMERICA IN 2O25
- FIGURE 12 JAPAN TO REGISTER HIGHEST GROWTH RATE DURING FORECAST PERIOD
- FIGURE 13 ASIA PACIFIC TO DOMINATE MARKET DURING FORECAST PERIOD
- FIGURE 14 PFAS TESTING MARKET: DRIVERS, RESTRAINTS, OPPORTUNITIES, AND CHALLENGES
- FIGURE 15 PFAS TESTING MARKET: PORTER'S FIVE FORCES ANALYSIS
- FIGURE 16 PFAS TESTING MARKET: VALUE CHAIN ANALYSIS
- FIGURE 17 PFAS TESTING MARKET: ECOSYSTEM ANALYSIS
- FIGURE 18 AVERAGE SELLING PRICE TREND OF PFAS INSTRUMENTS, BY TYPE, 2025 (USD THOUSAND)
- FIGURE 19 AVERAGE SELLING PRICE TREND OF PFAS INSTRUMENTS, BY REGION, 2022-2024 (USD THOUSAND)
- FIGURE 20 IMPORT DATA FOR HS CODE 390460-COMPLIANT PRODUCTS, BY COUNTRY, 2021-2025
- FIGURE 21 EXPORT DATA FOR HS CODE 390460-COMPLIANT PRODUCTS, BY COUNTRY, 2021-2025
- FIGURE 22 TRENDS/DISRUPTIONS INFLUENCING CUSTOMER BUSINESS
- FIGURE 23 PFAS TESTING MARKET: INVESTMENT & FUNDING SCENARIO
- FIGURE 24 PFAS TESTING MARKET: NUMBER OF INVESTOR DEALS, BY KEY PLAYER, 2019-2023 (USD MILLION)
- FIGURE 25 VALUE OF INVESTOR DEALS IN PFAS TESTING MARKET, BY KEY PLAYER, 2019-2023 (USD MILLION)
- FIGURE 26 PATENTS APPLIED AND GRANTED, 2016-2026
- FIGURE 27 INFLUENCE OF STAKEHOLDERS ON BUYING PROCESS
- FIGURE 28 KEY BUYING CRITERIA FOR PFAS TESTING MARKET
- FIGURE 29 NORTH AMERICA: PFAS TESTING MARKET SNAPSHOT
- FIGURE 30 ASIA PACIFIC: PFAS TESTING MARKET SNAPSHOT
- FIGURE 31 REVENUE ANALYSIS OF TOP FIVE PLAYERS IN PFAS TESTING MARKET, 2022-2025
- FIGURE 32 PFAS TESTING MARKET SHARE ANALYSIS OF KEY PLAYERS, 2025
- FIGURE 33 RANKING OF KEY PLAYERS IN PFAS TESTING MARKET FOR TOTAL MARKET, 2025
- FIGURE 34 PFAS TESTING MARKET: COMPANY EVALUATION MATRIX (KEY PLAYERS), 2025
- FIGURE 35 PFAS TESTING MARKET: COMPANY FOOTPRINT
- FIGURE 36 PFAS TESTING MARKET: COMPANY EVALUATION MATRIX (STARTUPS/SMES), 2025
- FIGURE 37 EV/EBITDA OF KEY VENDORS
- FIGURE 38 YEAR-TO-DATE (YTD) PRICE TOTAL RETURN AND 5-YEAR STOCK BETA OF KEY VENDORS
- FIGURE 39 PFAS TESTING MARKET: BRAND/PRODUCT COMPARISON
- FIGURE 40 AGILENT TECHNOLOGIES, INC.: COMPANY SNAPSHOT (2025)
- FIGURE 41 DANAHER CORPORATION: COMPANY SNAPSHOT (2025)
- FIGURE 42 WATERS CORPORATION: COMPANY SNAPSHOT (2025)
- FIGURE 43 THERMO FISHER SCIENTIFIC INC.: COMPANY SNAPSHOT (2025)
- FIGURE 44 SHIMADZU CORPORATION: COMPANY SNAPSHOT (2025)
- FIGURE 45 MERCK KGAA: COMPANY SNAPSHOT (2025)
- FIGURE 46 LGC LIMITED: COMPANY SNAPSHOT (2025)
- FIGURE 47 BIOTAGE: COMPANY SNAPSHOT (2024)
- FIGURE 48 PFAS TESTING MARKET: RESEARCH DESIGN
- FIGURE 49 PFAS TESTING MARKET: KEY SECONDARY SOURCES
- FIGURE 50 PFAS TESTING MARKET: KEY DATA FROM SECONDARY SOURCES
- FIGURE 51 PFAS TESTING MARKET: KEY PRIMARY SOURCES (DEMAND AND SUPPLY SIDES)
- FIGURE 52 PFAS TESTING MARKET: KEY SUPPLY- AND DEMAND-SIDE PARTICIPANTS
- FIGURE 53 BREAKDOWN OF PRIMARY INTERVIEWS: BY COMPANY TYPE, DESIGNATION, AND REGION
- FIGURE 54 PFAS TESTING MARKET: KEY INSIGHTS FROM PRIMARY EXPERTS
- FIGURE 55 RESEARCH METHODOLOGY: HYPOTHESIS BUILDING
- FIGURE 56 PFAS TESTING MARKET: COMPANY REVENUE ESTIMATION, 2025
- FIGURE 57 PFAS TESTING MARKET: MARKET SIZE ESTIMATION METHODOLOGY
- FIGURE 58 DATA TRIANGULATION

 PFAS替代品市場預測至2034年-按產品類型、技術、應用、形態、最終用戶、法規遵循和地區分類的全球分析
 高純度PFA樹脂市場規模、佔有率和成長分析:按等級、形態、應用、最終用戶、純度等級和地區分類-2026-2033年產業預測
 PFAS 的法規、替代技術和移除/銷毀技術(2027-2037 年)
 高純度PFA球形密封環市場分析及至2035年預測:類型、產品、技術、組件、應用、材料類型、製程、最終用戶、安裝類型、設備PFAS 替代品的市場規模、市場佔有率和成長率;全球產業分析;區域分析;以及未來預測(2026-2034 年)。
 PFAS過濾市場:依技術、應用、最終用戶、國家及地區分類-全球產業分析、市場規模、市場佔有率及2026年至2033年預測
 PFAS 處理市場:市場規模、佔有率和趨勢分析(按技術、解決方案、最終用途和地區分類),細分市場預測(2026-2033 年)
 PFAS檢測市場規模、佔有率和成長分析:按檢測類型、檢體類型、技術、應用、最終用戶和地區分類-2026-2033年產業預測PFAS檢測市場分析及預測(至2035年):類型、產品類型、服務、技術、應用、最終用戶、形式、組件、解決方案全球 PFAS 市場、PFAS 監管、PFAS 替代品及 PFAS 修復技術(2026-2036 年)