

|
市場調查報告書
商品編碼
2066270
全球電子鼻市場:依偵測類型、感測器類型、應用、終端用戶產業和地區分類-預測至2032年E-nose Market by Application (Quality Control, Quality Assurance), Inspection Type (Inline, Laboratory), Sensor Type (MOS Sensors, Polymer Sensors, Optical Sensors, QCM Sensors, SQW Sensors), and End Use Industry - Global Forecast to 2032 |
|||||||
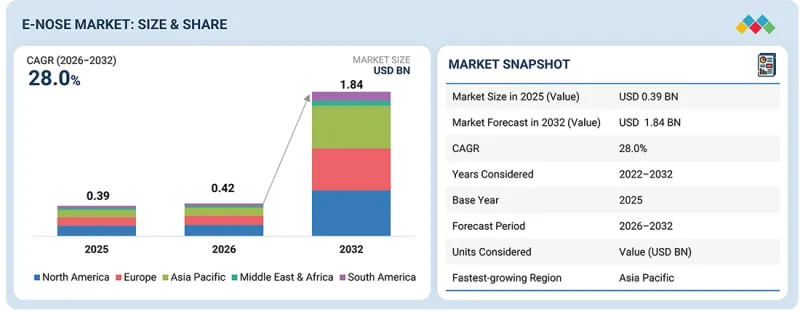
據估計,電子鼻市場在 2026 年的價值為 4.2 億美元,預計到 2032 年將達到 18.4 億美元。
預測期內的複合年成長率預計為 28.0%。
| 調查範圍 | |
|---|---|
| 調查期 | 2021-2032 |
| 基準年 | 2025 |
| 預測期 | 2026-2032 |
| 計算單位 | 金額(10億美元) |
| 部分 | 按檢測類型、感測器類型、應用程式、最終用戶產業和地區分類 |
| 目標區域 | 北美、歐洲、亞太地區及其他地區 |
“主動監測和即時決策的轉變正在推動電子鼻市場的成長。”
主動監測和即時決策的趨勢正在加速電子鼻市場的成長。各行各業都在從被動檢測方法轉向持續氣味分析和異常早期檢測,旨在提高營運可靠性並減少品質缺陷。電子鼻系統在食品製造、製藥、工業運作和醫療診斷等領域展現出極高的價值,因為它們無需耗時的實驗室分析即可快速識別揮發性有機化合物 (VOC) 的變化和製程偏差。此外,對減少廢棄物、最大限度地減少停機時間和提高可追溯性的日益重視,也推動了整合人工智慧和互聯分析平台的智慧氣味監測解決方案的應用。這種向主動式、數據驅動型監測的轉變預計將創造對數位氣味技術的持續長期的全球需求。
“在預測期內,食品行業預計將實現最高的複合年成長率。”
從終端用戶產業來看,預計在預測期內,食品業將在電子鼻市場中實現最高的複合年成長率。這主要歸因於全球食品供應鏈對自動化品質保證、食品真實性檢驗和即時新鮮度監測的需求日益成長。電子鼻系統正被擴大應用於加工食品、乳製品、飲料、肉類和包裝產品中,用於分析香氣特徵、檢測腐敗、識別污染並保持品質一致性。消費者對安全、優質和可追溯食品的需求不斷成長,加上日益嚴格的食品安全法規,正在加速對人工智慧驅動的氣味檢測技術的投資。感測器性能、預測分析以及與智慧工廠整合方面的持續進步,進一步提高了生產效率,並減少了對傳統實驗室檢測的依賴。預計這些技術和監管方面的變化將使食品業在整個預測期內保持強勁的成長勢頭。
“在預測期內,表面聲波(SAW)感測器領域預計將錄得最高的複合年成長率。”
按感測器類型分類,表面聲波 (SAW) 感測器預計將在預測期內成為電子鼻市場中複合年成長率最高的細分市場,這主要得益於先進感測應用中對高靈敏度、快速響應和低濃度 VOC 檢測能力的需求不斷成長。 SAW 感測器因其卓越的檢測精度、高速訊號處理能力以及在醫療診斷、食品品質監測、工業安全和環境分析中識別複雜氣味特徵的能力而備受關注。其小型化的裝置架構以及與即時監測平台的兼容性使其在下一代數位氣味系統中越來越受歡迎。感測器材料、無線連接和人工智慧訊號分析技術的不斷進步正在進一步提升其性能並擴大其商業性應用。預計這些技術優勢將在整個預測期內加速基於 SAW 的電子鼻解決方案的普及。
“預計到 2026 年,北美將主導醫藥電子鼻市場。”
預計到2026年,北美將在醫藥電子鼻市場佔據最大佔有率,這主要得益於先進分析技術在醫藥品管、生產最佳化和實驗室自動化領域的日益普及。該地區擁有強大的醫藥和生物技術產業基礎、大量的研發投入,以及揮發性有機化合物(VOC)分析在原料檢驗、製程監控和污染評估中日益廣泛的應用。此外,日益嚴格的產品品質和生產一致性監管要求也促使製藥公司採用更快速、數據驅動的分析方法。對數位化實驗室、分析儀器和人工智慧感測技術的持續投資預計將鞏固北美在醫藥電子鼻市場的主導地位。
電子鼻市場由以下幾家主要公司主導:SmartNanotubes Technologies GmbH(德國)、NOZE(加拿大)、Alpha MOS(法國)、The eNose Company(荷蘭)、AIRSENSE Analytics GmbH(德國)、Aryballe Technologies(法國)、Owlstone Ltd(英國)、Scentroid(加拿大)、Sensent LLC(加拿大)和英國)。
調查範圍
本報告對電子鼻市場進行細分,並按應用、檢測類型、感測器類型、終端用戶行業和地區提供預測。報告也探討了市場促進因素、阻礙因素、機會和挑戰。報告對北美、歐洲、亞太、南美以及中東和非洲五大主要地區的市場進行了詳細分析。報告中還包括主要參與者的價值鏈分析和電子鼻生態系統分析。
購買本報告的主要好處
- 分析影響電子鼻市場成長的關鍵促進因素(基於 VOC 的數位嗅覺,用於低溫運輸物流中的自動感官分析和腐敗檢測,以及在預防醫學中檢測微生物組和 VOC 特徵)、阻礙因素(感測器漂移和重新校準的需要)、機遇(預防醫學中基於呼吸的疾病診斷)和挑戰(由於感測器和老化導致的性能劣化,以及缺乏老化的性能。
- 產品/解決方案/創新:深入了解電子鼻市場的未來產品和研發活動。
- 市場趨勢:提供各地區盈利市場的全面資訊。
- 市場多元化:全面了解未開發地區的新電子鼻產品、電子鼻市場的最新趨勢和投資情況。
- 競爭分析:對電子鼻市場主要參與企業的市場佔有率、成長策略和產品/服務進行詳細評估。
目錄
第1章:引言
第2章執行摘要
第3章重要考察
第4章 市場概覽
- 市場動態
- 促進因素
- 抑制因子
- 機會
- 任務
- 未滿足的需求和未開發的領域
- 相互關聯的市場與跨產業機遇
- 一級/二級/三級公司的策略性舉措
第5章 產業趨勢
- 波特五力分析
- 宏觀經濟展望
- 價值鏈分析
- 生態系分析
- 價格分析
- 貿易分析
- 2026-2027 年主要會議和活動
- 影響客戶業務的趨勢/顛覆性因素
- 投資和資金籌措場景
- 案例研究分析
- 美國關稅對2025年電子鼻市場的影響
第6章:技術進步、人工智慧的影響、專利、創新與未來應用
- 主要技術
- 互補技術
- 鄰近技術
- 專利分析
- 未來應用
- 生成式人工智慧對電子鼻產業的影響
- 成功案例和實際應用
第7章:監理與永續性舉措
- 地方法規
- 對永續性的承諾
- 認證、標籤檢視和環境標準
第8章:顧客趨勢與購買行為
- 決策流程
- 買方相關人員和採購評估標準
- 實施障礙和內部挑戰
- 各個終端用戶產業尚未滿足的需求
- 市場盈利
第9章:電子鼻市場(按檢測類型分類)(市場規模及至2031年的預測 - 100萬美元)
- 線上檢測系統
- 檢查室測試系統
第10章:電子鼻市場(按感測器類型分類)(市場規模及至2031年的預測 - 100萬美元)
- 金屬氧化物半導體(MOS)感測器
- 聚合物感測器
- 石英晶體共振器(QCM)感測器
- 表面聲波(SAW)感測器
- 光感應器
- 其他先進感測器
第11章:電子鼻市場(按應用領域分類)(市場規模及至2031年的預測 - 100萬美元)
- 品管(品質管理)
- 品質保證
第12章:電子鼻市場按應用領域分類(市場規模及至2031年的預測 - 100萬美元)
- 食品工業
- 製藥業
- 化工
第13章 電子鼻市場(按地區分類)(市場規模及預測至2031年 - 100萬美元)主要地區和國家的市場潛力及成長模式評估
- 北美洲
- 美國
- 加拿大
- 墨西哥
- 歐洲
- 德國
- 英國
- 法國
- 西班牙
- 義大利
- 其他
- 亞太地區
- 中國
- 日本
- 印度
- 澳洲和紐西蘭
- 其他
- 南美洲
- 巴西
- 阿根廷
- 其他
- 其他地區
- 中東
- 非洲
第14章 競爭格局:影響策略評估、市場佔有率、收入分析、公司定位和主要參與者市場潛力的競爭基準。
- 概述
- 主要參與企業的策略/優勢,2022-2025年
- 2025年市佔率分析
- 品牌/產品對比
- 企業估值矩陣:主要公司,2025 年
第 15 章:公司簡介 - 對電子鼻市場格局中的公司、產品、近期舉措和定位策略進行詳細回顧。
- 主要參與企業
- ALPHA MOS
- ARYBALLE
- AIRSENSE ANALYTICS GMBH
- SENSIGENT LLC
- SMARTNANOTUBES
- SCENTROID
- OLORAMA TECHNOLOGY
- ROBOSCIENTIFIC
- COMON INVENT BV
- PLASMION
第16章調查方法
第18章附錄
The E-nose market is estimated to be valued at USD 0.42 billion in 2026 and is projected to reach USD 1.84 billion by 2032, registering a CAGR of 28.0% during the forecast period.
| Scope of the Report | |
|---|---|
| Years Considered for the Study | 2021-2032 |
| Base Year | 2025 |
| Forecast Period | 2026-2032 |
| Units Considered | Value (USD Billion) |
| Segments | By Sensor Type, Application, End User and Region |
| Regions covered | North America, Europe, APAC, RoW |
"Growing shift toward preventive monitoring and real-time decision-making to drive growth in the E-nose market."
The growing shift toward preventive monitoring and real-time decision-making is accelerating growth in the E-nose market. Industries are increasingly moving from reactive testing approaches toward continuous odor analytics and early anomaly detection to improve operational reliability and reduce quality failures. E-nose systems enable rapid identification of VOC changes and process deviations without requiring time-intensive laboratory analysis, making them valuable across food production, pharmaceuticals, industrial operations, and healthcare diagnostics. Additionally, increasing emphasis on reducing waste, minimizing downtime, and improving traceability is driving the adoption of intelligent odor monitoring solutions integrated with AI and connected analytics platforms. This transition toward proactive and data-driven monitoring is expected to create sustained long-term demand for digital scent technologies globally.
"The food industry segment is expected to register the highest CAGR during the forecast period."
By end-use industry, the food industry segment is expected to register the highest CAGR during the forecast period in the E-nose market, driven by the increasing need for automated quality assurance, food authenticity verification, and real-time freshness monitoring across global food supply chains. E-nose systems are increasingly being adopted to analyze aroma profiles, detect spoilage, identify contamination, and maintain consistency across processed foods, dairy, beverages, meat, and packaged products. Growing consumer demand for safe, premium-quality, and traceable food products, combined with stricter food safety regulations, is accelerating investment in AI-enabled odor inspection technologies. Continuous advancements in sensor performance, predictive analytics, and smart factory integration are further improving production efficiency and reducing dependence on traditional laboratory testing. These technological and regulatory shifts are expected to sustain strong growth momentum for the food industry segment throughout the forecast period.
"The Surface Acoustic Wave (SAW) sensors segment is expected to register the highest CAGR during the forecast period."
By sensor type, the Surface Acoustic Wave (SAW) sensors segment is expected to register the highest CAGR during the forecast period in the E-nose market, driven by the increasing demand for highly sensitive, rapid-response, and low-concentration VOC detection capabilities across advanced sensing applications. SAW sensors are gaining traction due to their superior detection accuracy, fast signal processing, and ability to identify complex odor signatures in healthcare diagnostics, food quality monitoring, industrial safety, and environmental analysis. Their compatibility with miniaturized device architectures and real-time monitoring platforms makes them increasingly attractive for next-generation digital scent systems. Continuous advancements in sensor materials, wireless connectivity, and AI-enabled signal interpretation are further enhancing performance and expanding commercial adoption. These technological advantages are expected to accelerate the deployment of SAW-based E-nose solutions throughout the forecast period.
"North America to dominate the pharmaceutical E-nose market in 2026."
North America is projected to account for the largest market share of the pharmaceutical E-nose market in 2026, driven by increasing adoption of advanced analytical technologies for pharmaceutical quality control, manufacturing optimization, and laboratory automation. The region benefits from a strong pharmaceutical and biotechnology industry base, significant R&D spending, and growing use of VOC analysis for raw material verification, process monitoring, and contamination assessment. In addition, stringent regulatory expectations around product quality and manufacturing consistency are encouraging pharmaceutical companies to adopt faster and more data-driven analytical approaches. Continuous investments in digital laboratories, analytical instrumentation, and AI-enabled sensing technologies are expected to support North America's leadership position in the pharmaceutical E-nose market.
Breakdown of Primaries
Various executives from key organizations operating in the E-nose market were interviewed in-depth, including CEOs, marketing directors, and innovation and technology directors.
- By Company Type: Tier 1 - 40%, Tier 2 - 30%, and Tier 3 - 30%
- By Designation: Directors - 20%, Managers - 10%, and Others - 70%
- By Region: Asia Pacific - 45%, Europe - 22%, North America - 22%, and Rest of the World - 11%
The E-nose market is dominated by SmartNanotubes Technologies GmbH (Germany), NOZE (Canada), Alpha MOS (France), The eNose Company (Netherlands), AIRSENSE Analytics GmbH (Germany), Aryballe Technologies (France), Owlstone Medical Ltd (UK), Scentroid (Canada), Sensigent LLC (US), and RoboScientific (UK).
Study Coverage
The report segments the E-nose market and forecasts its application, inspection type, sensor type, end-use industry, and region. The report also discusses the drivers, restraints, opportunities, and challenges pertaining to the market. It provides a detailed view of the market across five main regions-North America, Europe, Asia Pacific, South America, and the Middle East & Africa. The report includes a value chain analysis of the key players and their competitive analysis of the E-nose ecosystem.
Key Benefits of Buying the Report
- Analysis of key drivers (VOC-based digital olfaction for automated sensory profiling and spoilage detection in cold chain logistics, microbiome and VOC signature detection in preventive healthcare), restraints (Sensor drift and recalibration requirements), opportunities (Breath-based disease diagnostics in preventive healthcare), and challenges (Performance decline with sensor wear and age, lack of standardized VOC detection regulations), influencing the growth of the E-nose market
- Products/Solutions/Innovation: Detailed insights into upcoming products, research, and development activities in the E-nose market
- Market Development: Comprehensive information about lucrative markets across varied regions
- Market Diversification: Exhaustive information about new E-nose in untapped geographies, recent developments, and investments in the E-nose market
- Competitive Assessment: In-depth assessment of market shares and growth strategies, and offerings of leading players offering components of the E-nose market
TABLE OF CONTENTS
1 INTRODUCTION
- 1.1 STUDY OBJECTIVES
- 1.2 MARKET DEFINITION
- 1.3 MARKET SCOPE
- 1.3.1 MARKET SEGMENTATION AND REGIONAL SCOPE
- 1.3.2 INCLUSIONS AND EXCLUSIONS
- 1.3.3 YEARS CONSIDERED
- 1.4 UNIT CONSIDERED
- 1.5 STAKEHOLDERS
2 EXECUTIVE SUMMARY
- 2.1 MARKET HIGHLIGHTS AND KEY INSIGHTS
- 2.2 KEY MARKET PARTICIPANTS: MAPPING OF STRATEGIC DEVELOPMENTS
- 2.3 DISRUPTIVE TRENDS IN E-NOSE MARKET
- 2.4 HIGH-GROWTH SEGMENTS
- 2.5 REGIONAL SNAPSHOT: MARKET SIZE, GROWTH RATE, AND FORECAST
3 PREMIUM INSIGHTS
4 MARKET OVERVIEW
- 4.1 INTRODUCTION
- 4.2 MARKET DYNAMICS
- 4.2.1 DRIVERS
- 4.2.2 RESTRAINTS
- 4.2.3 OPPORTUNITIES
- 4.2.4 CHALLENGES
- 4.3 UNMET NEEDS AND WHITE SPACES
- 4.4 INTERCONNECTED MARKETS AND CROSS-SECTOR OPPORTUNITIES
- 4.5 STRATEGIC MOVES BY TIER-1/2/3 PLAYERS
5 INDUSTRY TRENDS
- 5.1 PORTER'S FIVE FORCES ANALYSIS
- 5.1.1 INTENSITY OF COMPETITIVE RIVALRY
- 5.1.2 THREAT OF NEW ENTRANTS
- 5.1.3 THREAT OF SUBSTITUTES
- 5.1.4 BARGAINING POWER OF SUPPLIERS
- 5.1.5 BARGAINING POWER OF BUYERS
- 5.2 MACROECONOMIC OUTLOOK
- 5.3 VALUE CHAIN ANALYSIS
- 5.4 ECOSYSTEM ANALYSIS
- 5.5 PRICING ANALYSIS
- 5.6 TRADE ANALYSIS
- 5.7 KEY CONFERENCES & EVENTS IN 2026-2027
- 5.8 TRENDS/DISRUPTIONS IMPACTING CUSTOMER BUSINESS
- 5.9 INVESTMENT AND FUNDING SCENARIO
- 5.10 CASE STUDY ANALYSIS
- 5.11 IMPACT OF 2025 US TARIFF - E-NOSE MARKET
- 5.11.1 INTRODUCTION
- 5.11.2 KEY TARIFF RATES
- 5.11.3 PRICE IMPACT ANALYSIS
- 5.11.4 IMPACT ON COUNTRY/REGION
- 5.11.5 IMPACT ON END-USE INDUSTRIES
6 TECHNOLOGICAL ADVANCEMENTS, AI-DRIVE IMPACT, PATENTS, INNOVATIONS, AND FUTURE APPLICATIONS
- 6.1 KEY TECHNOLOGIES
- 6.2 COMPLEMENTARY TECHNOLOGIES
- 6.3 ADJACENT TECHNOLOGIES
- 6.4 PATENT ANALYSIS
- 6.4.1 LIST OF MAJOR PATENTS PERTAINING TO MARKET
- 6.5 FUTURE APPLICATIONS
- 6.6 IMPACT OF GEN AI ON E-NOSE INDUSTRY
- 6.6.1 INTRODUCTION
- 6.6.2 USE OF GEN AI IN E-NOSE INDUSTRY
- 6.6.3 CASE STUDY ANALYSIS
- 6.6.4 IMPACT ON E-NOSE MARKET
- 6.6.5 ADJACENT ECOSYSTEM WORKING ON GEN AI
- 6.7 SUCCESS STORIES AND REAL-WORLD APPLICATIONS
7 REGULATORY AND SUSTAINABILITY INITIATIVES
- 7.1 REGIONAL REGULATIONS
- 7.2 SUSTAINABILITY INITIATIVES
- 7.3 CERTIFICATIONS, LABELING, & ECO-STANDARDS
8 CUSTOMER LANDSCAPE & BUYER BEHAVIOR
- 8.1 DECISION-MAKING PROCESS
- 8.2 BUYER STAKEHOLDERS AND BUYING EVALUATION CRITERIA
- 8.3 ADOPTION BARRIERS & INTERNAL CHALLENGES
- 8.4 UNMET NEEDS FROM VARIOUS END-USE INDUSTRIES
- 8.5 MARKET PROFITABILITY
9 E-NOSE MARKET, BY INSPECTION TYPE (MARKET SIZE & FORECAST TO 2031 - USD MILLION)
- 9.1 INTRODUCTION
- 9.2 INLINE INSPECTION SYSTEMS
- 9.3 LABORATORY INSPECTION SYSTEMS
10 E-NOSE MARKET, BY SENSOR TYPE (MARKET SIZE & FORECAST TO 2031 - USD MILLION)
- 10.1 INTRODUCTION
- 10.2 METAL OXIDE SEMICONDUCTOR (MOS) SENSORS
- 10.3 POLYMER SENSORS
- 10.4 QUARTZ CRYSTAL MICROBALANCE (QCM) SENSORS
- 10.5 SURFACE ACOUSTIC WAVE (SAW) SENSORS
- 10.6 OPTICAL SENSORS
- 10.7 OTHER ADVANCED SENSORS
11 E-NOSE MARKET, BY APPLICATION (MARKET SIZE & FORECAST TO 2031 - USD MILLION)
- 11.1 INTRODUCTION
- 11.2 QUALITY CONTROL (QUALITY MANAGEMENT)
- 11.3 QUALITY ASSURANCE
12 E-NOSE MARKET, BY END USE INDUSTRY (MARKET SIZE & FORECAST TO 2031 - USD MILLION)
- 12.1 INTRODUCTION
- 12.2 FOOD INDUSTRY
- 12.2.1 MEAT
- 12.2.2 POULTRY
- 12.2.3 SEAFOOD
- 12.2.4 DAIRY
- 12.2.5 BAKERY
- 12.2.6 CONFECTIONERY
- 12.2.7 CATERING
- 12.2.8 READY-TO-EAT MEALS
- 12.2.9 OTHERS
- 12.3 PHARMACEUTICALS INDUSTRY
- 12.4 CHEMICALS INDUSTRY
12.4.1COSMETICS
- 12.4.2 CHEMICALS
13 E-NOSE MARKET, BY REGION (MARKET SIZE & FORECAST TO 2031 - USD MILLION) ASSESSING MARKET POTENTIAL AND GROWTH PATTERNS ACROSS KEY GEOGRAPHIES AND COUNTRIES
- 13.1 NORTH AMERICA
- 13.1.1 US
- 13.1.2 CANADA
- 13.1.3 MEXICO
- 13.2 EUROPE
- 13.2.1 GERMANY
- 13.2.2 UK
- 13.2.3 FRANCE
- 13.2.4 SPAIN
- 13.2.5 ITALY
- 13.2.7 REST OF EUROPE
- 13.3 ASIA PACIFIC
- 13.3.1 CHINA
- 13.3.2 JAPAN
- 13.3.3 INDIA
- 13.3.4 AUSTRALIA & NEW ZEALAND
- 13.3.5 REST OF ASIA PACIFIC
- 13.4 SOUTH AMERICA
- 13.4.1 BRAZIL
- 13.4.2 ARGENTINA
- 13.4.3 REST OF SOUTH AMERICA
- 13.5 REST OF THE WORLD
- 13.5.1 MIDDLE EAST
- 13.5.2 AFRICA
14 COMPETITIVE LANDSCAPE STRATEGIC ASSESSMENT OF LEADING PLAYERS, MARKET SHARE, REVENUE ANALYSIS, COMPANY POSITIONING, AND COMPETITIVE BENCHMARKS INFLUENCING MARKET POTENTIAL
- 14.1 OVERVIEW
- 14.2 KEY PLAYERS STRATEGIES/RIGHT TO WIN, 2022-2025
- 14.4 MARKET SHARE ANALYSIS, 2025
- 14.5 BRAND/PRODUCT COMPARISON
- 14.7 COMPANY EVALUATION MATRIX: KEY PLAYERS, 2025
- 14.7.1 STARS
- 14.7.2 EMERGING LEADERS
- 14.7.3 PERVASIVE PLAYERS
- 14.7.4 PARTICIPANTS
- 14.7.5 COMPANY FOOTPRINT: KEY PLAYERS, 2025
15 COMPANY PROFILES IN-DEPTH REVIEW OF COMPANIES, PRODUCTS, RECENT INITIATIVES, AND POSITIONING STRATEGIES IN THE E-NOSE MARKET LANDSCAPE
- 15.1 KEY PLAYERS
- 15.1.1 ALPHA MOS
- 15.1.2 ARYBALLE
- 15.1.3 AIRSENSE ANALYTICS GMBH
- 15.1.4 SENSIGENT LLC
- 15.1.5 SMARTNANOTUBES
- 15.1.6 SCENTROID
- 15.1.7 OLORAMA TECHNOLOGY
- 15.1.8 ROBOSCIENTIFIC
- 15.1.9 COMON INVENT B.V.
- 15.1.10 PLASMION
16 RESEARCH METHODOLOGY
- 16.1 RESEARCH DATA
- 16.1.1 SECONDARY DATA
- 16.1.1.1 Key data from secondary sources
- 16.1.2 PRIMARY DATA
- 16.1.2.1 Key data from primary sources
- 16.1.2.2 Key industry insights
- 16.1.2.3 Breakdown of primaries
- 16.1.1 SECONDARY DATA
- 16.2 MARKET SIZE ESTIMATION
- 16.2.1 BOTTOM-UP APPROACH
- 16.2.1.1 Approach for capturing market share by bottom-up analysis
- 16.2.2 TOP-DOWN APPROACH
- 16.2.2.2 Approach for capturing market share by top-up analysis
- 16.2.1 BOTTOM-UP APPROACH
- 16.3 MARKET BREAKDOWN AND DATA TRIANGULATION
- 16.4 RESEARCH ASSUMPTIONS
- 16.5 RISK ASSESSMENT
- 16.6 LIMITATIONS
18 APPENDIX
 移動式氣味檢測終端市場預測至2034年:按技術、應用、最終用戶和地區分類的全球分析
 電子鼻市場報告:按類型、技術、終端應用產業和地區分類(2026-2034 年)
 電子鼻市場:按技術、應用、最終用戶和地區分類
 電子鼻市場:按技術、組件、應用和最終用戶分類-2026-2032年全球市場預測
 2026年全球電子鼻市場報告
 攜帶式氣味感測器:全球市場佔有率及排名、總收入及需求預測(2025-2031年)
 電子鼻:市場佔有率分析、產業趨勢、統計數據、成長預測(2025-2030)
 全球氣味感測器市場
 氣味感測器市場機會、成長動力、產業趨勢分析與 2025 - 2034 年預測
 全球電子鼻市場規模(按技術、最終用戶、地區、範圍和預測)