


 |
市場調查報告書
商品編碼
1826559
全球儲罐液位監測系統市場(按技術、產品、流體類型、組件和最終用戶分類)- 預測至 2030 年Tank Level Monitoring System Market by Technology, Product, Fluid Type, Component, End User - Global Forecast to 2030 |
||||||
預計 2025 年全球儲罐液位監測系統市場價值將達到 10.7 億美元,到 2030 年預計將達到 14.5 億美元,複合年成長率為 6.4%。
| 調查範圍 | |
|---|---|
| 調查年份 | 2021-2030 |
| 基準年 | 2024 |
| 預測期 | 2025-2030 |
| 單元 | 10億美元 |
| 部分 | 技術、產品、流體類型、組件、地區 |
| 目標區域 | 北美、歐洲、亞太地區和其他地區 |
全球儲罐液位監測系統市場在各行各業呈現穩定成長態勢,這得益於市場對精準可靠的自動化液位測量日益成長的需求。儲罐液位監測系統被公認為安全高效流體管理的關鍵推動因素,預計隨著石油和燃料、化學、水和污水處理、農業、發電以及食品和飲料等行業的應用日益廣泛,該市場將實現顯著成長。對即時監控、法規遵循和營運效率的需求正在加速全球部署。儲罐液位監測系統對於確保流程連續性、防止溢流和短缺以及支援燃料、化學品和其他液體的安全儲存至關重要。
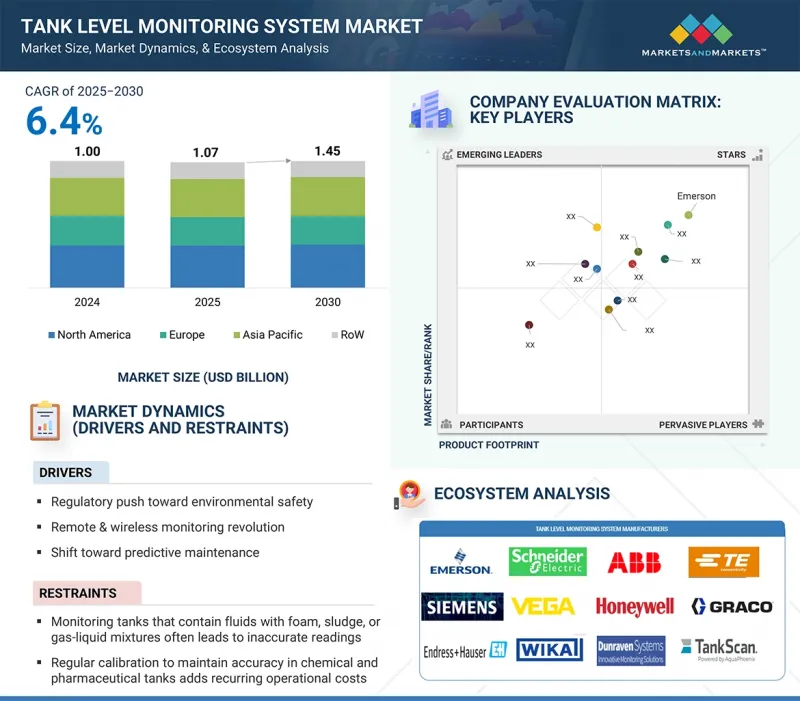
工業和市政領域對智慧基礎設施、數位轉型和自動化的投資不斷增加,將進一步推動市場擴張。物聯網感測器、無線連接和雲端基礎平台的日益普及,使得遠端監控、預測性維護和庫存管理得以改善。雷達、超音波和雷射感測器的技術創新正在提高準確性、可靠性以及對各種儲存環境的適應性。同時,需求正轉向客製化、特定應用的解決方案,從石油接收站的危險液體監控到食品和製藥應用中的衛生系統。對永續性、環境合規性和成本最佳化的日益關注,進一步推動了應用的普及。
“浮子和捲尺測量技術在 2024 年佔據了相當大的市場佔有率。”
到2024年,浮子和捲尺計量系統將在儲罐液位監測系統市場佔據重要佔有率,尤其是在尋求經濟高效且可靠的散裝液體計量解決方案的行業。由於其設計簡潔、機械可靠性高且精度高,該技術將繼續廣泛應用於石油和燃料、化學品、水處理和農業領域的大型儲存槽。浮子和捲尺計量系統以其耐用性和易於操作而聞名,即使在電力或數位基礎設施有限的偏遠地區也能提供穩定的測量。它們能夠承受惡劣的工業環境,並且無需複雜的校準即可提供可靠的讀數,這使得它們對管理燃料和溶劑等液體商品的設施尤其具有吸引力。機械設計、耐腐蝕材料以及與數位讀數計數器整合的進步,提高了這些系統的使用壽命和功能,確保它們能夠與新興電子技術一起持續發揮作用。此外,低廉的安裝和維護成本以及與各種儲罐類型的兼容性,使它們在工業和市政應用中越來越具有吸引力。隨著全球對安全高效倉儲管理的需求日益成長,浮子和捲尺計量系統仍然是尋求兼顧簡便性、準確性和成本效益的營運商的首選。其良好的績效和適應性鞏固了其在儲罐液位監測系統市場中作為關鍵技術領域的地位。
“化學工業將在儲罐液位監測系統市場中見證顯著的複合年成長率。”
由於敏感環境下對準確、安全、可靠的液體儲存管理的需求日益成長,預計預測期內,儲罐液位監測系統市場的化學品終端用戶細分市場將實現顯著的複合年成長率。化工廠處理各種腐蝕性、毒性和揮發性物質,需要監測系統來確保準確性、合規性和操作安全性。此細分市場的儲罐液位監測解決方案旨在承受腐蝕性介質、極端溫度和加壓條件,確保散裝儲存、混合和配送過程中的不間斷性能。先進的監測技術有助於防止溢流、洩漏和污染風險,同時使操作員能夠管理庫存並最佳化流程效率。
本報告分析了全球儲罐液位監測系統市場,提供了關鍵促進因素和限制因素、競爭格局和未來趨勢的資訊。
目錄
第1章 引言
第2章調查方法
第3章執行摘要
第4章 主要發現
- 儲罐液位監測系統市場充滿機遇
- 儲罐液位監測系統市場(依產品)
- 儲罐液位監測系統市場(按技術)
- 最終用戶儲罐液位監測系統市場
- 儲罐液位監測系統市場(依流體類型)
- 儲罐液位監測系統市場(按組件)
- 各國儲罐液位監測系統市場
第5章 市場概況
- 介紹
- 市場動態
- 驅動程式
- 抑制因素
- 機會
- 任務
- 價值鏈分析
- 生態系分析
- 定價分析
- 價格趨勢:主要企業
- 價格趨勢:按類型
- 價格趨勢:按地區
- 影響客戶業務的趨勢/中斷
- 案例研究分析
- 貿易分析
- 進口資料(HS編碼902610)
- 出口資料(HS編碼902610)
- 專利分析
- 監管格局
- 監管機構、政府機構和其他組織
- 法規結構
- 人工智慧/生成式人工智慧對儲罐液位監測系統市場的影響
- 介紹
- 影響分析
- 主要用例和市場潛力
- 2025年美國關稅對儲罐液位監測系統市場的影響
- 介紹
- 主要關稅稅率
- 價格影響分析
- 對國家的影響
- 對終端產業的影響
第 6 章儲罐液位監測系統(依流體分類)
- 介紹
- 儲罐液位監測系統:依液體類型
- 燃料
- 油
- 水
- 化學
- 其他流體類型
第7章儲罐液位監測系統市場(依組件)
- 介紹
- 感應器
- 追蹤設備
- 電源
- 監控站
第 8 章 最終使用者的儲罐液位監測系統
- 介紹
- 石油/燃料
第9章儲罐液位監測系統市場(依產品)
- 介紹
- 侵襲型
- 非侵入性
第 10 章儲罐液位監測系統市場(按技術)
- 介紹
- 浮子/捲尺
- 電導率水平監測
- 超音波液位監測
- 電容式液位監測
- 基於雷達的液位監測
- 其他技術
- 資料傳輸
第11章儲罐液位監測系統(按地區)
- 介紹
- 北美洲
- 北美微觀經濟展望
- 美國
- 加拿大
- 墨西哥
- 歐洲
- 歐洲微觀經濟展望
- 英國
- 德國
- 法國
- 其他歐洲國家
- 亞太地區
- 亞太宏觀經濟展望
- 中國
- 日本
- 印度
- 韓國
- 其他亞太地區
- 其他地區
- 非洲
- 中東
- 南美洲
第12章 競爭格局
- 介紹
- 主要參與企業的策略/優勢(2023-2025)
- 收益分析(2020-2024)
- 市佔率分析(2024年)
- 企業評估矩陣:主要企業(2024年)
- 公司評估矩陣:Start-Ups/中小企業(2024 年)
- 競爭場景
第13章:公司簡介
- 主要企業
- EMERSON ELECTRIC CO.
- HONEYWELL INTERNATIONAL INC.
- SIEMENS
- ENDRESS+HAUSER GROUP SERVICES AG
- SCHNEIDER ELECTRIC
- GRACO INC.
- DG INTERNATIONAL INC
- OTODATA WIRELESS NETWORK
- VEGA
- PIUSI SPA
- GAUGING SYSTEMS INC.
- BANNER ENGINEERING CORP.
- THE VEEDER-ROOT COMPANY
- VAREC, INC.
- OMNTEC MFG., INC.
- 其他公司
- PNEUMERCATOR
- SKYBITZ INC.
- ROCHESTER SENSORS
- RUGGED TELEMETRY
- PULSA
- SCHMITT INDUSTRIES INC.
- ORIEL SYSTEMS LIMITED
- MOPEKA PRODUCTS, LLC
- TANKSCAN
- INPRO GROUP
第14章 附錄
The global tank level monitoring system market was valued at USD 1.07 billion in 2025 and is projected to reach USD 1.45 billion by 2030, registering a CAGR of 6.4%.
| Scope of the Report | |
|---|---|
| Years Considered for the Study | 2021-2030 |
| Base Year | 2024 |
| Forecast Period | 2025-2030 |
| Units Considered | Value (USD Billion) |
| Segments | By Technology, Product, Fluid Type, Component and Region |
| Regions covered | North America, Europe, APAC, RoW |
The global tank level monitoring system market is witnessing steady growth, supported by rising demand for accurate, reliable, and automated liquid level measurement across industries. Valued as a vital enabler of safe and efficient fluid management, the market is projected to grow significantly, driven by increasing adoption in sectors such as oil & fuel, chemicals, water & wastewater, agriculture, power generation, and food & beverages. The need for real-time monitoring, regulatory compliance, and operational efficiency is accelerating deployment worldwide. Tank level monitoring systems are critical in ensuring process continuity, preventing overflows or shortages, and supporting safe storage of fuels, chemicals, and other liquids.
Rising investments in smart infrastructure, digital transformation, and automation across industrial and municipal sectors further boost market expansion. The growing use of IoT-enabled sensors, wireless connectivity, and cloud-based platforms enables remote monitoring, predictive maintenance, and improved inventory control. Technological innovations in radar, ultrasonic, and laser-based sensors have enhanced accuracy, reliability, and adaptability across diverse storage environments. At the same time, demand is shifting toward customized, application-specific solutions from hazardous liquid monitoring in oil terminals to hygienic systems in food and pharmaceutical applications. The increasing focus on sustainability, environmental compliance, and cost optimization further drives adoption.
"Float and tape gauging technology held significant market share in 2024"
Float and tape gauging systems accounted for a notable share of the tank level monitoring system market in 2024, particularly in industries requiring cost-effective and dependable solutions for bulk liquid measurement. This technology continues to be widely adopted due to its straightforward design, mechanical reliability, and proven accuracy in large storage tanks used across oil & fuel, chemicals, water utilities, and agriculture. Known for their durability and ease of operation, float and tape systems provide consistent measurement even in remote locations with limited power or digital infrastructure. Their ability to withstand harsh industrial environments and deliver reliable readings without complex calibration makes them particularly attractive for facilities managing fuels, solvents, and other liquid commodities. Advancements in mechanical design, corrosion-resistant materials, and integration with digital readouts have enhanced the longevity and functionality of these systems, ensuring continued relevance alongside emerging electronic technologies. Furthermore, their lower installation and maintenance costs and compatibility across various tank types strengthen their appeal in industrial and municipal applications. As global demand for secure and efficient storage management grows, float and tape gauging systems remain preferred for operators seeking a balance of simplicity, accuracy, and cost efficiency. Their proven track record and adaptability reinforce their role as a critical technology segment within the tank level monitoring system market.
"Chemicals industry to exhibit significant CAGR in tank level monitoring system market"
The chemical end-user segment of the tank level monitoring system market is projected to record a significant CAGR during the forecast period, driven by the growing need for accurate, safe, and reliable liquid storage management in highly sensitive environments. Chemical plants handle diverse corrosive, toxic, and volatile substances, necessitating monitoring systems that ensure precision, compliance, and operational safety. Tank level monitoring solutions in this sector are designed to withstand aggressive media, extreme temperatures, and pressurized conditions, ensuring uninterrupted performance in bulk storage, blending, and distribution processes. Advanced monitoring technologies help prevent overflows, leakages, and contamination risks while enabling operators to control inventories and optimize process efficiency. The segment benefits from increasing global chemical production, rising safety regulations, and stricter environmental compliance standards. Applications extend across specialty chemicals, petrochemicals, agrochemicals, and pharmaceutical intermediates, where continuous and accurate monitoring is mission-critical. Recent innovations, such as corrosion-resistant sensor materials, non-contact radar, and ultrasonic technologies, and integration with IoT-enabled platforms, are enhancing durability and enabling real-time remote supervision. These developments improve reliability and support predictive maintenance and risk mitigation. As the chemical industry expands worldwide, tank level monitoring systems will play a vital role in ensuring safe storage, regulatory adherence, and operational continuity, positioning this segment as one of the fastest-growing contributors to overall market growth.
"Fuel segment accounted for significant market share in 2024"
The fuel fluid type segment held a substantial share of the tank level monitoring system market in 2024 and is expected to maintain strong momentum during the forecast period. Rising global demand for petroleum products, coupled with the need for efficient storage and distribution, has accelerated the adoption of advanced monitoring solutions in this category. Fuel tanks, widely used in refineries, fuel stations, aviation depots, and large-scale transportation hubs, require continuous and precise measurements to ensure uninterrupted operations and prevent costly discrepancies. Monitoring systems in this segment are tailored to manage diverse fuels such as gasoline, diesel, aviation turbine fuel, and biodiesel blends with high accuracy and reliability. The segment benefits from the growing expansion of global logistics, aviation, and automotive industries, which depend heavily on secure and transparent fuel management. The integration of tank monitoring with digital inventory control systems helps operators streamline supply chains, reduce wastage, and enhance profitability. Recent advancements such as wireless telemetry, cloud-based dashboards, and ATEX/IECEx-certified monitoring devices have increased safety and enabled remote visibility, even in hazardous or high-risk environments. Additionally, the emphasis on preventing fuel theft, minimizing losses, and adhering to international quality standards reinforces demand for these solutions. As global energy consumption continues to expand, particularly in emerging economies, the fuel segment is positioned to remain a key revenue contributor to the tank level monitoring system market, backed by its critical role in ensuring efficiency, transparency, and operational reliability.
Extensive primary interviews were conducted with key industry experts in the tank level monitoring system market space to determine and verify the market size for various segments and subsegments gathered through secondary research. The breakdown of primary participants for the report is shown below.
The study contains insights from various industry experts, from component suppliers to Tier 1 companies and OEMs. The break-up of the primaries is as follows:
- By Company Type: Tier 1 - 25%, Tier 2 - 45%, and Tier 3 - 30%
- By Designation: Directors - 20%, C-level Executives - 50%, and Others - 30%
- By Region: Asia Pacific - 35%, Europe - 25%, North America - 30%, and RoW - 10%
Notes: RoW comprises the Middle East, Africa, and South America.
Other designations include product managers, sales managers, and marketing managers.
Three tiers of companies have been defined based on their total revenue as of 2024: tier 3: revenue less than USD 500 million; tier 2: revenue between USD 500 million and USD 1 billion; and tier 1: revenue more than USD 1 billion.
The tank level monitoring system market is dominated by a few globally established players, such as Emerson Electric Co. (US), Schneider Electric (France), Siemens (Germany), Honeywell International Inc. (US), TE Connectivity (Switzerland), and ABB (Switzerland). The study includes an in-depth competitive analysis of these key players, with their company profiles, recent developments, and key market strategies.
Research Coverage:
The report segments the tank level monitoring system market and forecasts its size by technology (float & tape gauging, conductivity level monitoring, ultrasonic level monitoring, capacitance level monitoring, radar-based level monitoring, data transmission), by product (invasive type, non-invasive type), By component (sensors, tracking device, power supply, monitoring stations), by fluid type (fuel, oil, water, chemical, other fluid), by end users (oil & fuel, chemicals, energy & power, mining, automotive, agriculture & husbandry, other industries). The report includes a supply chain analysis of the key players and their competitive analysis in the tank level monitoring system ecosystem.
Key Benefits of Buying the Report:
- Analysis of key drivers (regulatory push toward environmental safety, remote & wireless monitoring revolution, shift toward predictive maintenance), restraint (monitoring tanks that contain fluids with foam, sludge, or gas-liquid mixtures often leads to inaccurate readings, regular calibration to maintain accuracy in chemical and pharmaceutical tanks adds recurring operational costs), opportunities (leveraging AI with tank level monitoring system allows companies to automate replenishment cycles), challenges (ensuring stable and reliable wireless or networked communication between devices, especially in large-scale or remote facilities, can be complex).
- Service Development/Innovation: Detailed insights on upcoming technologies, research and development activities, and product launches in the tank level monitoring system market
- Market Development: Comprehensive information about lucrative markets by analyzing across varied regions
- Market Diversification: Exhaustive information about new products and services, untapped geographies, recent developments, and investments in the tank level monitoring system market
- Competitive Assessment: In-depth assessment of market shares, growth strategies, and product and service offerings of leading players, such as Emerson Electric Co. (US), Honeywell International Inc. (US), Endress+Hauser Group Services AG, Siemens (Germany), Schneider Electric (France).
TABLE OF CONTENTS
1 INTRODUCTION
- 1.1 STUDY OBJECTIVES
- 1.2 MARKET DEFINITION
- 1.3 STUDY SCOPE
- 1.3.1 MARKETS COVERED AND REGIONAL SCOPE
- 1.3.2 INCLUSIONS AND EXCLUSIONS
- 1.3.3 YEARS CONSIDERED
- 1.3.4 CURRENCY CONSIDERED
- 1.4 STAKEHOLDERS
- 1.5 SUMMARY OF CHANGES
2 RESEARCH METHODOLOGY
- 2.1 RESEARCH DATA
- 2.1.1 SECONDARY AND PRIMARY RESEARCH
- 2.1.2 SECONDARY DATA
- 2.1.2.1 List of key secondary sources
- 2.1.2.2 Key data from secondary sources
- 2.1.3 PRIMARY DATA
- 2.1.3.1 List of primary interview participants
- 2.1.3.2 Key data from primary sources
- 2.1.3.3 Key industry insights
- 2.1.3.4 Breakdown of interviews with experts
- 2.2 MARKET SIZE ESTIMATION METHODOLOGY
- 2.2.1 BOTTOM-UP APPROACH
- 2.2.1.1 Approach to estimate market size using bottom-up analysis
- 2.2.2 TOP-DOWN APPROACH
- 2.2.2.1 Approach to estimate market size using top-down analysis
- 2.2.1 BOTTOM-UP APPROACH
- 2.3 DATA TRIANGULATION
- 2.4 RESEARCH ASSUMPTIONS
- 2.5 RESEARCH LIMITATIONS
3 EXECUTIVE SUMMARY
4 PREMIUM INSIGHTS
- 4.1 ATTRACTIVE OPPORTUNITIES IN TANK LEVEL MONITORING SYSTEM MARKET
- 4.2 TANK LEVEL MONITORING SYSTEM MARKET, BY PRODUCT
- 4.3 TANK LEVEL MONITORING SYSTEM MARKET, BY TECHNOLOGY
- 4.4 TANK LEVEL MONITORING SYSTEM MARKET, BY END USER
- 4.5 TANK LEVEL MONITORING SYSTEM MARKET, BY FLUID TYPE
- 4.6 TANK LEVEL MONITORING SYSTEM MARKET, BY COMPONENT
- 4.7 TANK LEVEL MONITORING SYSTEM MARKET, BY COUNTRY
5 MARKET OVERVIEW
- 5.1 INTRODUCTION
- 5.2 MARKET DYNAMICS
- 5.2.1 DRIVERS
- 5.2.1.1 Rising adoption of remote & wireless monitoring
- 5.2.1.2 Rising importance of predictive maintenance in enhancing monitoring efficiency
- 5.2.1.3 Environmental safety compliance through advanced monitoring
- 5.2.2 RESTRAINTS
- 5.2.2.1 Complex fluid conditions causing measurement limitations
- 5.2.2.2 Operational overheads from regular calibration in sensitive industries
- 5.2.3 OPPORTUNITIES
- 5.2.3.1 AI-integrated systems to streamline replenishment and strengthen supply chain reliability
- 5.2.3.2 Decentralized monitoring-as-a-service (MaaS) driving flexible adoption
- 5.2.4 CHALLENGES
- 5.2.4.1 Stable and reliable communication between devices
- 5.2.1 DRIVERS
- 5.3 VALUE CHAIN ANALYSIS
- 5.4 ECOSYSTEM ANALYSIS
- 5.5 PRICING ANALYSIS
- 5.5.1 INDICATIVE PRICING TREND, BY KEY PLAYER
- 5.5.2 INDICATIVE PRICING TREND, BY TYPE
- 5.5.3 INDICATIVE PRICING TREND, BY REGION
- 5.6 TRENDS/DISRUPTIONS IMPACTING CUSTOMER BUSINESS
- 5.7 CASE STUDY ANALYSIS
- 5.7.1 CASE STUDY 1: PHILLIPS 66 COMPANY BAYWAY REFINERY TRANSFORMS TANK GAUGING WITH VAREC'S COST-EFFECTIVE RELIABILITY SOLUTION
- 5.7.2 CASE STUDY 2: ENHANCED EFFICIENCY AND SALES WITH AQUAPHOENIX TANKSCAN DIGITAL MONITORING
- 5.7.3 CASE STUDY 3: INNOTEK INCORPORATED TRANSFORMS STRIPPER WELL MONITORING WITH DIGI INTERNATIONAL INC. POWERED OVERWATCH SOLUTION
- 5.7.4 CASE STUDY 4: WESTAIR BOOSTS EFFICIENCY AND CUSTOMER VALUE THROUGH PULSA TANK MONITORING
- 5.7.5 CASE STUDY 5: CHEMICAL TERMINAL ENHANCES SAFETY AND UTILIZATION WITH 2-IN-1 RADAR LEVEL GAUGE FROM EMERSON ELECTRIC CO.
- 5.8 TRADE ANALYSIS
- 5.8.1 IMPORT DATA (HS CODE 902610)
- 5.8.2 EXPORT DATA (HS CODE 902610)
- 5.9 PATENT ANALYSIS
- 5.10 REGULATORY LANDSCAPE
- 5.10.1 REGULATORY BODIES, GOVERNMENT AGENCIES, AND OTHER ORGANIZATIONS
- 5.10.2 REGULATORY FRAMEWORK
- 5.10.2.1 North America
- 5.10.2.1.1 US
- 5.10.2.1.2 Canada
- 5.10.2.2 Europe
- 5.10.2.2.1 European Union
- 5.10.2.2.2 Germany
- 5.10.2.3 Asia Pacific
- 5.10.2.3.1 China
- 5.10.2.3.2 India
- 5.10.2.3.3 Japan
- 5.10.2.3.4 Rest of the World
- 5.10.2.3.5 Brazil
- 5.10.2.1 North America
- 5.11 IMPACT OF AI/GENERATIVE AI ON TANK LEVEL MONITORING SYSTEM MARKET
- 5.11.1 INTRODUCTION
- 5.11.2 IMPACT ANALYSIS
- 5.11.3 TOP USE CASES AND MARKET POTENTIAL
- 5.12 IMPACT OF 2025 US TARIFFS ON TANK LEVEL MONITORING SYSTEM MARKET
- 5.12.1 INTRODUCTION
- 5.12.2 KEY TARIFF RATES
- 5.12.3 PRICE IMPACT ANALYSIS
- 5.12.4 IMPACT ON COUNTRIES/REGIONS
- 5.12.4.1 US
- 5.12.4.2 Europe
- 5.12.4.3 Asia Pacific
- 5.12.5 IMPACT ON END-USE INDUSTRIES
- 5.12.5.1 Oil & Fuel
- 5.12.5.2 Chemicals
6 TANK LEVEL MONITORING SYSTEM, BY FLUID TYPE
- 6.1 INTRODUCTION
- 6.2 TANK LEVEL MONITORING SYSTEM, BY FLUID TYPE
- 6.2.1 FUEL
- 6.2.1.1 Automation regulation and digital innovation to drive market
- 6.2.2 OIL
- 6.2.2.1 Automation compliance and digital technologies to drive market
- 6.2.3 WATER
- 6.2.3.1 Need for sustainable water management to drive intelligent tank monitoring solutions segment
- 6.2.4 CHEMICAL
- 6.2.4.1 Need for enhanced safety and efficiency to drive demand
- 6.2.5 OTHER FLUID TYPES
- 6.2.1 FUEL
7 TANK LEVEL MONITORING SYSTEM MARKET, BY COMPONENT
- 7.1 INTRODUCTION
- 7.2 SENSORS
- 7.2.1 REVOLUTIONIZING INDUSTRIAL TANK MONITORING THROUGH AI-POWERED, CONNECTED, AND PREDICTIVE SENSOR TECHNOLOGIES
- 7.3 TRACKING DEVICES
- 7.3.1 DRIVING OPERATIONAL EFFICIENCY THROUGH IOT-ENABLED TRACKING DEVICES FOR SMARTER TANK ASSET MANAGEMENT
- 7.4 POWER SUPPLY
- 7.4.1 POWERING SMARTER TANK MONITORING WITH ENERGY HARVESTING, WIRELESS TRANSFER, AND SUSTAINABLE BATTERY-FREE SOLUTIONS
- 7.5 MONITORING STATIONS
- 7.5.1 CENTRALIZING TANK INTELLIGENCE WITH SMART MONITORING STATIONS FOR REAL-TIME CONTROL AND ANALYTICS
8 TANK LEVEL MONITORING SYSTEM, BY END USER
- 8.1 INTRODUCTION
- 8.2 OIL & FUEL
- 8.2.1 GOVERNMENT INVESTMENTS AND TECHNOLOGY INNOVATION TO DRIVE DEMAND
- 8.2.2 CHEMICALS
- 8.2.2.1 Rising chemical production and safety regulations to drive demand
- 8.2.3 ENERGY & POWER
- 8.2.3.1 Powering efficiency and resilience with intelligent tank level monitoring in next-generation energy & power sector
- 8.2.4 MINING
- 8.2.4.1 Unlocking mining efficiency and safety with intelligent tank level monitoring systems
- 8.2.5 AUTOMOTIVE
- 8.2.5.1 Automotive innovation and sustainability to drive demand
- 8.2.6 AGRICULTURE & HUSBANDRY
- 8.2.6.1 Empowering modern farming operations with precision tank monitoring for water and feed management
- 8.2.7 OTHER END USERS
9 TANK LEVEL MONITORING SYSTEM MARKET, BY PRODUCT
- 9.1 INTRODUCTION
- 9.2 INVASIVE TYPE
- 9.2.1 DRIVING INDUSTRIAL PRECISION AND SAFETY WITH ADVANCED INVASIVE TANK LEVEL MONITORING SYSTEMS
- 9.3 NON-INVASIVE TYPE
- 9.3.1 ADVANCING INDUSTRIAL EFFICIENCY AND SAFETY WITH SMART NON-INVASIVE TANK LEVEL MONITORING SYSTEMS
10 TANK LEVEL MONITORING SYSTEM MARKET, BY TECHNOLOGY
- 10.1 INTRODUCTION
- 10.2 FLOAT & TAPE GAUGING
- 10.2.1 FLOAT & TAPE GAUGING DELIVERS RELIABLE, ACCURATE, AND COST-EFFECTIVE TANK MEASUREMENT
- 10.3 CONDUCTIVITY LEVEL MONITORING
- 10.3.1 LEVEL MONITORING TECHNOLOGY DELIVERS RELIABLE, ACCURATE, AND MAINTENANCE-FREE LIQUID MEASUREMENT
- 10.4 ULTRASONIC LEVEL MONITORING
- 10.4.1 ULTRASONIC LEVEL MONITORING DELIVERS PRECISION EFFICIENCY AND SMART NON-CONTACT TANK MEASUREMENT
- 10.5 CAPACITANCE LEVEL MONITORING
- 10.5.1 CAPACITANCE LEVEL MONITORING DRIVES PRECISION, RELIABILITY, AND SMART CONTINUOUS TANK INSIGHTS
- 10.6 RADAR-BASED LEVEL MONITORING
- 10.6.1 RADAR-BASED LEVEL MONITORING DELIVERS SMART, PRECISE, AND RELIABLE TANK INSIGHTS FOR CRITICAL OPERATIONS
- 10.7 OTHER TECHNOLOGIES
- 10.8 DATA TRANSMISSION
- 10.8.1 CELLULAR DATA TRANSMISSION TECHNOLOGY PREFERRED FOR ITS LOW COST AND EASY INSTALLATION
11 TANK LEVEL MONITORING SYSTEM, BY REGION
- 11.1 INTRODUCTION
- 11.2 NORTH AMERICA
- 11.2.1 MICROECONOMIC OUTLOOK FOR NORTH AMERICA
- 11.2.2 US
- 11.2.2.1 Precision performance and profitability tank monitoring catalyzes industrial innovation in America
- 11.2.3 CANADA
- 11.2.3.1 Unlocking industrial resilience drives growth in intelligent tank monitoring adoption
- 11.2.4 MEXICO
- 11.2.4.1 From energy strength to manufacturing power, Mexico accelerates tank monitoring adoption
- 11.3 EUROPE
- 11.3.1 MICROECONOMIC OUTLOOK FOR EUROPE
- 11.3.2 UK
- 11.3.2.1 From regulation to innovation, tank monitoring unlocks strategic value
- 11.3.3 GERMANY
- 11.3.3.1 Germany fuels market leadership in tank level monitoring systems through industrial innovation
- 11.3.4 FRANCE
- 11.3.4.1 Government's initiatives supporting green energy to drive tank level monitoring demand
- 11.3.5 REST OF EUROPE
- 11.4 ASIA PACIFIC
- 11.4.1 MACROECONOMIC OUTLOOK IN ASIA PACIFIC
- 11.4.2 CHINA
- 11.4.2.1 China powers growth in tank level monitoring with expanding energy and industrial base
- 11.4.3 JAPAN
- 11.4.3.1 Japan accelerates tank monitoring to drive efficiency and carbon neutrality
- 11.4.4 INDIA
- 11.4.4.1 Tank level monitoring systems powering next phase of growth in India's manufacturing and industrial expansion
- 11.4.5 SOUTH KOREA
- 11.4.5.1 South Korea fuels industrial reliability and energy security with next-generation tank level monitoring solutions
- 11.4.6 REST OF ASIA PACIFIC
- 11.5 REST OF WORLD
- 11.5.1 AFRICA
- 11.5.1.1 Government initiatives supporting industrial growth and modernization to stimulate demand
- 11.5.2 MIDDLE EAST
- 11.5.2.1 Accelerating adoption of tank level monitoring systems in industries
- 11.5.3 SOUTH AMERICA
- 11.5.3.1 Rapid industrial growth and increasing investments to drive adoption of tank level monitoring systems
- 11.5.1 AFRICA
12 COMPETITIVE LANDSCAPE
- 12.1 INTRODUCTION
- 12.2 KEY PLAYER STRATEGIES/RIGHT TO WIN, 2023-2025
- 12.3 REVENUE ANALYSIS, 2020-2024
- 12.4 MARKET SHARE ANALYSIS, 2024
- 12.5 COMPANY EVALUATION MATRIX: KEY PLAYERS, 2024
- 12.5.1 STARS
- 12.5.2 EMERGING LEADERS
- 12.5.3 PERVASIVE PLAYERS
- 12.5.4 PARTICIPANTS
- 12.5.5 COMPANY FOOTPRINT: KEY PLAYERS, 2024
- 12.5.5.1 Company footprint
- 12.5.5.2 Region footprint
- 12.5.5.3 End user footprint
- 12.5.5.4 Component footprint
- 12.6 COMPANY EVALUATION MATRIX: STARTUPS/SMES, 2024
- 12.6.1 PROGRESSIVE COMPANIES
- 12.6.2 RESPONSIVE COMPANIES
- 12.6.3 DYNAMIC COMPANIES
- 12.6.4 STARTING BLOCKS
- 12.6.5 COMPETITIVE BENCHMARKING: STARTUPS/SMES, 2024
- 12.6.5.1 Detailed list of key startup/SMEs
- 12.6.5.2 Competitive benchmarking of key startup/SMEs
- 12.7 COMPETITIVE SCENARIO
- 12.7.1 PRODUCT LAUNCHES
- 12.7.2 DEALS
13 COMPANY PROFILES
- 13.1 KEY PLAYERS
- 13.1.1 EMERSON ELECTRIC CO.
- 13.1.1.1 Business overview
- 13.1.1.2 Products offered
- 13.1.1.3 Recent developments
- 13.1.1.3.1 Product launches
- 13.1.1.4 MnM view
- 13.1.1.4.1 Key strengths/Right to win
- 13.1.1.4.2 Strategic choices
- 13.1.1.4.3 Weaknesses/Competitive threats
- 13.1.2 HONEYWELL INTERNATIONAL INC.
- 13.1.2.1 Business overview
- 13.1.2.2 Products offered
- 13.1.2.3 MnM view
- 13.1.2.3.1 Key strengths/Right to win
- 13.1.2.3.2 Strategic choices
- 13.1.2.3.3 Weaknesses/Competitive threats
- 13.1.3 SIEMENS
- 13.1.3.1 Business overview
- 13.1.3.2 Products offered
- 13.1.3.3 MnM view
- 13.1.3.3.1 Key strengths/Right to win
- 13.1.3.3.2 Strategic choices
- 13.1.3.3.3 Weaknesses/Competitive threats
- 13.1.4 ENDRESS+HAUSER GROUP SERVICES AG
- 13.1.4.1 Business overview
- 13.1.4.2 Products offered
- 13.1.4.3 MnM view
- 13.1.4.3.1 Key strengths/Right to win
- 13.1.4.3.2 Strategic choices
- 13.1.4.3.3 Weaknesses/Competitive threats
- 13.1.5 SCHNEIDER ELECTRIC
- 13.1.5.1 Business overview
- 13.1.5.2 Products offered
- 13.1.5.3 Recent developments
- 13.1.5.3.1 Deals
- 13.1.5.4 MnM view
- 13.1.5.4.1 Key strengths/Right to win
- 13.1.5.4.2 Strategic choices
- 13.1.5.4.3 Weaknesses/Competitive threats
- 13.1.6 GRACO INC.
- 13.1.6.1 Business overview
- 13.1.6.2 Products offered
- 13.1.7 DG INTERNATIONAL INC
- 13.1.7.1 Business overview
- 13.1.7.2 Products offered
- 13.1.8 OTODATA WIRELESS NETWORK
- 13.1.8.1 Business overview
- 13.1.8.2 Products offered
- 13.1.8.3 Recent developments
- 13.1.8.3.1 Deals
- 13.1.9 VEGA
- 13.1.9.1 Business overview
- 13.1.9.2 Products offered
- 13.1.9.3 Recent developments
- 13.1.9.3.1 Product launches
- 13.1.10 PIUSI S.P.A
- 13.1.10.1 Business overview
- 13.1.10.2 Products offered
- 13.1.11 GAUGING SYSTEMS INC.
- 13.1.11.1 Business overview
- 13.1.11.2 Products offered
- 13.1.12 BANNER ENGINEERING CORP.
- 13.1.12.1 Business overview
- 13.1.12.2 Products offered
- 13.1.13 THE VEEDER-ROOT COMPANY
- 13.1.13.1 Business overview
- 13.1.13.2 Products offered
- 13.1.13.3 Recent developments
- 13.1.13.3.1 Product launches
- 13.1.14 VAREC, INC.
- 13.1.14.1 Business overview
- 13.1.14.2 Products offered
- 13.1.15 OMNTEC MFG., INC.
- 13.1.15.1 Business overview
- 13.1.15.2 Products offered
- 13.1.1 EMERSON ELECTRIC CO.
- 13.2 OTHER PLAYERS
- 13.2.1 PNEUMERCATOR
- 13.2.2 SKYBITZ INC.
- 13.2.3 ROCHESTER SENSORS
- 13.2.4 RUGGED TELEMETRY
- 13.2.5 PULSA
- 13.2.6 SCHMITT INDUSTRIES INC.
- 13.2.7 ORIEL SYSTEMS LIMITED
- 13.2.8 MOPEKA PRODUCTS, LLC
- 13.2.9 TANKSCAN
- 13.2.10 INPRO GROUP
14 APPENDIX
- 14.1 DISCUSSION GUIDE
- 14.2 KNOWLEDGESTORE: MARKETSANDMARKETS' SUBSCRIPTION PORTAL
- 14.3 CUSTOMIZATION OPTIONS
- 14.4 RELATED REPORTS
- 14.5 AUTHOR DETAILS
List of Tables
- TABLE 1 SUMMARY OF CHANGES
- TABLE 2 LIST OF PRIMARY INTERVIEW PARTICIPANTS
- TABLE 3 TANK LEVEL MONITORING SYSTEM MARKET: RESEARCH ASSUMPTIONS
- TABLE 4 TANK LEVEL MONITORING SYSTEM MARKET: RISK ANALYSIS
- TABLE 5 ROLE OF PLAYERS IN TANK LEVEL MONITORING SYSTEM MARKET
- TABLE 6 INDICATIVE PRICING TREND OF LEVEL SENSORS OFFERED BY KEY PLAYERS (USD), 2021-2024 (USD)
- TABLE 7 INDICATIVE PRICING TREND OF LEVEL SENSORS, BY TYPE, 2021-2024 (USD)
- TABLE 8 INDICATIVE PRICING TREND OF ULTRASONIC LEVEL SENSORS, BY REGION, 2021-2024 (USD)
- TABLE 9 IMPORT DATA FOR HS CODE 902610-COMPLIANT PRODUCTS, BY COUNTRY, 2020-2024 (USD MILLION)
- TABLE 10 EXPORT DATA FOR HS CODE 902610-COMPLIANT PRODUCTS, BY COUNTRY, 2020-2024 (USD MILLION)
- TABLE 11 TANK LEVEL MONITORING SYSTEM MARKET: LIST OF KEY PATENTS, 2024
- TABLE 12 NORTH AMERICA: LIST OF REGULATORY BODIES, GOVERNMENT AGENCIES, AND OTHER ORGANIZATIONS
- TABLE 13 EUROPE: LIST OF REGULATORY BODIES, GOVERNMENT AGENCIES, AND OTHER ORGANIZATIONS
- TABLE 14 ASIA PACIFIC: LIST OF REGULATORY BODIES, GOVERNMENT AGENCIES, AND OTHER ORGANIZATIONS
- TABLE 15 REST OF THE WORLD: LIST OF REGULATORY BODIES, GOVERNMENT AGENCIES, AND OTHER ORGANIZATIONS
- TABLE 16 STANDARDS RELATED TO LEVEL SENSORS
- TABLE 17 US-ADJUSTED RECIPROCAL TARIFF RATES
- TABLE 18 TANK LEVEL MONITORING SYSTEM MARKET, BY FLUID TYPE, 2021-2024 (USD MILLION)
- TABLE 19 TANK LEVEL MONITORING SYSTEM MARKET, BY FLUID TYPE, 2025-2030 (USD MILLION)
- TABLE 20 TANK LEVEL MONITORING SYSTEM MARKET, BY COMPONENT, 2021-2024 (USD MILLION)
- TABLE 21 TANK LEVEL MONITORING SYSTEM MARKET, BY COMPONENT, 2025-2030 (USD MILLION)
- TABLE 22 TANK LEVEL MONITORING SYSTEM MARKET, BY END USER, 2021-2024 (USD MILLION)
- TABLE 23 TANK LEVEL MONITORING SYSTEM MARKET, BY END USER, 2025-2030 (USD MILLION)
- TABLE 24 OIL & FUEL: TANK LEVEL MONITORING SYSTEM MARKET, BY REGION, 2021-2024 (USD MILLION)
- TABLE 25 OIL & FUEL: TANK LEVEL MONITORING SYSTEM MARKET, BY REGION, 2025-2030 (USD MILLION)
- TABLE 26 NORTH AMERICA: OIL & FUEL TANK LEVEL MONITORING SYSTEM MARKET, BY COUNTRY, 2021-2024 (USD MILLION)
- TABLE 27 NORTH AMERICA: OIL & FUEL TANK LEVEL MONITORING SYSTEM MARKET, BY COUNTRY, 2025-2030 (USD MILLION)
- TABLE 28 EUROPE: OIL & FUEL TANK LEVEL MONITORING SYSTEM MARKET, BY COUNTRY, 2021-2024 (USD MILLION)
- TABLE 29 EUROPE: OIL & FUEL TANK LEVEL MONITORING SYSTEM MARKET, BY COUNTRY, 2025-2030 (USD MILLION)
- TABLE 30 ASIA PACIFIC: OIL & FUEL TANK LEVEL MONITORING SYSTEM MARKET, BY COUNTRY, 2021-2024 (USD MILLION)
- TABLE 31 ASIA PACIFIC: OIL & FUEL TANK LEVEL MONITORING SYSTEM MARKET, BY COUNTRY, 2025-2030 (USD MILLION)
- TABLE 32 ROW: OIL & FUEL TANK LEVEL MONITORING SYSTEM MARKET, BY REGION, 2021-2024 (USD MILLION)
- TABLE 33 ROW: OIL & FUEL TANK LEVEL MONITORING SYSTEM MARKET, BY REGION, 2025-2030 (USD MILLION)
- TABLE 34 CHEMICALS: TANK LEVEL MONITORING SYSTEM MARKET, BY REGION, 2021-2024 (USD MILLION)
- TABLE 35 CHEMICALS: TANK LEVEL MONITORING SYSTEM MARKET, BY REGION, 2025-2030 (USD MILLION)
- TABLE 36 NORTH AMERICA: CHEMICALS TANK LEVEL MONITORING SYSTEM MARKET, BY COUNTRY, 2021-2024 (USD MILLION)
- TABLE 37 NORTH AMERICA: CHEMICALS TANK LEVEL MONITORING SYSTEM MARKET, BY COUNTRY, 2025-2030 (USD MILLION)
- TABLE 38 EUROPE: CHEMICALS TANK LEVEL MONITORING SYSTEM MARKET, BY COUNTRY 2021-2024 (USD MILLION)
- TABLE 39 EUROPE: CHEMICALS TANK LEVEL MONITORING SYSTEM MARKET, BY COUNTRY, 2025-2030 (USD MILLION)
- TABLE 40 ASIA PACIFIC: CHEMICALS TANK LEVEL MONITORING SYSTEM MARKET, BY COUNTRY, 2021-2024 (USD MILLION)
- TABLE 41 ASIA PACIFIC: CHEMICALS TANK LEVEL MONITORING SYSTEM MARKET, BY COUNTRY, 2025-2030 (USD MILLION)
- TABLE 42 ROW: CHEMICALS TANK LEVEL MONITORING SYSTEM MARKET, BY REGION, 2021-2024 (USD MILLION)
- TABLE 43 ROW: CHEMICALS TANK LEVEL MONITORING SYSTEM MARKET, BY REGION, 2025-2030 (USD MILLION)
- TABLE 44 ENERGY & POWER: TANK LEVEL MONITORING SYSTEM MARKET, BY REGION, 2021-2024 (USD MILLION)
- TABLE 45 ENERGY & POWER: TANK LEVEL MONITORING SYSTEM MARKET, BY REGION, 2025-2030 (USD MILLION)
- TABLE 46 NORTH AMERICA: ENERGY & POWER TANK LEVEL MONITORING SYSTEM MARKET, BY COUNTRY, 2021-2024 (USD MILLION)
- TABLE 47 NORTH AMERICA: ENERGY & POWER TANK LEVEL MONITORING SYSTEM MARKET, BY COUNTRY, 2025-2030 (USD MILLION)
- TABLE 48 EUROPE: ENERGY & POWER TANK LEVEL MONITORING SYSTEM MARKET, BY COUNTRY, 2021-2024 (USD MILLION)
- TABLE 49 EUROPE: ENERGY & POWER TANK LEVEL MONITORING SYSTEM MARKET, BY COUNTRY, 2025-2030 (USD MILLION)
- TABLE 50 ASIA PACIFIC: ENERGY & POWER TANK LEVEL MONITORING SYSTEM MARKET, BY COUNTRY, 2021-2024 (USD MILLION)
- TABLE 51 ASIA PACIFIC: ENERGY & POWER TANK LEVEL MONITORING SYSTEM MARKET, BY COUNTRY, 2025-2030 (USD MILLION)
- TABLE 52 ROW: ENERGY & POWER TANK LEVEL MONITORING SYSTEM MARKET, BY REGION, 2021-2024 (USD MILLION)
- TABLE 53 ROW: ENERGY & POWER TANK LEVEL MONITORING SYSTEM MARKET, BY REGION, 2025-2030 (USD MILLION)
- TABLE 54 MINING: TANK LEVEL MONITORING SYSTEM MARKET, BY REGION, 2021-2024 (USD MILLION)
- TABLE 55 MINING: TANK LEVEL MONITORING SYSTEM MARKET, BY REGION, 2025-2030 (USD MILLION)
- TABLE 56 NORTH AMERICA: MINING TANK LEVEL MONITORING SYSTEM MARKET, BY COUNTRY, 2021-2024 (USD MILLION)
- TABLE 57 NORTH AMERICA: MINING TANK LEVEL MONITORING SYSTEM MARKET, BY COUNTRY, 2025-2030 (USD MILLION)
- TABLE 58 EUROPE: MINING TANK LEVEL MONITORING SYSTEM MARKET, BY COUNTRY, 2021-2024 (USD MILLION)
- TABLE 59 EUROPE: MINING: TANK LEVEL MONITORING SYSTEM MARKET, BY COUNTRY, 2025-2030 (USD MILLION)
- TABLE 60 ASIA PACIFIC: MINING TANK LEVEL MONITORING SYSTEM MARKET, BY COUNTRY, 2021-2024 (USD MILLION)
- TABLE 61 ASIA PACIFIC: MINING TANK LEVEL MONITORING SYSTEM MARKET, BY COUNTRY, 2025-2030 (USD MILLION)
- TABLE 62 ROW: MINING TANK LEVEL MONITORING SYSTEM MARKET, BY REGION, 2021-2024 (USD MILLION)
- TABLE 63 ROW: MINING TANK LEVEL MONITORING SYSTEM MARKET, BY REGION, 2025-2030 (USD MILLION)
- TABLE 64 AUTOMOTIVE: TANK LEVEL MONITORING SYSTEM MARKET, BY REGION, 2021-2024 (USD MILLION)
- TABLE 65 AUTOMOTIVE: TANK LEVEL MONITORING SYSTEM MARKET, BY REGION, 2025-2030 (USD MILLION)
- TABLE 66 NORTH AMERICA: AUTOMOTIVE TANK LEVEL MONITORING SYSTEM MARKET, BY COUNTRY, 2021-2024 (USD MILLION)
- TABLE 67 NORTH AMERICA: AUTOMOTIVE TANK LEVEL MONITORING SYSTEM MARKET, BY COUNTRY, 2025-2030 (USD MILLION)
- TABLE 68 EUROPE: AUTOMOTIVE TANK LEVEL MONITORING SYSTEM MARKET, BY COUNTRY, 2021-2024 (USD MILLION)
- TABLE 69 EUROPE: AUTOMOTIVE TANK LEVEL MONITORING SYSTEM MARKET, BY COUNTRY, 2025-2030 (USD MILLION)
- TABLE 70 ASIA PACIFIC: AUTOMOTIVE TANK LEVEL MONITORING SYSTEM MARKET, BY COUNTRY, 2021-2024 (USD MILLION)
- TABLE 71 ASIA PACIFIC: AUTOMOTIVE TANK LEVEL MONITORING SYSTEM MARKET, BY COUNTRY, 2025-2030 (USD MILLION)
- TABLE 72 ROW: AUTOMOTIVE TANK LEVEL MONITORING SYSTEM MARKET, BY REGION, 2021-2024 (USD MILLION)
- TABLE 73 ROW: AUTOMOTIVE TANK LEVEL MONITORING SYSTEM MARKET, BY REGION, 2025-2030 (USD MILLION)
- TABLE 74 AGRICULTURE & HUSBANDRY: TANK LEVEL MONITORING SYSTEM MARKET, BY REGION, 2021-2024 (USD MILLION)
- TABLE 75 AGRICULTURE & HUSBANDRY: TANK LEVEL MONITORING SYSTEM MARKET, BY REGION, 2025-2030 (USD MILLION)
- TABLE 76 NORTH AMERICA: AGRICULTURE & HUSBANDRY TANK LEVEL MONITORING SYSTEM MARKET, BY COUNTRY, 2021-2024 (USD MILLION)
- TABLE 77 NORTH AMERICA: AGRICULTURE & HUSBANDRY TANK LEVEL MONITORING SYSTEM MARKET, BY COUNTRY, 2025-2030 (USD MILLION)
- TABLE 78 EUROPE: AGRICULTURE & HUSBANDRY TANK LEVEL MONITORING SYSTEM MARKET, BY COUNTRY, 2021-2024 (USD MILLION)
- TABLE 79 EUROPE: AGRICULTURE & HUSBANDRY TANK LEVEL MONITORING SYSTEM MARKET, BY COUNTRY, 2025-2030 (USD MILLION)
- TABLE 80 ASIA PACIFIC: AGRICULTURE & HUSBANDRY TANK LEVEL MONITORING SYSTEM MARKET, BY COUNTRY, 2021-2024 (USD MILLION)
- TABLE 81 ASIA PACIFIC: AGRICULTURE & HUSBANDRY TANK LEVEL MONITORING SYSTEM, BY COUNTRY, 2025-2030 (USD MILLION)
- TABLE 82 ROW: AGRICULTURE & HUSBANDRY TANK LEVEL MONITORING SYSTEM MARKET, BY REGION, 2021-2024 (USD MILLION)
- TABLE 83 ROW: AGRICULTURE & HUSBANDRY TANK LEVEL MONITORING SYSTEM MARKET, BY REGION, 2025-2030 (USD MILLION)
- TABLE 84 OTHER END USERS: TANK LEVEL MONITORING SYSTEM MARKET, BY REGION, 2021-2024 (USD MILLION)
- TABLE 85 OTHER END USERS: TANK LEVEL MONITORING SYSTEM MARKET, BY REGION, 2025-2030 (USD MILLION)
- TABLE 86 NORTH AMERICA: OTHER END USERS TANK LEVEL MONITORING SYSTEM MARKET, BY COUNTRY, 2021-2024 (USD MILLION)
- TABLE 87 NORTH AMERICA: OTHER END USERS TANK LEVEL MONITORING SYSTEM MARKET, BY COUNTRY, 2025-2030 (USD MILLION)
- TABLE 88 EUROPE: OTHER END USERS TANK LEVEL MONITORING SYSTEM MARKET, BY COUNTRY, 2021-2024 (USD MILLION)
- TABLE 89 EUROPE: OTHER END USERS TANK LEVEL MONITORING SYSTEM MARKET, BY COUNTRY, 2025-2030 (USD MILLION)
- TABLE 90 ASIA PACIFIC: OTHER END USERS TANK LEVEL MONITORING SYSTEM MARKET, BY COUNTRY, 2021-2024 (USD MILLION)
- TABLE 91 ASIA PACIFIC: OTHER END USERS TANK LEVEL MONITORING SYSTEM MARKET, BY COUNTRY, 2025-2030 (USD MILLION)
- TABLE 92 ROW: OTHER END USERS TANK LEVEL MONITORING SYSTEM MARKET, BY REGION, 2021-2024 (USD MILLION)
- TABLE 93 ROW: OTHER END USERS TANK LEVEL MONITORING SYSTEM MARKET, BY REGION, 2025-2030 (USD MILLION)
- TABLE 94 TANK LEVEL MONITORING SYSTEM MARKET, BY PRODUCT, 2021-2024 (USD MILLION)
- TABLE 95 TANK LEVEL MONITORING SYSTEM MARKET, BY PRODUCT, 2025-2030 (USD MILLION)
- TABLE 96 TANK LEVEL MONITORING SYSTEM MARKET, BY TECHNOLOGY, 2021-2024 (USD MILLION)
- TABLE 97 TANK LEVEL MONITORING SYSTEM MARKET, BY TECHNOLOGY, 2025-2030 (USD MILLION)
- TABLE 98 FLOAT & TAPE GAUGING: TANK LEVEL MONITORING SYSTEM MARKET, BY END USER, 2021-2024 (USD MILLION)
- TABLE 99 FLOAT & TAPE GAUGING TANK LEVEL MONITORING SYSTEM MARKET, BY END USER, 2025-2030 (USD MILLION)
- TABLE 100 CONDUCTIVITY TANK LEVEL MONITORING SYSTEM MARKET, BY END USER, 2021-2024 (USD MILLION)
- TABLE 101 CONDUCTIVITY TANK LEVEL MONITORING SYSTEM MARKET, BY END USER, 2025-2030 (USD MILLION)
- TABLE 102 ULTRASONIC TANK LEVEL MONITORING SYSTEM MARKET, BY END USER, 2021-2024 (USD MILLION)
- TABLE 103 ULTRASONIC TANK LEVEL MONITORING SYSTEM MARKET, BY END USER, 2025-2030 (USD MILLION)
- TABLE 104 CAPACITANCE TANK LEVEL MONITORING SYSTEM MARKET, BY END USER, 2021-2024 (USD MILLION)
- TABLE 105 CAPACITANCE TANK LEVEL MONITORING SYSTEM MARKET, BY END USER, 2025-2030 (USD MILLION)
- TABLE 106 RADAR-BASED TANK LEVEL MONITORING SYSTEM MARKET, BY END USER, 2021-2024 (USD MILLION)
- TABLE 107 RADAR-BASED TANK LEVEL MONITORING SYSTEM MARKET, BY END USER, 2025-2030 (USD MILLION)
- TABLE 108 OTHER TECHNOLOGIES: TANK LEVEL MONITORING SYSTEM MARKET, BY END USER, 2021-2024 (USD MILLION)
- TABLE 109 OTHER TECHNOLOGIES: TANK LEVEL MONITORING SYSTEM MARKET, BY END USER, 2025-2030 (USD MILLION)
- TABLE 110 TANK LEVEL MONITORING SYSTEM MARKET, BY REGION, 2021-2024 (USD MILLION)
- TABLE 111 TANK LEVEL MONITORING SYSTEM MARKET, BY REGION, 2025-2030 (USD MILLION)
- TABLE 112 NORTH AMERICA: TANK LEVEL MONITORING SYSTEM MARKET, BY COUNTRY, 2021-2024 (USD MILLION)
- TABLE 113 NORTH AMERICA: NORTH AMERICA TANK LEVEL MONITORING SYSTEM MARKET, BY COUNTRY, 2025-2030 (USD MILLION)
- TABLE 114 US: TANK LEVEL MONITORING SYSTEM MARKET, BY END USER, 2021-2024 (USD MILLION)
- TABLE 115 US: TANK LEVEL MONITORING SYSTEM MARKET, BY END USER, 2025-2030 (USD MILLION)
- TABLE 116 CANADA: TANK LEVEL MONITORING SYSTEM MARKET, BY END USER, 2021-2024 (USD MILLION)
- TABLE 117 CANADA: TANK LEVEL MONITORING SYSTEM MARKET, BY END USER, 2025-2030 (USD MILLION)
- TABLE 118 MEXICO: TANK LEVEL MONITORING SYSTEM MARKET, BY END USER, 2021-2024 (USD MILLION)
- TABLE 119 MEXICO: TANK LEVEL MONITORING SYSTEM MARKET, BY END USER, 2025-2030 (USD MILLION)
- TABLE 120 EUROPE: TANK LEVEL MONITORING SYSTEM MARKET, BY COUNTRY, 2021-2024 (USD MILLION)
- TABLE 121 EUROPE: TANK LEVEL MONITORING SYSTEM MARKET, BY COUNTRY, 2025-2030 (USD MILLION)
- TABLE 122 UK: TANK LEVEL MONITORING SYSTEM MARKET, BY END USER, 2021-2024 (USD MILLION)
- TABLE 123 UK: TANK LEVEL MONITORING SYSTEM MARKET, BY END USER, 2025-2030 (USD MILLION)
- TABLE 124 GERMANY: TANK LEVEL MONITORING SYSTEM MARKET, BY END USER, 2021-2024 (USD MILLION)
- TABLE 125 GERMANY: TANK LEVEL MONITORING SYSTEM MARKET, BY END USER, 2025-2030 (USD MILLION)
- TABLE 126 FRANCE TANK LEVEL MONITORING SYSTEM MARKET, BY END USER, 2021-2024 (USD MILLION)
- TABLE 127 FRANCE: TANK LEVEL MONITORING SYSTEM MARKET, BY END USER, 2025-2030 (USD MILLION)
- TABLE 128 REST OF EUROPE: TANK LEVEL MONITORING SYSTEM MARKET, BY END USER, 2021-2024 (USD MILLION)
- TABLE 129 REST OF EUROPE: TANK LEVEL MONITORING SYSTEM MARKET, BY END USER, 2025-2030 (USD MILLION)
- TABLE 130 ASIA PACIFIC: TANK LEVEL MONITORING SYSTEM MARKET, BY COUNTRY, 2021-2024 (USD MILLION)
- TABLE 131 ASIA PACIFIC TANK LEVEL MONITORING SYSTEM MARKET, BY COUNTRY, 2025-2030 (USD MILLION)
- TABLE 132 CHINA: TANK LEVEL MONITORING SYSTEM MARKET, BY END USER, 2021-2024 (USD MILLION)
- TABLE 133 CHINA: TANK LEVEL MONITORING SYSTEM MARKET, BY END USER, 2025-2030 (USD MILLION)
- TABLE 134 JAPAN: TANK LEVEL MONITORING SYSTEM MARKET, BY END USER, 2021-2024 (USD MILLION)
- TABLE 135 JAPAN: TANK LEVEL MONITORING SYSTEM MARKET, BY END USER, 2025-2030 (USD MILLION)
- TABLE 136 INDIA: TANK LEVEL MONITORING SYSTEM MARKET, BY END USER, 2021-2024 (USD MILLION)
- TABLE 137 INDIA: TANK LEVEL MONITORING SYSTEM MARKET, BY END USER, 2025-2030 (USD MILLION)
- TABLE 138 SOUTH KOREA: TANK LEVEL MONITORING SYSTEM MARKET, BY END USER, 2021-2024 (USD MILLION)
- TABLE 139 SOUTH KOREA TANK LEVEL MONITORING SYSTEM MARKET, BY END USER, 2025-2030 (USD MILLION)
- TABLE 140 REST OF ASIA PACIFIC: TANK LEVEL MONITORING SYSTEM MARKET, BY END USER, 2021-2024 (USD MILLION)
- TABLE 141 REST OF ASIA PACIFIC: TANK LEVEL MONITORING SYSTEM MARKET, BY END USER, 2025-2030 (USD MILLION)
- TABLE 142 ROW: TANK LEVEL MONITORING SYSTEM MARKET, BY REGION, 2021-2024 (USD MILLION)
- TABLE 143 ROW: TANK LEVEL MONITORING SYSTEM MARKET, BY REGION, 2025-2030 (USD MILLION)
- TABLE 144 AFRICA: TANK LEVEL MONITORING SYSTEM MARKET, BY END USER, 2021-2024 (USD MILLION)
- TABLE 145 AFRICA TANK LEVEL MONITORING SYSTEM MARKET, BY END USER, 2025-2030 (USD MILLION)
- TABLE 146 MIDDLE EAST: TANK LEVEL MONITORING SYSTEM MARKET, BY END USER, 2021-2024 (USD MILLION)
- TABLE 147 MIDDLE EAST: TANK LEVEL MONITORING SYSTEM MARKET, BY END USER, 2025-2030 (USD MILLION)
- TABLE 148 SOUTH AMERICA: TANK LEVEL MONITORING SYSTEM MARKET, BY END USER, 2021-2024 (USD MILLION)
- TABLE 149 SOUTH AMERICA: TANK LEVEL MONITORING SYSTEM MARKET, BY END USER, 2025-2030 (USD MILLION)
- TABLE 150 TANK LEVEL MONITORING SYSTEM MARKET: OVERVIEW OF STRATEGIES ADOPTED BY KEY PLAYERS, JANUARY 2023-AUGUST 2025
- TABLE 151 TANK LEVEL MONITORING SYSTEM MARKET: DEGREE OF COMPETITION, 2024
- TABLE 152 TANK LEVEL MONITORING SYSTEM MARKET: REGION FOOTPRINT
- TABLE 153 TANK LEVEL MONITORING SYSTEM MARKET: END-USE INDUSTRY FOOTPRINT
- TABLE 154 TANK LEVEL MONITORING SYSTEM MARKET: COMPONENT FOOTPRINT
- TABLE 155 TANK LEVEL MONITORING SYSTEM MARKET: LIST OF KEY STARTUPS/SMES
- TABLE 156 TANK LEVEL MONITORING SYSTEM MARKET: COMPETITIVE BENCHMARKING OF KEY STARTUPS/SMES
- TABLE 157 TANK LEVEL MONITORING SYSTEM MARKET: PRODUCT LAUNCHES, JANUARY 2023-AUGUST 2025
- TABLE 158 TANK LEVEL MONITORING SYSTEM MARKET: DEALS, JANUARY 2023-AUGUST 2025
- TABLE 159 EMERSON ELECTRIC CO.: COMPANY OVERVIEW
- TABLE 160 EMERSON ELECTRIC CO.: PRODUCTS OFFERED
- TABLE 161 EMERSON ELECTRIC CO.: PRODUCT LAUNCHES
- TABLE 162 HONEYWELL INTERNATIONAL INC.: COMPANY OVERVIEW
- TABLE 163 HONEYWELL INTERNATIONAL INC.: PRODUCTS OFFERED
- TABLE 164 SIEMENS: COMPANY OVERVIEW
- TABLE 165 SIEMENS: PRODUCTS OFFERED
- TABLE 166 ENDRESS+HAUSER GROUP SERVICES AG: COMPANY OVERVIEW
- TABLE 167 ENDRESS+HAUSER GROUP SERVICES AG: PRODUCTS OFFERED
- TABLE 168 SCHNEIDER ELECTRIC: COMPANY OVERVIEW
- TABLE 169 SCHNEIDER ELECTRIC: PRODUCTS OFFERED
- TABLE 170 SCHNEIDER ELECTRIC: DEALS
- TABLE 171 GRACO INC.: COMPANY OVERVIEW
- TABLE 172 GRACO INC.: PRODUCTS OFFERED
- TABLE 173 DG INTERNATIONAL INC.: COMPANY OVERVIEW
- TABLE 174 DG INTERNATIONAL INC.: PRODUCTS OFFERED
- TABLE 175 OTODATA WIRELESS NETWORK: COMPANY OVERVIEW
- TABLE 176 OTODATA WIRELESS NETWORK: PRODUCTS OFFERED
- TABLE 177 OTODATA WIRELESS NETWORK: DEALS
- TABLE 178 VEGA: COMPANY OVERVIEW
- TABLE 179 VEGA: PRODUCTS OFFERED
- TABLE 180 VEGA: PRODUCT LAUNCHES
- TABLE 181 PIUSI S.P.A: COMPANY OVERVIEW
- TABLE 182 PIUSI S.P.A: PRODUCTS OFFERED
- TABLE 183 GAUGING SYSTEMS INC.: COMPANY OVERVIEW
- TABLE 184 GAUGING SYSTEMS INC.: PRODUCTS OFFERED
- TABLE 185 BANNER ENGINEERING CORP.: COMPANY OVERVIEW
- TABLE 186 BANNER ENGINEERING CORP.: PRODUCTS OFFERED
- TABLE 187 THE VEEDER-ROOT COMPANY: COMPANY OVERVIEW
- TABLE 188 THE VEEDER-ROOT COMPANY: PRODUCTS OFFERED
- TABLE 189 THE VEEDER-ROOT COMPANY: PRODUCT LAUNCHES
- TABLE 190 VAREC, INC.: COMPANY OVERVIEW
- TABLE 191 VAREC, INC.: PRODUCTS OFFERED
- TABLE 192 OMNTEC MFG., INC.: COMPANY OVERVIEW
- TABLE 193 OMNTEC MFG., INC.: PRODUCTS OFFERED
- TABLE 194 PNEUMERCATOR: COMPANY OVERVIEW
- TABLE 195 SKYBITZ INC.: COMPANY OVERVIEW
- TABLE 196 ROCHESTER SENSORS: COMPANY OVERVIEW
- TABLE 197 RUGGED TELEMETRY: COMPANY OVERVIEW
- TABLE 198 PULSA: COMPANY OVERVIEW
- TABLE 199 SCHMITT INDUSTRIES INC.: COMPANY OVERVIEW
- TABLE 200 ORIEL SYSTEMS LIMITED: COMPANY OVERVIEW
- TABLE 201 MOPEKA PRODUCTS LLC: COMPANY OVERVIEW
- TABLE 202 TANKSCAN: COMPANY OVERVIEW
- TABLE 203 INPRO GROUP: COMPANY OVERVIEW
List of Figures
- FIGURE 1 TANK LEVEL MONITORING SYSTEM MARKET SEGMENTATION AND REGIONAL SCOPE
- FIGURE 2 TANK LEVEL MONITORING SYSTEM MARKET: RESEARCH DESIGN
- FIGURE 3 TANK LEVEL MONITORING SYSTEM MARKET: RESEARCH APPROACH
- FIGURE 4 KEY DATA FROM SECONDARY SOURCES
- FIGURE 5 KEY DATA FROM PRIMARY SOURCES
- FIGURE 6 KEY INDUSTRY INSIGHTS
- FIGURE 7 BREAKDOWN OF INTERVIEWS WITH EXPERTS
- FIGURE 8 MARKET SIZE ESTIMATION METHODOLOGY: BOTTOM-UP APPROACH
- FIGURE 9 MARKET SIZE ESTIMATION METHODOLOGY: TOP-DOWN APPROACH
- FIGURE 10 TANK LEVEL MONITORING SYSTEM MARKET SIZE ESTIMATION METHODOLOGY
- FIGURE 11 DATA TRIANGULATION
- FIGURE 12 INVASIVE PRODUCTS TO ACCOUNT FOR MAJOR MARKET SHARE IN 2025
- FIGURE 13 SENSORS TO HOLD LARGEST SHARE OF COMPONENTS MARKET IN 2025
- FIGURE 14 RADAR-BASED SYSTEMS TO CAPTURE LARGEST MARKET SHARE IN 2025
- FIGURE 15 OIL & FUEL INDUSTRY TO DOMINATE MARKET IN 2025
- FIGURE 16 FUEL SEGMENT TO CAPTURE HIGHEST SHARE IN 2025
- FIGURE 17 ASIA PACIFIC TO BE LARGEST AND FASTEST-GROWING MARKET FROM 2025 TO 2030
- FIGURE 18 LARGE-SCALE INFRASTRUCTURE DEVELOPMENT INITIATIVES TO CREATE NEED FOR ADVANCED TANK LEVEL MONITORING SYSTEMS
- FIGURE 19 INVASIVE SEGMENT TO DOMINATE MARKET, BY PRODUCT, IN 2030
- FIGURE 20 FLOAT & TAPE GAUGING TO BE LEADING TECHNOLOGY SEGMENT BY 2030
- FIGURE 21 OIL & FUEL END USER SEGMENT TO LEAD MARKET BY 2030
- FIGURE 22 FUEL SEGMENT TO LEAD MARKET, BY FLUID TYPE, IN 2030
- FIGURE 23 SENSORS TO COMMAND LARGEST SHARE OF COMPONENT SEGMENT IN 2030
- FIGURE 24 INDIA TO EXHIBIT HIGHEST CAGR IN GLOBAL MARKET FROM 2025 TO 2030
- FIGURE 25 TANK LEVEL MONITORING SYSTEM MARKET: DRIVERS, RESTRAINTS, OPPORTUNITIES, AND CHALLENGES
- FIGURE 26 TANK LEVEL MONITORING SYSTEM MARKET: IMPACT ANALYSIS OF DRIVERS
- FIGURE 27 TANK LEVEL MONITORING SYSTEM MARKET: IMPACT ANALYSIS OF RESTRAINTS
- FIGURE 28 TANK LEVEL MONITORING SYSTEM MARKET: IMPACT ANALYSIS OF OPPORTUNITIES
- FIGURE 29 TANK LEVEL MONITORING SYSTEM MARKET: IMPACT ANALYSIS OF CHALLENGES
- FIGURE 30 VALUE CHAIN ANALYSIS: MAJOR VALUE ADDED BY ORIGINAL EQUIPMENT MANUFACTURERS
- FIGURE 31 TANK LEVEL MONITORING SYSTEM MARKET: ECOSYSTEM ANALYSIS
- FIGURE 32 INDICATIVE PRICING TREND OF LEVEL SENSORS OFFERED BY KEY PLAYERS (USD), 2021-2024 (USD)
- FIGURE 33 INDICATIVE PRICING TREND OF LEVEL SENSORS, BY TYPE, 2021-2024 (USD)
- FIGURE 34 INDICATIVE PRICING TREND OF ULTRASONIC LEVEL SENSORS, BY REGION, 2021-2024 (USD)
- FIGURE 35 TANK LEVEL MONITORING SYSTEM MARKET: TRENDS/DISRUPTIONS IMPACTING CUSTOMER BUSINESS
- FIGURE 36 IMPORT DATA FOR HS CODE 902610-COMPLIANT PRODUCTS, BY COUNTRY, 2020-2024
- FIGURE 37 EXPORT DATA FOR HS CODE 902610-COMPLIANT PRODUCTS, BY COUNTRY, 2020-2024
- FIGURE 38 PATENTS APPLIED AND GRANTED, 2015-2024
- FIGURE 39 KEY AI USE CASES IN TANK LEVEL MONITORING SYSTEM MARKET
- FIGURE 40 TANK LEVEL MONITORING SYSTEM MARKET, BY FLUID TYPE
- FIGURE 41 WATER SEGMENT TO GROW AT HIGHEST CAGR DURING FORECAST PERIOD
- FIGURE 42 TANK LEVEL MONITORING SYSTEM MARKET, BY COMPONENT
- FIGURE 43 TANK LEVEL MONITORING SYSTEM MARKET, BY COMPONENT, 2025-2030 (USD MILLION)
- FIGURE 44 TANK LEVEL MONITORING SYSTEM, BY END USER
- FIGURE 45 TANK LEVEL MONITORING SYSTEM MARKET, BY END USER, 2025-2030 (USD MILLION)
- FIGURE 46 TANK LEVEL MONITORING SYSTEM MARKET, BY PRODUCT
- FIGURE 47 TANK LEVEL MONITORING SYSTEM MARKET, BY PRODUCT, 2025-2030 (USD MILLION)
- FIGURE 48 TANK LEVEL MONITORING SYSTEM MARKET, BY TECHNOLOGY,
- FIGURE 49 TANK LEVEL MONITORING SYSTEM MARKET, BY TECHNOLOGY, 2025-2030 (USD MILLION)
- FIGURE 50 INDIA TO WITNESS HIGHEST CAGR DURING FORECAST PERIOD
- FIGURE 51 ASIA PACIFIC TO LEAD TANK LEVEL MONITORING SYSTEM MARKET THROUGHOUT FORECAST PERIOD
- FIGURE 52 NORTH AMERICA: TANK LEVEL MONITORING SYSTEM MARKET SNAPSHOT
- FIGURE 53 EUROPE: TANK LEVEL MONITORING SYSTEM MARKET SNAPSHOT
- FIGURE 54 ASIA PACIFIC: SNAPSHOT OF TANK LEVEL MONITORING SYSTEM MARKET
- FIGURE 55 TANK LEVEL MONITORING SYSTEM MARKET: REVENUE ANALYSIS OF KEY PLAYERS, 2020-2024
- FIGURE 56 MARKET SHARE ANALYSIS OF COMPANIES OFFERING TANK LEVEL MONITORING SYSTEMS, 2024
- FIGURE 57 TANK LEVEL MONITORING SYSTEM MARKET: COMPANY EVALUATION MATRIX (KEY PLAYERS), 2024
- FIGURE 58 TANK LEVEL MONITORING SYSTEM MARKET: COMPANY FOOTPRINT
- FIGURE 59 TANK LEVEL MONITORING SYSTEM MARKET: COMPANY EVALUATION MATRIX (STARTUPS/SMES), 2024
- FIGURE 60 EMERSON ELECTRIC CO.: COMPANY SNAPSHOT
- FIGURE 61 HONEYWELL INTERNATIONAL INC.: COMPANY SNAPSHOT
- FIGURE 62 SIEMENS: COMPANY SNAPSHOT
- FIGURE 63 ENDRESS+HAUSER GROUP SERVICES AG: COMPANY SNAPSHOT
- FIGURE 64 SCHNEIDER ELECTRIC: COMPANY SNAPSHOT
- FIGURE 65 GRACO INC.: COMPANY SNAPSHOT
- FIGURE 66 DG INTERNATIONAL INC.: COMPANY SNAPSHOT
 攜帶式聲學水位計市場:按產品類型、技術、終端用戶產業和銷售管道,全球預測,2026-2032年鑽井液位監測器市場:依感測器類型、鑽井液類型、部署模式、應用、最終用戶分類,2026-2032年全球預測全球高階浮式儲槽系統市場(按產品類型、材料、應用和最終用戶分類)預測(2026-2032)地下水位監測與分析設備市場:依產品類型、應用、技術、安裝及最終用戶分類,全球預測,2026-2032年
 超音波儲罐液位監測系統市場規模、佔有率及成長分析:按產品類型、技術、儲槽類型、應用、終端用戶產業和地區分類 - 2026-2033年產業預測
 2026年全球儲罐液位監測系統市場報告儲罐液位監測系統市場(按組件、儲槽類型、連接性、感測器類型、應用和最終用戶分類)—2025-2032 年全球預測
 2032 年儲罐液位監測系統市場預測:按產品類型、組件、技術、應用、最終用戶和地區進行的全球分析
 無線儲罐液位監測市場-2025年至2030年預測
 儲槽液位監測系統市場,按應用、按技術、按產品和地區 - 2024-2032 年行業分析、市場規模、市場佔有率和預測