


 |
市場調查報告書
商品編碼
1795417
全球閥門定位器市場(按驅動類型、行業、類型和地區)預測至 2030 年Valve Positioner Market by Type (Pneumatic Positioners, Electro-pneumatic Positioners, Digital Positioners), Actuation (Single Acting Positioners, Double Acting Positioners), Industry (Oil & Gas, Energy & Power) and Region - Global Forecast to 2030 |
||||||
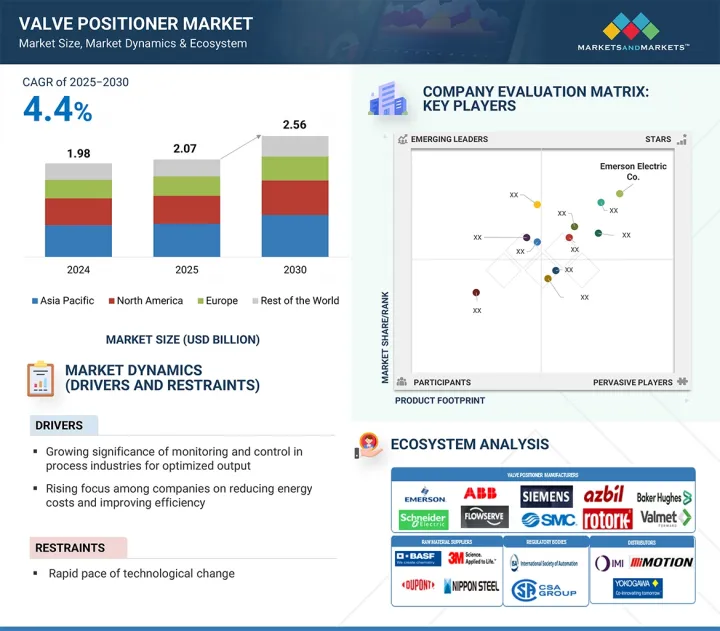
全球閥門定位器市場預計將從 2025 年的 20.7 億美元成長到 2030 年的 25.6 億美元,複合年成長率為 4.4%。
推動這一成長的動力源於對精確控制、流程自動化以及整個工業營運向智慧閥門管理轉型的需求日益成長。隨著各行各業尋求最佳化製程響應能力、減少閥門相關故障並滿足嚴格的品質標準,閥門定位器正成為在波動的運作條件下實現穩定性能的關鍵部件。金屬和採礦、化學加工、製藥和發電等行業正在擴大其對先進閥門定位器的應用,以可靠地控制壓力敏感的關鍵任務應用。
| 調查範圍 | |
|---|---|
| 調查年份 | 2021-2030 |
| 基準年 | 2024 |
| 預測期 | 2025-2030 |
| 對價單位 | 金額(十億美元) |
| 按細分市場 | 依經營類型、行業、類型、地區 |
| 目標區域 | 北美、歐洲、亞太地區及其他地區 |
此外,在批次頻繁變化且流量可變的製造環境中,閥門定位器正被用於提高產量並減少浪費。與智慧儀器網路、狀態監控系統和工廠控制架構的整合,提高了操作靈活性並減少了人工干預。隨著對自適應控制、遠端性能最佳化和生命週期效率的需求不斷成長,閥門定位器有望在全球各行業實現下一代工業自動化策略方面發揮重要作用。
預計在預測期內,單作用執行器將佔據閥門定位器市場的最大佔有率,這得益於在優先考慮安全性、可靠性和能源效率的關鍵製程工業中,單作用執行器的應用日益廣泛。石油和天然氣、水和污水處理以及化學加工等行業擴大選擇單作用致動器,因為它們具有故障安全功能——在發生空氣異常時能夠自動將閥門返回到指定位置(打開或關閉)。此功能可確保操作安全並最大限度地降低危險環境中的風險。數位閥門定位器與單作用致動器的整合,透過實現精確控制、即時診斷和預測性維護,進一步增強了該領域的主導地位。這些優勢不僅可以提高系統效能,還可以減少停機時間和維護成本。此外,單作用致動器的低空氣消費量和易於安裝使其非常適合簡單性和可靠性至關重要的偏遠和危險場所。隨著各行各業尋求簡化業務並與永續性目標保持一致,單作用致動器透過提供支援合規性和業務連續性的強大、經濟高效的解決方案來鞏固其市場主導地位。
2024年,能源和電力產業佔據閥門定位器市場第二大佔有率,這得益於發電和配電領域對高效流量控制和系統可靠性提升的需求不斷成長。隨著全球能源消費量的增加和電網的日益複雜,公用事業公司擴大部署先進的閥門定位器,以最佳化熱電廠、核能和可再生能源發電中蒸氣、燃氣和冷卻系統的控制。現代電力設施正在採用智慧閥門定位器,以實現更嚴格的控制迴路,減少設備的機械應力,並改善負載管理。向生質能能、太陽能和地熱能等再生能源來源的轉變進一步加劇了對精確流量調節的需求,使得閥門定位器成為確保製程穩定性和效率的關鍵部件。此外,世界各地不斷升級老化電力基礎設施和增加新發電能力的努力也正在推動這些解決方案的採用。閥門定位器還支援排放法規並有助於滿足嚴格的能源效率法規,從而增強了其作為不斷發展的能源格局中一項重要技術的作用。
亞太地區是閥門定位器市場成長最快的地區,預計在預測期內將實現最高的複合年成長率。這一快速成長的動力源自於工業化進程的加速、基礎設施的建設以及石油天然氣、化學、水和用水和污水處理以及發電等關鍵產業日益普及的自動化技術。中國、印度、韓國和東南亞等國家正在大力投資,以實現製造業和流程工業的現代化,以提高生產力並滿足日益成長的國內和出口需求。該地區大力推進工業4.0和智慧製造,加速了數位閥門定位器的普及,這些定位器具有精確控制、遠距離診斷和系統整合等優勢。此外,政府支持清潔能源、高效水資源管理和工業自動化的措施也為市場擴張創造了有利環境。升級老化基礎設施和滿足更嚴格的環境法規的需求進一步推動了對先進閥門控制解決方案的需求。隨著對能源效率、永續性和運作可靠性的日益關注,亞太地區正逐漸成為閥門定位器應用的關鍵樞紐,並鞏固了其作為最具活力和發展最快的區域市場的地位。
本報告研究了全球閥門定位器市場,提供了按驅動類型、行業、類型和地區分類的趨勢資訊,以及參與市場的公司概況。
目錄
第1章 引言
第2章調查方法
第3章執行摘要
第4章重要考察
第5章市場概述
- 介紹
- 市場動態
- 價值鏈分析
- 生態系分析
- 定價分析
- 影響客戶業務的趨勢/中斷
- 技術分析
- 波特五力分析
- 主要相關人員和採購標準
- 案例研究
- 貿易分析
- 專利分析
- 2025-2026年主要會議和活動
- 標準和法規
- 人工智慧/生成人工智慧對閥門定位器市場的影響
- 2025年美國關稅對閥門定位器市場的影響
第6章 閥門定位器市場(依驅動類型)
- 介紹
- 單作用
- 雙作用
第7章閥門定位器市場(按行業)
- 介紹
- 石油和天然氣
- 水和污水處理
- 能源與電力
- 化學品
- 紙和紙漿
- 製藥
- 金屬和採礦
- 食品/飲料
- 其他
第8章 閥門定位器市場(按類型)
- 介紹
- 氣動定位器
- 電控氣動定位器
- 數位定位器
第9章 閥門定位器市場(按地區)
- 介紹
- 北美洲
- 美國
- 加拿大
- 墨西哥
- 歐洲
- 英國
- 德國
- 法國
- 其他
- 亞太地區
- 中國
- 日本
- 印度
- 其他
- 其他地區
- 中東和非洲
- 南美洲
第10章 競爭格局
- 概述
- 主要參與企業的策略/優勢,2023-2025年
- 2020-2024年收益分析
- 2024年市場佔有率分析
- 競爭力評估矩陣:2024年主要參與企業評估
- 競爭力評估矩陣:Start-Ups/中小企業評估,2024 年
- 競爭場景
第11章 公司簡介
- 主要參與企業
- EMERSON ELECTRIC CO.
- ABB
- FLOWSERVE CORPORATION
- SIEMENS
- SCHNEIDER ELECTRIC
- SMC CORPORATION
- AZBIL CORPORATION
- BAKER HUGHES
- ROTORK PLC
- VALMET
- 其他公司
- SAMSONCONTROLS.NET.
- VRG CONTROLS, LLC
- FESTO SE & CO. KG(FESTO)
- BADGER METER, INC.
- CONTROLAIR
- CRANE COMPANY
- CHRISTIAN BURKERT GMBH & CO. KG
- GEMU GROUP
- DWYER INSTRUMENTS LTD
- VRC
- POWER-GENEX LTD.
- VAL CONTROLS
- BRAY INTERNATIONAL
- NIHON KOSO CO., LTD.
- SPIRAX SARCO LIMITED
第12章 附錄
With a CAGR of 4.4%, the global valve positioner market is projected to grow from USD 2.07 billion in 2025 to USD 2.56 billion by 2030. Growth is expected to be driven by the increasing need for precision control, automation of flow processes, and the shift toward intelligent valve management across industrial operations. As industries aim to optimize process responsiveness, reduce valve-related failures, and meet stringent quality standards, valve positioners are becoming critical components in achieving consistent performance under variable operating conditions. Industries such as metals and mining, chemical processing, pharmaceuticals, and power generation are expanding the use of advanced valve positioners to ensure tight control in pressure-sensitive and mission-critical applications.
| Scope of the Report | |
|---|---|
| Years Considered for the Study | 2021-2030 |
| Base Year | 2024 |
| Forecast Period | 2025-2030 |
| Units Considered | Value (USD Billion) |
| Segments | By Type, Actuation, Industry, and Region |
| Regions covered | North America, Europe, APAC, RoW |
Additionally, manufacturing environments with frequent batch changes and variable flows adopt positioners to improve throughput and reduce waste. Integration with smart instrumentation networks, condition monitoring systems, and plant control architectures enhances operational flexibility and reduces manual intervention. As the demand for adaptive control, remote performance optimization, and lifecycle efficiency increases, valve positioners are expected to play a growing role in enabling next-generation industrial automation strategies across global sectors.
By actuation type, the single-acting segment is expected to hold the largest market share during the forecast period.
The single-acting actuation segment is projected to hold the largest share of the valve positioner market during the forecast period, driven by its growing adoption in critical process industries that prioritize safety, reliability, and energy efficiency. Industries such as oil & gas, water & wastewater treatment, and chemical processing are increasingly selecting single-acting actuators due to their fail-safe capability-automatically returning the valve to a predetermined position (open or closed) in the event of air failure. This functionality ensures operational security and minimizes risks in high-stakes environments. The integration of digital valve positioners with single-acting actuators is further strengthening the segment's dominance, enabling precise control, real-time diagnostics, and predictive maintenance. These benefits not only enhance system performance but also reduce downtime and maintenance costs. Moreover, single-acting actuators consume less air and are easier to install, making them well-suited for remote or hazardous locations where simplicity and reliability are essential. As industries aim to streamline operations and align with sustainability goals, single-acting actuation offers a robust, cost-effective solution that supports compliance and operational continuity, reinforcing its leading position in the market.
Industry
By industry, the energy and power sector is likely to hold the second-largest market share during the forecast period.
The energy and power sector secured the second-largest share in the valve positioner market during 2024, supported by the growing demand for efficient flow control and enhanced system reliability in power generation and distribution. As global energy consumption rises and power grids become more complex, utilities are increasingly implementing advanced valve positioners to optimize control over steam, gas, and cooling systems in thermal, nuclear, and renewable energy plants. Modern power facilities are adopting smart valve positioners to enable tighter control loops, reduce mechanical stress on equipment, and improve load management. The transition toward renewable energy sources-such as biomass, solar thermal, and geothermal-further strengthens the need for accurate flow regulation, making valve positioners a critical component in ensuring process stability and efficiency. Moreover, ongoing efforts to upgrade aging power infrastructure and add new generation capacity worldwide are driving the adoption of these solutions. Valve positioners also support emission control and help meet stringent energy efficiency regulations, reinforcing their role as an essential technology in the evolving energy landscape..
By Region, Asia Pacific is projected to be the fastest-growing market during the forecast period.
Asia Pacific is projected to be the fastest-growing region in the valve positioner market, registering the highest CAGR during the forecast period. This rapid growth is driven by expanding industrialization, infrastructure development, and increasing adoption of automation technologies across key sectors such as oil & gas, chemicals, water and wastewater treatment, and power generation. Countries like China, India, South Korea, and Southeast Asian nations are making significant investments in modernizing their manufacturing and process industries to enhance productivity and meet rising domestic and export demands. The region's push toward Industry 4.0 and smart manufacturing is accelerating the deployment of digital valve positioners, which offer benefits such as precise control, remote diagnostics, and system integration. Moreover, government initiatives supporting clean energy, efficient water management, and industrial automation are creating a favorable environment for market expansion. The need to upgrade aging infrastructure and meet stricter environmental regulations further fuels demand for advanced valve control solutions. With growing focus on energy efficiency, sustainability, and operational reliability, the Asia Pacific is emerging as a key hub for valve positioner adoption, driving its position as the most dynamic and rapidly advancing regional market..
Breakdown of primaries
A variety of executives from key organizations operating in the valve positioner market were interviewed in-depth, including CEOs, marketing directors, and innovation and technology directors.
- By Company Type: Tier 1 - 45%, Tier 2 - 35%, and Tier 3 - 20%
- By Designation: Directors - 45%, C-level - 30%, and Others - 25%
- By Region: North America - 45%, Europe - 25%, Asia Pacific - 20%, and RoW - 10%
Note: Other designations include sales and product managers and project engineers. The three tiers of the companies are defined based on their total revenue in 2024: Tier 1 - revenue greater than or equal to USD 1 billion; Tier 2 - revenue between USD 100 million and USD 1 billion; and Tier 3 revenue less than or equal to USD 100 million.
Major players profiled in this report are as follows:
Emerson Electric Co. (US), Siemens (Germany), ABB (Switzerland), Flowserve Corporation (US), Schneider Electric (France), SMC Corporation (Japan), Azbil Corporation (Japan), Baker Hughes (US), Rotork plc (UK), Valmet (Finland), samsoncontrols.net. (Germany), VRG Controls, LLC (US), Festo SE & Co. KG (Festo) (Germany), Badger Meter, Inc. (US), ControlAir (US), Crane Company (US), Christian Burkert GmbH & Co. KG (Germany), GEMU Group (Germany), Dwyer Instruments, LLC (US), VRC (US), POWER GENEX (South Korea), Val Controls (Denmark), Bray International (US), NIHON KOSO CO., LTD. (Japan), Spirax Sarco Limited (UK).
The study provides a detailed competitive analysis of these key players in the valve positioner market, presenting their company profiles, most recent developments, and key market strategies.
Study Coverage
In this report, the valve positioner market has been segmented based on type, actuation, industry, and region. The type segment includes digital, electro-pneumatic, and pneumatic. The actuation segment comprises single-acting and double-acting. The industry segment comprises oil & gas, energy & power, water & wastewater treatment, food & beverages, metals & mining, chemicals, pharmaceuticals, pulp & paper, and other industries. The market has been segmented into four regions - North America, Asia Pacific, Europe, and Rest of the World (RoW).
Reasons to buy the report
The report will help the leaders/new entrants in this market with information on the closest approximations of the revenue numbers for the overall market and the sub-segments. This report will help stakeholders understand the competitive landscape and gain more insights to position their businesses better and plan suitable go-to-market strategies. The report also helps stakeholders understand the valve positioner market's pulse and provides information on key market drivers, restraints, challenges, and opportunities.
Key Benefits of Buying the Report
- Analysis of key drivers (growing significance of monitoring and control in process industries for optimized output, valve positioners are helping industries cut energy costs and improve efficiency as global energy demand continues to rise, rising adoption of smart valve positioners in various plant operations), restraints (fast-changing technology are slowing the adoption of valve positioners), opportunities (increasing focus on remote operations and decentralized plants, focus of industry players on offering improved customer service), and challenges (positioner overshoot and oversized valves hinder operation of control valves) influencing the growth of the valve positioner market.
- Product Development/Innovation: Detailed insights on upcoming technologies, research and development activities, and new product launches in the valve positioner market.
- Market Development: Comprehensive information about lucrative markets - the report analyses the valve positioner market across varied regions.
- Market Diversification: Exhaustive information about new products/services, untapped geographies, recent developments, and investments in the valve positioner market.
- Competitive Assessment: In-depth assessment of market shares, growth strategies, and service offerings of leading players like Emerson Electric Co. (US), ABB (Switzerland), Siemens (Germany), Flowserve Corporation (US), Schneider Electric (France), and others.
TABLE OF CONTENTS
1 INTRODUCTION
- 1.1 STUDY OBJECTIVES
- 1.2 MARKET DEFINITION
- 1.3 STUDY SCOPE
- 1.3.1 MARKETS COVERED AND REGIONAL SCOPE
- 1.3.2 INCLUSIONS AND EXCLUSIONS
- 1.3.3 YEARS CONSIDERED
- 1.4 CURRENCY CONSIDERED
- 1.5 LIMITATIONS
- 1.6 STAKEHOLDERS
- 1.7 SUMMARY OF CHANGES
2 RESEARCH METHODOLOGY
- 2.1 RESEARCH DATA
- 2.1.1 SECONDARY AND PRIMARY RESEARCH
- 2.1.2 SECONDARY DATA
- 2.1.2.1 List of key secondary sources
- 2.1.2.2 Key data from secondary sources
- 2.1.3 PRIMARY DATA
- 2.1.3.1 List of key primary interview participants
- 2.1.3.2 Breakdown of primaries
- 2.1.3.3 Key data from primary sources
- 2.1.3.4 Key industry insights
- 2.2 MARKET SIZE ESTIMATION METHODOLOGY
- 2.2.1 BOTTOM-UP APPROACH
- 2.2.1.1 Approach to estimate market size using bottom-up analysis (demand side)
- 2.2.2 TOP-DOWN APPROACH
- 2.2.2.1 Approach to estimate market size using top-down analysis (supply side)
- 2.2.1 BOTTOM-UP APPROACH
- 2.3 MARKET BREAKDOWN AND DATA TRIANGULATION
- 2.4 RESEARCH ASSUMPTIONS
- 2.5 RISK ANALYSIS
3 EXECUTIVE SUMMARY
4 PREMIUM INSIGHTS
- 4.1 ATTRACTIVE GROWTH OPPORTUNITIES FOR KEY PLAYERS IN VALVE POSITIONER MARKET
- 4.2 VALVE POSITIONER MARKET, BY TYPE
- 4.3 VALVE POSITIONER MARKET, BY ACTUATION
- 4.4 VALVE POSITIONER MARKET, BY INDUSTRY
- 4.5 VALVE POSITIONER MARKET, BY COUNTRY
5 MARKET OVERVIEW
- 5.1 INTRODUCTION
- 5.2 MARKET DYNAMICS
- 5.2.1 DRIVERS
- 5.2.1.1 Growing significance of monitoring and control in process industries for optimized output
- 5.2.1.2 Increasing pressure to cut costs and operate more efficiently
- 5.2.1.3 Seamless integration with advanced control systems
- 5.2.2 RESTRAINTS
- 5.2.2.1 Rapid changes in industrial automation technologies
- 5.2.3 OPPORTUNITIES
- 5.2.3.1 Shift toward remote operations and decentralized facilities
- 5.2.3.2 Unlocking automation with self-powered valve positioners in remote sites
- 5.2.4 CHALLENGES
- 5.2.4.1 Challenges associated with oversized control valves and positioner overshoot
- 5.2.1 DRIVERS
- 5.3 VALUE CHAIN ANALYSIS
- 5.4 ECOSYSTEM ANALYSIS
- 5.5 PRICING ANALYSIS
- 5.5.1 AVERAGE SELLING PRICE OF DIFFERENT TYPES OF VALVE POSITIONERS, BY KEY PLAYER, 2024
- 5.6 TRENDS/DISRUPTIONS IMPACTING CUSTOMER BUSINESS
- 5.7 TECHNOLOGY ANALYSIS
- 5.7.1 KEY TECHNOLOGIES
- 5.7.1.1 Digital communication protocols
- 5.7.1.2 Position feedback sensors
- 5.7.2 ADJACENT TECHNOLOGIES
- 5.7.2.1 SCADA
- 5.7.3 COMPLEMENTARY TECHNOLOGIES
- 5.7.3.1 Digital twin
- 5.7.1 KEY TECHNOLOGIES
- 5.8 PORTER'S FIVE FORCES ANALYSIS
- 5.8.1 THREAT OF NEW ENTRANTS
- 5.8.2 THREAT OF SUBSTITUTES
- 5.8.3 BARGAINING POWER OF SUPPLIERS
- 5.8.4 BARGAINING POWER OF BUYERS
- 5.8.5 INTENSITY OF COMPETITIVE RIVALRY
- 5.9 KEY STAKEHOLDERS AND BUYING CRITERIA
- 5.9.1 KEY STAKEHOLDERS IN BUYING PROCESS
- 5.9.2 BUYING CRITERIA
- 5.10 CASE STUDIES
- 5.11 TRADE ANALYSIS
- 5.11.1 IMPORT DATA (HS CODE 8481)
- 5.11.2 EXPORT DATA (HS CODE 8481)
- 5.12 PATENT ANALYSIS
- 5.13 KEY CONFERENCES AND EVENTS, 2025-2026
- 5.14 STANDARDS AND REGULATIONS
- 5.14.1 STANDARDS
- 5.14.2 REGULATORY BODIES, GOVERNMENT AGENCIES, AND OTHER ORGANIZATIONS
- 5.15 IMPACT OF AI/GENERATIVE AI ON VALVE POSITIONER MARKET
- 5.15.1 INTRODUCTION
- 5.15.2 IMPACT OF AI ON VALVE POSITIONER MARKET
- 5.15.3 TOP USE CASES AND MARKET POTENTIAL
- 5.16 IMPACT OF 2025 US TARIFF ON VALVE POSITIONER MARKET
- 5.16.1 INTRODUCTION
- 5.16.2 KEY TARIFF RATES
- 5.16.3 PRICE IMPACT ANALYSIS
- 5.16.4 IMPACT ON COUNTRY/REGION
- 5.16.4.1 US
- 5.16.4.2 Europe
- 5.16.4.3 Asia Pacific
- 5.16.5 IMPACT ON INDUSTRIES
6 VALVE POSITIONER MARKET, BY ACTUATION
- 6.1 INTRODUCTION
- 6.2 SINGLE-ACTING
- 6.2.1 EASY WORKING MECHANISM TO FUEL MARKET GROWTH
- 6.3 DOUBLE-ACTING
- 6.3.1 GROWING DEMAND FOR COMPACT-SIZE VALVES TO DRIVE MARKET
7 VALVE POSITIONER MARKET, BY INDUSTRY
- 7.1 INTRODUCTION
- 7.2 OIL & GAS
- 7.2.1 EMPHASIS ON REDUCING OPERATIONAL COSTS AND ENHANCE EFFICIENCY OF PLANTS TO DRIVE MARKET
- 7.3 WATER & WASTEWATER TREATMENT
- 7.3.1 RISING DEMAND FOR EFFECTIVE WATER MANAGEMENT ACROSS ENERGY AND URBAN INFRASTRUCTURE SECTORS TO FUEL MARKET GROWTH
- 7.4 ENERGY & POWER
- 7.4.1 INCREASING INVESTMENTS IN ENERGY SECTORS TO OFFER LUCRATIVE GROWTH OPPORTUNITIES
- 7.5 CHEMICALS
- 7.5.1 RISING FOCUS ON BOOSTING CHEMICAL PLANT SAFETY TO FUEL MARKET GROWTH
- 7.6 PAPER & PULP
- 7.6.1 ADOPTION OF DIGITALIZED PROCESSES TO OFFER LUCRATIVE GROWTH OPPORTUNITIES
- 7.7 PHARMACEUTICALS
- 7.7.1 STRINGENT REGULATORY GUIDELINES AND INCREASING COMPLEXITIES IN PRODUCT LINES TO BOOST DEMAND
- 7.8 METALS & MINING
- 7.8.1 INCREASING PRESSURE TO OPTIMIZE PROCESSES AND REDUCE UNPLANNED DOWNTIME TO SUPPORT MARKET GROWTH
- 7.9 FOOD & BEVERAGES
- 7.9.1 RISING SUSTAINABLE INTENSIFICATION OF AGRICULTURE TO BOOST PRODUCTIVITY TO FUEL MARKET GROWTH
- 7.10 OTHER INDUSTRIES
8 VALVE POSITIONER MARKET, BY TYPE
- 8.1 INTRODUCTION
- 8.2 PNEUMATIC POSITIONERS
- 8.2.1 ABILITY TO WORK EFFICIENTLY IN ADVERSE ENVIRONMENTAL CONDITIONS TO BOOST DEMAND
- 8.3 ELECTRO-PNEUMATIC POSITIONERS
- 8.3.1 ABILITY TO OFFER SOLUTIONS WITHOUT SIGNIFICANT INFRASTRUCTURE OR WORKFORCE TRAINING UPGRADES TO FUEL MARKET GROWTH
- 8.4 DIGITAL POSITIONERS
- 8.4.1 RISING DEMAND FOR AUTOMATED AND DATA-DRIVEN PLANT OPERATIONS TO FOSTER MARKET GROWTH
9 VALVE POSITIONER MARKET, BY REGION
- 9.1 INTRODUCTION
- 9.2 NORTH AMERICA
- 9.2.1 US
- 9.2.1.1 Growing investment in automation technologies to drive market
- 9.2.2 CANADA
- 9.2.2.1 Emphasis on improving water and wastewater infrastructure to foster market growth
- 9.2.3 MEXICO
- 9.2.3.1 Focus on expanding electricity generation, transmission, and distribution infrastructure to support market growth
- 9.2.1 US
- 9.3 EUROPE
- 9.3.1 UK
- 9.3.1.1 Rising focus digital automation to offer lucrative growth opportunities
- 9.3.2 GERMANY
- 9.3.2.1 Development of national hydrogen core network to foster market growth
- 9.3.3 FRANCE
- 9.3.3.1 Increasing demand for precision control technologies across energy sector to fuel market growth
- 9.3.4 REST OF EUROPE
- 9.3.1 UK
- 9.4 ASIA PACIFIC
- 9.4.1 CHINA
- 9.4.1.1 Emphasis on industrial modernization to boost demand
- 9.4.2 JAPAN
- 9.4.2.1 Need to optimize flow regulation and pressure control in fuel-based power plants to support market growth
- 9.4.3 INDIA
- 9.4.3.1 Government-led initiatives to boost adoption of automation components to fuel market growth
- 9.4.4 REST OF ASIA PACIFIC
- 9.4.1 CHINA
- 9.5 ROW
- 9.5.1 MIDDLE EAST & AFRICA
- 9.5.1.1 GCC
- 9.5.1.1.1 Adoption of Industry 4.0 technologies to offer lucrative growth opportunities
- 9.5.1.2 Africa & Rest of Middle East
- 9.5.1.1 GCC
- 9.5.2 SOUTH AMERICA
- 9.5.2.1 Brazil
- 9.5.2.1.1 Expanding public utilities and improving service reliability to support market growth
- 9.5.2.2 Rest of South America
- 9.5.2.1 Brazil
- 9.5.1 MIDDLE EAST & AFRICA
10 COMPETITIVE LANDSCAPE
- 10.1 OVERVIEW
- 10.2 KEY PLAYER STRATEGIES/RIGHT TO WIN, 2023-2025
- 10.3 REVENUE ANALYSIS, 2020-2024
- 10.4 MARKET SHARE ANALYSIS, 2024
- 10.5 COMPETITIVE EVALUATION MATRIX, 2024
- 10.5.1 STARS
- 10.5.2 EMERGING LEADERS
- 10.5.3 PERVASIVE PLAYERS
- 10.5.4 PARTICIPANTS
- 10.5.5 VALVE POSITIONER MARKET: COMPANY FOOTPRINT
- 10.5.5.1 Company footprint
- 10.5.5.2 Region footprint
- 10.5.5.3 Type footprint
- 10.5.5.4 Industry footprint
- 10.6 COMPANY EVALUAITON MATRIX: STARTUPS/SMES EVALUATION, 2024
- 10.6.1 PROGRESSIVE COMPANIES
- 10.6.2 RESPONSIVE COMPANIES
- 10.6.3 DYNAMIC COMPANIES
- 10.6.4 STARTING BLOCKS
- 10.6.5 COMPETITIVE BENCHMARKING: STARTUPS/SMES, 2024
- 10.6.5.1 List of key startups/SMEs
- 10.6.5.2 Competitive benchmarking of key startups/SMEs
- 10.7 COMPETITIVE SCENARIO
- 10.7.1 DEALS
- 10.7.2 EXPANSIONS
- 10.7.3 DEVELOPMENTS
11 COMPANY PROFILES
- 11.1 KEY PLAYERS
- 11.1.1 EMERSON ELECTRIC CO.
- 11.1.1.1 Business overview
- 11.1.1.2 Products/Services/Solutions offered
- 11.1.1.3 Recent developments
- 11.1.1.3.1 Emerson Electric Co.: Deals
- 11.1.1.4 MnM view
- 11.1.1.4.1 Key strengths/Right to win
- 11.1.1.4.2 Strategic choices
- 11.1.1.4.3 Weaknesses/Competitive threats
- 11.1.2 ABB
- 11.1.2.1 Business overview
- 11.1.2.2 Products/Services/Solutions offered
- 11.1.2.3 MnM view
- 11.1.2.3.1 Key strengths/Right to win
- 11.1.2.3.2 Strategic choices
- 11.1.2.3.3 Weaknesses/Competitive threats
- 11.1.3 FLOWSERVE CORPORATION
- 11.1.3.1 Business overview
- 11.1.3.2 Products/Services/Solutions offered
- 11.1.3.3 Recent developments
- 11.1.3.3.1 Flowserve Corporation: Developments
- 11.1.3.4 MnM view
- 11.1.3.4.1 Key strengths/Right to win
- 11.1.3.4.2 Strategic choices
- 11.1.3.4.3 Weaknesses/Competitive threats
- 11.1.4 SIEMENS
- 11.1.4.1 Business overview
- 11.1.4.2 Products/Services/Solutions offered
- 11.1.4.3 MnM view
- 11.1.4.3.1 Key strengths/Right to win
- 11.1.4.3.2 Strategic choices
- 11.1.4.3.3 Weaknesses/Competitive threats
- 11.1.5 SCHNEIDER ELECTRIC
- 11.1.5.1 Business overview
- 11.1.5.2 Products/Services/Solutions offered
- 11.1.5.3 MnM view
- 11.1.5.3.1 Key strengths/Right to win
- 11.1.5.3.2 Strategic choices
- 11.1.5.3.3 Weaknesses/Competitive threats
- 11.1.6 SMC CORPORATION
- 11.1.6.1 Business overview
- 11.1.6.2 Products/Services/Solutions offered
- 11.1.7 AZBIL CORPORATION
- 11.1.7.1 Business overview
- 11.1.7.2 Products/Services/Solutions offered
- 11.1.7.3 Recent developments
- 11.1.7.3.1 Azbil Corporation: Expansions
- 11.1.8 BAKER HUGHES
- 11.1.8.1 Business overview
- 11.1.8.2 Products/Services/Solutions offered
- 11.1.9 ROTORK PLC
- 11.1.9.1 Business overview
- 11.1.9.2 Products/Services/Solutions offered
- 11.1.9.3 Recent developments
- 11.1.9.3.1 Rotork Plc: Deals
- 11.1.10 VALMET
- 11.1.10.1 Business overview
- 11.1.10.2 Products/Services/Solutions offered
- 11.1.1 EMERSON ELECTRIC CO.
- 11.2 OTHER PLAYERS
- 11.2.1 SAMSONCONTROLS.NET.
- 11.2.2 VRG CONTROLS, LLC
- 11.2.3 FESTO SE & CO. KG (FESTO)
- 11.2.4 BADGER METER, INC.
- 11.2.5 CONTROLAIR
- 11.2.6 CRANE COMPANY
- 11.2.7 CHRISTIAN BURKERT GMBH & CO. KG
- 11.2.8 GEMU GROUP
- 11.2.9 DWYER INSTRUMENTS LTD
- 11.2.10 VRC
- 11.2.11 POWER-GENEX LTD.
- 11.2.12 VAL CONTROLS
- 11.2.13 BRAY INTERNATIONAL
- 11.2.14 NIHON KOSO CO., LTD.
- 11.2.15 SPIRAX SARCO LIMITED
12 APPENDIX
- 12.1 DISCUSSION GUIDE
- 12.2 KNOWLEDGESTORE: MARKETSANDMARKETS' SUBSCRIPTION PORTAL
- 12.3 AVAILABLE CUSTOMIZATIONS
- 12.4 RELATED REPORTS
- 12.5 AUTHOR DETAILS
List of Tables
- TABLE 1 VALVE POSITIONER MARKET: INCLUSIONS AND EXCLUSIONS
- TABLE 2 ROLE OF PLAYERS IN VALVE POSITIONER ECOSYSTEM
- TABLE 3 AVERAGE SELLING PRICES OF VALVE POSITIONERS, 2024
- TABLE 4 AVERAGE SELLING PRICE OF DIFFERENT TYPES OF VALVE POSITIONERS OFFERED BY KEY PLAYERS, 2024 (USD)
- TABLE 5 VALVE POSITIONER MARKET: PORTER'S FIVE FORCES ANALYSIS
- TABLE 6 INFLUENCE OF STAKEHOLDERS ON BUYING PROCESS FOR TOP THREE INDUSTRIES (%)
- TABLE 7 KEY BUYING CRITERIA FOR TOP THREE INDUSTRIES
- TABLE 8 MITSUBISHI CHEMICAL CORPORATION USED CLOUD-BASED SERVICES WITH SMART VALVE POSITIONERS TO IMPROVE PLANT OPERATION
- TABLE 9 SIEMENS AG USED PS2 DIGITAL VALVE POSITIONER ON FEEDWATER VALVE AND STARTUP VALVE IN POWER PLANT THAT PROVIDED ACCURATE FEEDBACK INDICATION TO CONTROL ROOM
- TABLE 10 AZBIL CORPORATION IMPLEMENTED COMMUNICATION CAPABLE SVP3000 ALPHPLUS DIGITAL POSITIONERS THAT REDUCED MAINTENANCE WORKLOAD OF EASTERN PETROCHEMICAL COMPANY
- TABLE 11 IMPORT DATA FOR HS CODE 8481-COMPLIANT PRODUCTS, BY COUNTRY, 2020-2024 (USD MILLION)
- TABLE 12 EXPORT DATA FOR HS CODE 8481-COMPLIANT PRODUCTS, BY COUNTRY, 2020-2024 (USD MILLION)
- TABLE 13 LIST OF KEY PATENTS, 2024
- TABLE 14 VALVE POSITIONER MARKET: LIST OF CONFERENCES AND EVENTS, 2025-2026
- TABLE 15 STANDARDS FOR VALVE POSITIONERS
- TABLE 16 NORTH AMERICA: LIST OF REGULATORY BODIES, GOVERNMENT AGENCIES, AND OTHER ORGANIZATIONS
- TABLE 17 EUROPE: LIST OF REGULATORY BODIES, GOVERNMENT AGENCIES, AND OTHER ORGANIZATIONS
- TABLE 18 ASIA PACIFIC: LIST OF REGULATORY BODIES, GOVERNMENT AGENCIES, AND OTHER ORGANIZATIONS
- TABLE 19 ROW: LIST OF REGULATORY BODIES, GOVERNMENT AGENCIES, AND OTHER ORGANIZATIONS
- TABLE 20 US-ADJUSTED RECIPROCAL TARIFF RATES, 2024 (USD BILLION)
- TABLE 21 KEY PRODUCT-RELATED TARIFF EFFECTIVE FOR VALVE POSITIONER MARKET, 2024
- TABLE 22 VALVE POSITIONER MARKET, BY ACTUATION, 2021-2024 (USD MILLION)
- TABLE 23 VALVE POSITIONER MARKET, BY ACTUATION, 2025-2030 (USD MILLION)
- TABLE 24 VALVE POSITIONER MARKET, BY INDUSTRY, 2021-2024 (USD MILLION)
- TABLE 25 VALVE POSITIONER MARKET, BY INDUSTRY, 2025-2030 (USD MILLION)
- TABLE 26 OIL & GAS: VALVE POSITIONER MARKET, BY REGION, 2021-2024 (USD MILLION)
- TABLE 27 OIL & GAS: VALVE POSITIONER MARKET, BY REGION, 2025-2030 (USD MILLION)
- TABLE 28 OIL & GAS: VALVE POSITIONER MARKET IN NORTH AMERICA, BY COUNTRY, 2021-2024 (USD MILLION)
- TABLE 29 OIL & GAS: VALVE POSITIONER MARKET IN NORTH AMERICA, BY COUNTRY, 2025-2030 (USD MILLION)
- TABLE 30 OIL & GAS: VALVE POSITIONER MARKET IN EUROPE, BY COUNTRY, 2021-2024 (USD MILLION)
- TABLE 31 OIL & GAS: VALVE POSITIONER MARKET IN EUROPE, BY COUNTRY, 2025-2030 (USD MILLION)
- TABLE 32 OIL & GAS: VALVE POSITIONER MARKET IN ASIA PACIFIC, BY COUNTRY, 2021-2024 (USD MILLION)
- TABLE 33 OIL & GAS: VALVE POSITIONER MARKET IN ASIA PACIFIC, BY COUNTRY, 2025-2030 (USD MILLION)
- TABLE 34 OIL & GAS: VALVE POSITIONER MARKET IN ROW, BY COUNTRY, 2021-2024 (USD MILLION)
- TABLE 35 OIL & GAS: VALVE POSITIONER MARKET IN ROW, BY COUNTRY, 2025-2030 (USD MILLION)
- TABLE 36 WATER & WASTEWATER TREATMENT: VALVE POSITIONER MARKET, BY REGION, 2021-2024 (USD MILLION)
- TABLE 37 WATER & WASTEWATER TREATMENT: VALVE POSITIONER MARKET, BY REGION, 2025-2030 (USD MILLION)
- TABLE 38 WATER & WASTEWATER TREATMENT: VALVE POSITIONER MARKET IN NORTH AMERICA, BY COUNTRY, 2021-2024 (USD MILLION)
- TABLE 39 WATER & WASTEWATER TREATMENT: VALVE POSITIONER MARKET IN NORTH AMERICA, BY COUNTRY, 2025-2030 (USD MILLION)
- TABLE 40 WATER & WASTEWATER TREATMENT: VALVE POSITIONER MARKET IN EUROPE, BY COUNTRY, 2021-2024 (USD MILLION)
- TABLE 41 WATER & WASTEWATER TREATMENT: VALVE POSITIONER MARKET IN EUROPE, BY COUNTRY, 2025-2030 (USD MILLION)
- TABLE 42 WATER & WASTEWATER TREATMENT: VALVE POSITIONER MARKET IN ASIA PACIFIC, BY COUNTRY, 2021-2024 (USD MILLION)
- TABLE 43 WATER & WASTEWATER TREATMENT: VALVE POSITIONER MARKET IN ASIA PACIFIC, BY COUNTRY, 2025-2030 (USD MILLION)
- TABLE 44 WATER & WASTEWATER TREATMENT: VALVE POSITIONER MARKET IN ROW, BY COUNTRY, 2021-2024 (USD MILLION)
- TABLE 45 WATER & WASTEWATER TREATMENT: VALVE POSITIONER MARKET IN ROW, BY COUNTRY, 2025-2030 (USD MILLION)
- TABLE 46 ENERGY & POWER: VALVE POSITIONER MARKET, BY REGION, 2021-2024 (USD MILLION)
- TABLE 47 ENERGY & POWER: VALVE POSITIONER MARKET, BY REGION, 2025-2030 (USD MILLION)
- TABLE 48 ENERGY & POWER: VALVE POSITIONER MARKET IN NORTH AMERICA, BY COUNTRY, 2021-2024 (USD MILLION)
- TABLE 49 ENERGY & POWER: VALVE POSITIONER MARKET IN NORTH AMERICA, BY COUNTRY, 2025-2030 (USD MILLION)
- TABLE 50 ENERGY & POWER: VALVE POSITIONER MARKET IN EUROPE, BY COUNTRY, 2021-2024 (USD MILLION)
- TABLE 51 ENERGY & POWER: VALVE POSITIONER MARKET IN EUROPE, BY COUNTRY, 2025-2030 (USD MILLION)
- TABLE 52 ENERGY & POWER: VALVE POSITIONER MARKET IN ASIA PACIFIC, BY COUNTRY, 2021-2024 (USD MILLION)
- TABLE 53 ENERGY & POWER: VALVE POSITIONER MARKET IN ASIA PACIFIC, BY COUNTRY, 2025-2030 (USD MILLION)
- TABLE 54 ENERGY & POWER: VALVE POSITIONER MARKET IN ROW, BY COUNTRY, 2021-2024 (USD MILLION)
- TABLE 55 ENERGY & POWER: VALVE POSITIONER MARKET IN ROW, BY COUNTRY, 2025-2030 (USD MILLION)
- TABLE 56 CHEMICALS: VALVE POSITIONER MARKET, BY REGION, 2021-2024 (USD MILLION)
- TABLE 57 CHEMICALS: VALVE POSITIONER MARKET, BY REGION, 2025-2030 (USD MILLION)
- TABLE 58 CHEMICALS: VALVE POSITIONER MARKET IN NORTH AMERICA, BY COUNTRY, 2021-2024 (USD MILLION)
- TABLE 59 CHEMICALS: VALVE POSITIONER MARKET IN NORTH AMERICA, BY COUNTRY, 2025-2030 (USD MILLION)
- TABLE 60 CHEMICALS: VALVE POSITIONER MARKET IN EUROPE, BY COUNTRY, 2021-2024 (USD MILLION)
- TABLE 61 CHEMICALS: VALVE POSITIONER MARKET IN EUROPE, BY COUNTRY, 2025-2030 (USD MILLION)
- TABLE 62 CHEMICALS: VALVE POSITIONER MARKET IN ASIA PACIFIC, BY COUNTRY, 2021-2024 (USD MILLION)
- TABLE 63 CHEMICALS: VALVE POSITIONER MARKET IN ASIA PACIFIC, BY COUNTRY, 2025-2030 (USD MILLION)
- TABLE 64 CHEMICALS: VALVE POSITIONER MARKET IN ROW, BY COUNTRY, 2021-2024 (USD MILLION)
- TABLE 65 CHEMICALS: VALVE POSITIONER MARKET IN ROW, BY COUNTRY, 2025-2030 (USD MILLION)
- TABLE 66 PAPER & PULP: VALVE POSITIONER MARKET, BY REGION, 2021-2024 (USD MILLION)
- TABLE 67 PAPER & PULP: VALVE POSITIONER MARKET, BY REGION, 2025-2030 (USD MILLION)
- TABLE 68 PAPER & PULP: VALVE POSITIONER MARKET IN NORTH AMERICA, BY COUNTRY, 2021-2024 (USD MILLION)
- TABLE 69 PAPER & PULP: VALVE POSITIONER MARKET IN NORTH AMERICA, BY COUNTRY, 2025-2030 (USD MILLION)
- TABLE 70 PAPER & PULP: VALVE POSITIONER MARKET IN EUROPE, BY COUNTRY, 2021-2024 (USD MILLION)
- TABLE 71 PAPER & PULP: VALVE POSITIONER MARKET IN EUROPE, BY COUNTRY, 2025-2030 (USD MILLION)
- TABLE 72 PAPER & PULP: VALVE POSITIONER MARKET IN ASIA PACIFIC, BY COUNTRY, 2021-2024 (USD MILLION)
- TABLE 73 PAPER & PULP: VALVE POSITIONER MARKET IN ASIA PACIFIC, BY COUNTRY, 2025-2030 (USD MILLION)
- TABLE 74 PAPER & PULP: VALVE POSITIONER MARKET IN ROW, BY COUNTRY, 2021-2024 (USD MILLION)
- TABLE 75 PAPER & PULP: VALVE POSITIONER MARKET IN ROW, BY COUNTRY, 2025-2030 (USD MILLION)
- TABLE 76 PHARMACEUTICALS: VALVE POSITIONER MARKET, BY REGION, 2021-2024 (USD MILLION)
- TABLE 77 PHARMACEUTICALS: VALVE POSITIONER MARKET, BY REGION, 2025-2030 (USD MILLION)
- TABLE 78 PHARMACEUTICALS: VALVE POSITIONER MARKET IN NORTH AMERICA, BY COUNTRY, 2021-2024 (USD MILLION)
- TABLE 79 PHARMACEUTICALS: VALVE POSITIONER MARKET IN NORTH AMERICA, BY COUNTRY, 2025-2030 (USD MILLION)
- TABLE 80 PHARMACEUTICALS: VALVE POSITIONER MARKET IN EUROPE, BY COUNTRY, 2021-2024 (USD MILLION)
- TABLE 81 PHARMACEUTICALS: VALVE POSITIONER MARKET IN EUROPE, BY COUNTRY, 2025-2030 (USD MILLION)
- TABLE 82 PHARMACEUTICALS: VALVE POSITIONER MARKET IN ASIA PACIFIC, BY COUNTRY, 2021-2024 (USD MILLION)
- TABLE 83 PHARMACEUTICALS: VALVE POSITIONER MARKET IN ASIA PACIFIC, BY COUNTRY, 2025-2030 (USD MILLION)
- TABLE 84 PHARMACEUTICALS: VALVE POSITIONER MARKET IN ROW, BY COUNTRY, 2021-2024 (USD MILLION)
- TABLE 85 PHARMACEUTICALS: VALVE POSITIONER MARKET IN ROW, BY COUNTRY, 2025-2030 (USD MILLION)
- TABLE 86 METALS & MINING: VALVE POSITIONER MARKET, BY REGION, 2021-2024 (USD MILLION)
- TABLE 87 METALS & MINING: VALVE POSITIONER MARKET, BY REGION, 2025-2030 (USD MILLION)
- TABLE 88 METALS & MINING: VALVE POSITIONER MARKET IN NORTH AMERICA, BY COUNTRY, 2021-2024 (USD MILLION)
- TABLE 89 METALS & MINING: VALVE POSITIONER MARKET IN NORTH AMERICA, BY COUNTRY, 2025-2030 (USD MILLION)
- TABLE 90 METALS & MINING: VALVE POSITIONER MARKET IN EUROPE, BY COUNTRY, 2021-2024 (USD MILLION)
- TABLE 91 METALS & MINING: VALVE POSITIONER MARKET IN EUROPE, 2025-2030 (USD MILLION)
- TABLE 92 METALS & MINING: VALVE POSITIONER MARKET IN ASIA PACIFIC, BY COUNTRY, 2021-2024 (USD MILLION)
- TABLE 93 METALS & MINING: VALVE POSITIONER MARKET IN ASIA PACIFIC, BY COUNTRY, 2025-2030 (USD MILLION)
- TABLE 94 METALS & MINING: VALVE POSITIONER MARKET IN ROW, BY COUNTRY, 2021-2024 (USD MILLION)
- TABLE 95 METALS & MINING: VALVE POSITIONER MARKET IN ROW, BY COUNTRY, 2025-2030 (USD MILLION)
- TABLE 96 FOOD & BEVERAGES: VALVE POSITIONER MARKET, BY REGION, 2021-2024 (USD MILLION)
- TABLE 97 FOOD & BEVERAGES: VALVE POSITIONER MARKET, BY REGION, 2025-2030 (USD MILLION)
- TABLE 98 FOOD & BEVERAGES: VALVE POSITIONER MARKET IN NORTH AMERICA, BY COUNTRY, 2021-2024 (USD MILLION)
- TABLE 99 FOOD & BEVERAGES: VALVE POSITIONER MARKET IN NORTH AMERICA, BY COUNTRY, 2025-2030 (USD MILLION)
- TABLE 100 FOOD & BEVERAGES: VALVE POSITIONER MARKET IN EUROPE, BY COUNTRY, 2021-2024 (USD MILLION)
- TABLE 101 FOOD & BEVERAGES: VALVE POSITIONER MARKET IN EUROPE, BY COUNTRY, 2025-2030 (USD MILLION)
- TABLE 102 FOOD & BEVERAGES: VALVE POSITIONER MARKET IN ASIA PACIFIC, BY COUNTRY, 2021-2024 (USD MILLION)
- TABLE 103 FOOD & BEVERAGES: VALVE POSITIONER MARKET IN ASIA PACIFIC, BY COUNTRY, 2025-2030 (USD MILLION)
- TABLE 104 FOOD & BEVERAGES: VALVE POSITIONER MARKET IN ROW, BY COUNTRY, 2021-2024 (USD MILLION)
- TABLE 105 FOOD & BEVERAGES: VALVE POSITIONER MARKET IN ROW, BY COUNTRY, 2025-2030 (USD MILLION)
- TABLE 106 OTHER INDUSTRIES: VALVE POSITIONER MARKET, BY REGION, 2021-2024 (USD MILLION)
- TABLE 107 OTHER INDUSTRIES: VALVE POSITIONER MARKET, BY REGION, 2025-2030 (USD MILLION)
- TABLE 108 OTHER INDUSTRIES: VALVE POSITIONER MARKET IN NORTH AMERICA, BY COUNTRY, 2021-2024 (USD MILLION)
- TABLE 109 OTHER INDUSTRIES: VALVE POSITIONER MARKET IN NORTH AMERICA, BY COUNTRY, 2025-2030 (USD MILLION)
- TABLE 110 OTHER INDUSTRIES: VALVE POSITIONER MARKET IN EUROPE, BY COUNTRY, 2021-2024 (USD MILLION)
- TABLE 111 OTHER INDUSTRIES: VALVE POSITIONER MARKET IN EUROPE, BY COUNTRY, 2025-2030 (USD MILLION)
- TABLE 112 OTHER INDUSTRIES: VALVE POSITIONER MARKET IN ASIA PACIFIC, BY COUNTRY, 2021-2024 (USD MILLION)
- TABLE 113 OTHER INDUSTRIES: VALVE POSITIONER MARKET IN ASIA PACIFIC, BY COUNTRY, 2025-2030 (USD MILLION)
- TABLE 114 OTHER INDUSTRIES: VALVE POSITIONER MARKET IN ROW, BY COUNTRY, 2021-2024 (USD MILLION)
- TABLE 115 OTHER INDUSTRIES: VALVE POSITIONER MARKET IN ROW, BY COUNTRY, 2025-2030 (USD MILLION)
- TABLE 116 VALVE POSITIONER MARKET, BY TYPE, 2021-2024 (USD MILLION)
- TABLE 117 VALVE POSITIONER MARKET, BY TYPE, 2025-2030 (USD MILLION)
- TABLE 118 VALVE POSITIONER MARKET, BY TYPE, 2021-2024 (THOUSAND UNITS)
- TABLE 119 VALVE POSITIONER MARKET, BY TYPE, 2025-2030 (THOUSAND UNITS)
- TABLE 120 VALVE POSITIONER MARKET, BY REGION, 2021-2024 (USD MILLION)
- TABLE 121 VALVE POSITIONER MARKET, BY REGION, 2025-2030 (USD MILLION)
- TABLE 122 NORTH AMERICA: VALVE POSITIONER MARKET, BY COUNTRY, 2021-2024 (USD MILLION)
- TABLE 123 NORTH AMERICA: VALVE POSITIONER MARKET, BY COUNTRY, 2025-2030 (USD MILLION)
- TABLE 124 NORTH AMERICA: VALVE POSITIONER MARKET, BY INDUSTRY, 2021-2024 (USD MILLION)
- TABLE 125 NORTH AMERICA: VALVE POSITIONER MARKET, BY INDUSTRY, 2025-2030 (USD MILLION)
- TABLE 126 EUROPE: VALVE POSITIONER MARKET, BY COUNTRY, 2021-2024 (USD MILLION)
- TABLE 127 EUROPE: VALVE POSITIONER MARKET, BY COUNTRY, 2025-2030 (USD MILLION)
- TABLE 128 EUROPE: VALVE POSITIONER MARKET, BY INDUSTRY, 2021-2024 (USD MILLION)
- TABLE 129 EUROPE: VALVE POSITIONER MARKET, BY INDUSTRY, 2025-2030 (USD MILLION)
- TABLE 130 ASIA PACIFIC: VALVE POSITIONER MARKET, BY COUNTRY, 2021-2024 (USD MILLION)
- TABLE 131 ASIA PACIFIC: VALVE POSITIONER MARKET, BY COUNTRY, 2025-2030 (USD MILLION)
- TABLE 132 ASIA PACIFIC: VALVE POSITIONER MARKET, BY INDUSTRY, 2021-2024 (USD MILLION)
- TABLE 133 ASIA PACIFIC: VALVE POSITIONER MARKET, BY INDUSTRY, 2025-2030 (USD MILLION)
- TABLE 134 ROW: VALVE POSITIONER MARKET, BY REGION, 2021-2024 (USD MILLION)
- TABLE 135 ROW: VALVE POSITIONER MARKET, BY REGION, 2025-2030 (USD MILLION)
- TABLE 136 ROW: VALVE POSITIONER MARKET, BY INDUSTRY, 2021-2024 (USD MILLION)
- TABLE 137 ROW: VALVE POSITIONER MARKET, BY INDUSTRY, 2025-2030 (USD MILLION)
- TABLE 138 MIDDLE EAST & AFRICA: VALVE POSITIONER MARKET, BY GEOGRAPHY, 2021-2024 (USD MILLION)
- TABLE 139 MIDDLE EAST & AFRICA: VALVE POSITIONER MARKET, BY GEOGRAPHY, 2025-2030 (USD MILLION)
- TABLE 140 SOUTH AMERICA: VALVE POSITIONER MARKET, BY COUNTRY, 2021-2024 (USD MILLION)
- TABLE 141 SOUTH AMERICA: VALVE POSITIONER MARKET, BY COUNTRY, 2025-2030 (USD MILLION)
- TABLE 142 OVERVIEW OF STRATEGIES ADOPTED BY KEY PLAYERS, JANUARY 2023-JULY 2025
- TABLE 143 VALVE POSITIONER MARKET SHARE ANALYSIS, 2024
- TABLE 144 VALVE POSITIONER MARKET: REGION FOOTPRINT
- TABLE 145 VALVE POSITIONER MARKET: TYPE FOOTPRINT
- TABLE 146 VALVE POSITIONER MARKET: INDUSTRY FOOTPRINT
- TABLE 147 VALVE POSITIONER MARKET: LIST OF KEY STARTUPS/SMES, 2024
- TABLE 148 VALVE POSITIONER MARKET: COMPETITIVE BENCHMARKING OF KEY STARTUPS/SMES, 2024
- TABLE 149 VALVE POSITIONER MARKET: DEALS, JANUARY 2023-JULY 2025
- TABLE 150 VALVE POSITIONER MARKET: EXPANSIONS, JANUARY 2023-JULY 2025
- TABLE 151 VALVE POSITIONER MARKET: DEVELOPMENTS, JANUARY 2023-JULY 2025
- TABLE 152 EMERSON ELECTRIC CO.: COMPANY OVERVIEW
- TABLE 153 EMERSON ELECTRIC CO.: PRODUCTS/SERVICES/SOLUTIONS OFFERED
- TABLE 154 EMERSON ELECTRIC CO.: DEALS
- TABLE 155 ABB: COMPANY OVERVIEW
- TABLE 156 ABB: PRODUCTS/SERVICES/SOLUTIONS OFFERED
- TABLE 157 FLOWSERVE CORPORATION: COMPANY OVERVIEW
- TABLE 158 FLOWSERVE CORPORATION: PRODUCTS/SERVICES/SOLUTIONS OFFERED
- TABLE 159 FLOWSERVE CORPORATION: DEVELOPMENTS
- TABLE 160 SIEMENS: COMPANY OVERVIEW
- TABLE 161 SIEMENS: PRODUCTS/SERVICES/SOLUTIONS OFFERED
- TABLE 162 SCHNEIDER ELECTRIC: COMPANY OVERVIEW
- TABLE 163 SCHNEIDER ELECTRIC: PRODUCTS/SERVICES/SOLUTIONS OFFERED
- TABLE 164 SMC CORPORATION: COMPANY OVERVIEW
- TABLE 165 SMC CORPORATION: PRODUCTS/SERVICES/SOLUTIONS OFFERED
- TABLE 166 AZBIL CORPORATION: COMPANY OVERVIEW
- TABLE 167 AZBIL CORPORATION: PRODUCTS/SERVICES/SOLUTIONS OFFERED
- TABLE 168 AZBIL CORPORATION: EXPANSIONS
- TABLE 169 BAKER HUGHES: COMPANY OVERVIEW
- TABLE 170 BAKER HUGHES: PRODUCTS/SERVICES/SOLUTIONS OFFERED
- TABLE 171 ROTORK PLC: COMPANY OVERVIEW
- TABLE 172 ROTORK PLC: PRODUCTS/SERVICES/SOLUTIONS OFFERED
- TABLE 173 ROTORK PLC: DEALS
- TABLE 174 VALMET: COMPANY OVERVIEW
- TABLE 175 VALMET: PRODUCTS/SERVICES/SOLUTIONS OFFERED
- TABLE 176 SAMSONCONTROLS.NET.: COMPANY OVERVIEW
- TABLE 177 VRG CONTROLS LLC: COMPANY OVERVIEW
- TABLE 178 FESTO SE & CO. KG (FESTO): COMPANY OVERVIEW
- TABLE 179 BADGER METER, INC.: COMPANY OVERVIEW
- TABLE 180 CONTROLAIR: COMPANY OVERVIEW
- TABLE 181 CRANE COMPANY: COMPANY OVERVIEW
- TABLE 182 CHRISTIAN BURKERT GMBH & CO. KG: COMPANY OVERVIEW
- TABLE 183 GEMU GROUP: COMPANY OVERVIEW
- TABLE 184 DWYER INSTRUMENTS LTD: COMPANY OVERVIEW
- TABLE 185 VRC: COMPANY OVERVIEW
- TABLE 186 POWER-GENEX LTD.: COMPANY OVERVIEW
- TABLE 187 VAL CONTROLS: COMPANY OVERVIEW
- TABLE 188 BRAY INTERNATIONAL: COMPANY OVERVIEW
- TABLE 189 NIHON KOSO CO., LTD.: COMPANY OVERVIEW
- TABLE 190 SPIRAX SARCO LIMITED: COMPANY OVERVIEW
List of Figures
- FIGURE 1 VALVE POSITIONER MARKET AND REGIONAL SEGMENTATION
- FIGURE 2 VALVE POSITIONER MARKET: RESEARCH DESIGN
- FIGURE 3 VALVE POSITIONER MARKET: RESEARCH APPROACH
- FIGURE 4 VALVE POSITIONER MARKET: BOTTOM-UP APPROACH
- FIGURE 5 VALVE POSITIONER MARKET: TOP-DOWN APPROACH
- FIGURE 6 VALVE POSITIONER MARKET SIZE ESTIMATION METHODOLOGY
- FIGURE 7 DATA TRIANGULATION
- FIGURE 8 DIGITAL VALVE POSITIONER TO HOLD MAXIMUM MARKET SHARE IN 2025
- FIGURE 9 SINGLE-ACTING POSITIONERS TO ACCOUNT FOR LARGER MARKET SHARE IN 2030
- FIGURE 10 WATER & WASTEWATER TREATMENT INDUSTRY TO CAPTURE LARGEST MARKET SHARE IN 2030
- FIGURE 11 ASIA PACIFIC ACCOUNTED FOR LARGEST MARKET SHARE IN 2024
- FIGURE 12 RISING ADOPTION OF SMART VALVE POSITIONERS IN VARIOUS PLANT OPERATIONS IN PROCESS INDUSTRIES TO BOOST MARKET GROWTH
- FIGURE 13 DIGITAL POSITIONERS TO HOLD LARGEST MARKET SIZE IN 2030
- FIGURE 14 SINGLE-ACTING POSITIONERS TO SECURE LARGER MARKET SHARE IN 2030
- FIGURE 15 OIL & GAS TO DOMINATE MARKET IN 2030
- FIGURE 16 INDIA TO EXHIBIT HIGHEST CAGR DURING FORECAST PERIOD
- FIGURE 17 VALVE POSITIONER MARKET: DRIVERS, RESTRAINTS, OPPORTUNITIES, AND CHALLENGES
- FIGURE 18 VALVE POSITIONER MARKET: IMPACT ANALYSIS OF DRIVERS
- FIGURE 19 VALVE POSITIONER MARKET: IMPACT ANALYSIS OF RESTRAINTS
- FIGURE 20 VALVE POSITIONER MARKET: IMPACT ANALYSIS OF OPPORTUNITIES
- FIGURE 21 VALVE POSITIONER MARKET: IMPACT ANALYSIS OF CHALLENGES
- FIGURE 22 VALUE CHAIN ANALYSIS: MAJOR VALUE ADDED BY ORIGINAL EQUIPMENT MANUFACTURERS
- FIGURE 23 VALVE POSITIONER ECOSYSTEM ANALYSIS
- FIGURE 24 AVERAGE SELLING PRICE OF DIFFERENT TYPES OF VALVE POSITIONERS, BY KEY PLAYER, 2024
- FIGURE 25 TRENDS/DISRUPTIONS IMPACTING CUSTOMER BUSINESS
- FIGURE 26 VALVE POSITIONER MARKET: PORTER'S FIVE FORCES ANALYSIS
- FIGURE 27 INFLUENCE OF STAKEHOLDERS ON BUYING PROCESS FOR TOP THREE INDUSTRIES
- FIGURE 28 KEY BUYING CRITERIA FOR TOP THREE INDUSTRIES
- FIGURE 29 IMPORT DATA FOR HS CODE 8481-COMPLIANT PRODUCTS, BY COUNTRY, 2020-2024
- FIGURE 30 EXPORT DATA FOR HS CODE 8481 -COMPLIANT PRODUCTS, BY COUNTRY, 2020-2024
- FIGURE 31 PATENTS APPLIED AND GRANTED, 2015-2024
- FIGURE 32 KEY AI USE CASES IN VALVE POSITIONER MARKET
- FIGURE 33 SINGLE-ACTING SEGMENT TO LEAD MARKET DURING FORECAST PERIOD
- FIGURE 34 SCHEMATIC OF SINGLE-ACTING POSITIONERS
- FIGURE 35 SCHEMATIC OF DOUBLE-ACTING POSITIONERS
- FIGURE 36 VALVE POSITIONER MARKET, BY INDUSTRY
- FIGURE 37 WATER & WASTEWATER TREATMENT INDUSTRY TO GROW AT HIGHEST CAGR DURING FORECAST PERIOD
- FIGURE 38 DIGITAL POSITIONERS TO GROW AT FASTEST GROWTH RATE DURING FORECAST PERIOD
- FIGURE 39 WORKING PRINCIPLE OF PNEUMATIC POSITIONERS
- FIGURE 40 SALIENT FEATURES OF ELECTRO-PNEUMATIC POSITIONER
- FIGURE 41 ADVANTAGES OF DIGITAL POSITIONERS
- FIGURE 42 VALVE POSITIONER MARKET, BY REGION
- FIGURE 43 ASIA PACIFIC TO GROW AT HIGHEST CAGR DURING FORECAST PERIOD
- FIGURE 44 INDIA TO OFFER MOST LUCRATIVE OPPORTUNITIES DURING FORECAST PERIOD
- FIGURE 45 NORTH AMERICA: VALVE POSITIONER MARKET SNAPSHOT
- FIGURE 46 EUROPE: VALVE POSITIONER MARKET SNAPSHOT
- FIGURE 47 ASIA PACIFIC: VALVE POSITIONER MARKET SNAPSHOT
- FIGURE 48 VALVE POSITIONER MARKET: REVENUE ANALYSIS OF FIVE KEY PLAYERS, 2020-2024
- FIGURE 49 MARKET SHARE ANALYSIS OF COMPANIES OFFERING VALVE PPOSITIONERS, 2024
- FIGURE 50 VALVE POSITIONER MARKET: COMPANY EVALUATION MATRIX (KEY PLAYERS), 2024
- FIGURE 51 VALVE POSITIONER MARKET: COMPANY FOOTPRINT
- FIGURE 52 VALVE POSITIONER MARKET: COMPANY EVALUATION MATRIX (STARTUPS/SME), 2024
- FIGURE 53 EMERSON ELECTRIC CO.: COMPANY SNAPSHOT
- FIGURE 54 ABB: COMPANY SNAPSHOT
- FIGURE 55 FLOWSERVE CORPORATION: COMPANY SNAPSHOT
- FIGURE 56 SIEMENS: COMPANY SNAPSHOT
- FIGURE 57 SCHNEIDER ELECTRIC: COMPANY SNAPSHOT
- FIGURE 58 SMC CORPORATION: COMPANY SNAPSHOT
- FIGURE 59 AZBIL CORPORATION: COMPANY SNAPSHOT
- FIGURE 60 BAKER HUGHES: COMPANY SNAPSHOT
- FIGURE 61 ROTORK PLC: COMPANY SNAPSHOT
- FIGURE 62 VALMET: COMPANY SNAPSHOT
 再生能源回饋設備市場規模、佔有率和成長分析:按技術/架構、容量/額定功率、應用領域、終端用戶產業和地區分類 - 產業預測,2026-2033年
 六足定位器市場:依負載能力、精確度、工作範圍、終端用戶產業及驅動系統分類-2026-2032年全球預測軌道交通能量回饋設備市場:依設備類型、安裝類型、應用程式、最終用戶和銷售管道,全球預測,2026-2032年
 2026年全球閥門定位器市場報告
 閥門定位器市場規模、佔有率和趨勢分析報告:按產品類型、應用、地區和細分市場預測(2025-2033 年)氣動閥門位置回饋裝置市場(按類型、致動器類型、驅動類型、調整類型、安裝類型、最終用途和分銷管道)—全球預測,2025-2030 年閥門定位器市場(按產品、技術、閥門類型、應用和產業)—2025-2030 年全球預測