


 |
市場調查報告書
商品編碼
1788493
銀行業務的詐欺偵測·防止市場:2025-2030年Fraud Detection & Prevention in Banking Market: 2025-2030 |
||||||
合成身分構成威脅,到 2030 年全球金融機構將因詐欺損失高達 583 億美元
| 主要統計 | |
|---|---|
| 金融機構詐欺偵測與預防支出(2025 年): | 211億美元 |
| 金融機構詐欺偵測與預防支出(2030 年): | 391億美元 |
| 從2025年~2030年的市場成長率: | 85.5% |
| 預測期間: | 2025-2030年 |
概述
本研究套件提供全面深入分析各類詐欺及其打擊方法。這使得包括銀行、金融機構和金融科技公司在內的利害關係人能夠了解未來的成長、關鍵趨勢和競爭格局。本報告評估了銀行業新興的詐欺因素,重點介紹了關鍵市場趨勢,並探討了反詐欺解決方案採用的區域機會。
此套件包含多個選項,每個選項均可單獨購買。這些選項包括:存取金融機構未來反詐騙解決方案支出的數據、揭示詐欺預防市場最新趨勢和機會的深入研究,以及對15家領先反詐騙解決方案提供者的詳細分析。此外,所有這些選項都可以作為完整的研究套件一起購買,並享受大幅折扣。
本報告是了解快速發展的詐欺情勢的重要資源,使利害關係人能夠制定有效的未來策略。其全面的見解和廣泛的覆蓋範圍使該研究套件成為在快速增長的市場環境中支持規劃和決策的極其有用的工具。
本報告提供全英文版本。
主要的特徵
- 市場動態:本報告深入分析了主要趨勢和市場擴張挑戰,包括詐欺驅動因素和金融機構面臨的主要挑戰。本報告分析了反詐欺解決方案在交易風險監控中的作用、機器學習在詐欺防制中的應用,以及影響詐欺防制格局的法規。此外,報告還提供了國家準備指數,評估了八個主要地區詐欺預防市場的當前發展階段和細分市場的成長情況,並提供了未來展望。
- 關鍵要點和策略建議:深入分析了詐欺預防解決方案市場中的關鍵成長機會和發現,並為利害關係人提供了策略建議。
- 基準產業預測:詐欺偵測與預防資料集包括詐欺交易總量預測、金融機構詐欺防制解決方案支出預測、各細分市場的交易量預測。
- Juniper Research 競爭排行榜:透過 Juniper Research 的競爭排行榜評估 15 家詐欺防制供應商的能力。
樣品view
市場資料·預測報告
樣品
市場趨勢·策略報告
市場資料&預測報告
此研究套件包含完整的預測資料集,包含 54 個表格和 24,600 個資料點。
- 詐欺交易總量及金額
- 銀行和金融機構在詐欺偵測和預防解決方案上的年度總支出(按細分):
- 銀行和信用合作社
- 金融科技
- 投資公司
- 放債人
Juniper Research 的互動式預測 (Excel) 包含以下功能:
- 統計分析: 能夠搜尋資料期間所有地區和國家/地區顯示的特定指標。圖表可以輕鬆修改並匯出到剪貼簿。
- 國家/地區資料工具: 此工具可讓您查看預測期間所有地區和國家的指標。您可以使用搜尋欄縮小顯示的指標範圍。
- 國家比較工具: 讓您選擇特定的國家進行比較。此工具具有匯出圖表的功能。
- 假設分析:五種互動式場景允許使用者比較預測假設。
競爭排行榜報告
|
|
目錄
市場趨勢·策略
第1章 市場摘要
- 重要點和策略性推薦事項
- 策略性建議
第2章 市場形勢
- 市場形勢和市場區隔
- 定義和範圍
- 詐騙的種類
- 主要欺詐
- 申請詐欺與虛假帳戶
- 錢錢騾
- 前置攻擊
- 潛伏欺詐
- APP 欺詐
- 社會工程欺詐
- 洗錢
- 退款欺詐
- ATO(授權交易)
- 合成身分詐欺
- 基於人工智慧的欺詐
- 內部威脅
- 主要欺詐
- 發卡機構端詐欺偵測與預防解決方案
- 詐欺偵測與預防系統
- 生物辨識身份驗證
- 權標化
- 行為分析
- 洗錢防制軟體
- 詐欺偵測與預防系統
- 課題
- 通貨膨脹和金融不穩定
- 技術進步
- 保護無銀行帳戶人群的緊迫性
- 快速演變的詐欺格局
- 網路安全人才短缺
第3章 部門分析:付款各類型
- 付款類型
- 開放銀行
- 延期付款服務
- CBDC
- 加密貨幣
- 即時支付
- 匯款
- QR編碼
- 解決方案和機會
- AI
- 機器學習
- API
- 耐量子密碼
- 規則
第5章 市場區隔分析:各產業
- 市場區隔分析
- 銀行和信用合作社
- 金融科技公司
- 放債人
- 投資公司
- 加值服務
- 發票融資
- 應付帳款和應收帳款自動化
- 貿易融資
- 現金流量預測與分析
- 對帳服務
競爭排行榜
第1章 競爭排行榜
- 為何閱讀本報告?
- 發行人詐欺防制供應商資料
- Accertify
- ACI Worldwide
- ComplyAdvantage
- Discover Financial Services
- Entrust
- Feedzai
- Fiserv
- Hawk
- LexisNexis Risk Solutions
- Mastercard
- SEON
- Thales
- Tookitaki
- TransUnion
- Visa
資料·預測
第1章 市場概要
- 定義和範圍
第2章 預測摘要
- 按發行商劃分的詐欺預防預測摘要
- 實施詐欺偵測和預防解決方案的銀行和其他金融機構數量
- 銀行和金融機構在詐欺偵測和預防解決方案上的年度總支出
- 數位銀行和匯款中的詐欺交易總數
- 銀行和匯款中的詐欺交易總價值
第三章:銀行和其他金融機構
- 使用詐欺偵測和預防解決方案的銀行和信用合作社數量
- 詐欺偵測與預防總支出解決方案
第四章 金融科技
- 實施詐欺偵測和預防解決方案的金融科技公司數量
- 詐欺偵測與預防解決方案的總支出
第五章:投資公司
- 實施詐欺偵測和預防解決方案的投資公司數量
- 詐欺偵測與預防解決方案的總支出
第六章:放債人
- 使用詐欺偵測和預防解決方案的放債人數量
- 詐欺偵測與預防解決方案的總支出
第七章:銀行與匯款中的詐欺交易
- 數位銀行的詐欺交易總數
- 詐欺交易總價值數位銀行
- 匯款詐欺交易總數
- 匯款詐欺交易總金額
'Fraud to Cost Financial Institutions $58.3 Billion by 2030 Globally, as Synthetic Identities Threaten Fraud Tidal Wave'
| KEY STATISTICS | |
|---|---|
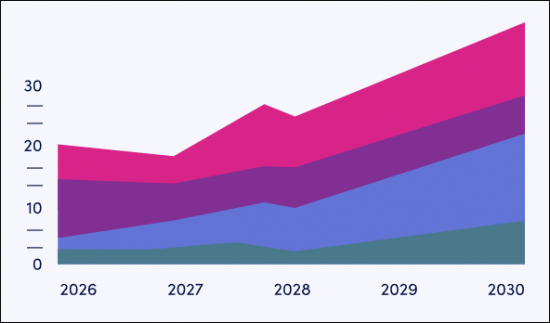
| Spend on fraud detection and prevention by financial institutions in 2025: | $21.1 billion |
| Spend on fraud detection and prevention by financial institutions by 2030: | $39.1 billion |
| 2025 to 2030 market growth: | 85.5% |
| Forecast period: | 2025-2030 |
Overview
Our 'Fraud Detection and Prevention in Banking' research suite provides a comprehensive and in-depth analysis of the types of fraud, and methods that can be used to overcome them. This enables stakeholders such as banks, financial institutions, and fintechs to understand future growth, key trends and the competitive environment. The report evaluates emerging elements of banking fraud, highlights key market trends, and examines regional opportunities in fraud solution adoption.
The suite includes several different options that can be purchased separately, including access to data mapping the future spend on fraud solutions by financial institutions, an insightful study uncovering the latest trends and opportunities within the fraud prevention market, and a document containing extensive analysis of the 15 market leaders facilitating fraud prevention solutions. The coverage can also be purchased as a Full Research Suite, containing all these elements, at a substantial discount.
This report serves as an essential resource for understanding the rapidly evolving fraud landscape; empowering stakeholders to shape effective future strategies. With its comprehensive insights and extensive coverage, this research suite is an invaluable tool for navigating and planning in a fast-growing landscape.
All report content is delivered in the English language.
Key Features
- Market Dynamics: Insights into key trends and market expansion challenges within the fraud prevention solutions market, including drivers of fraud and major challenges faced by financial institutions regarding fraud. The report addresses the role of fraud prevention solutions in monitoring transactions for risk, the use of machine learning in fraud prevention, and the regulations affecting the fraud prevention landscape. The research also features a Country Readiness Index on the current development and segment growth of the fraud prevention market across eight key regions, as well as providing a future outlook.
- Key Takeaways & Strategic Recommendations: In-depth analysis of key development opportunities and findings within the solutions for fraud prevention market, accompanied by strategic recommendations for stakeholders.
- Benchmark Industry Forecasts: The fraud detection and prevention dataset includes forecasts for the total value of fraudulent transactions, including the spend on fraud prevention solutions by financial institutions, and the transaction volume of various market segments.
- Juniper Research Competitor Leaderboard: Key market player capability and capacity assessment for 15 fraud prevention vendors, via the Juniper Research Competitor Leaderboard; featuring market size for major players in the fraud prevention market.
SAMPLE VIEW
Market Data & Forecasting Report
The numbers tell you what's happening, but our written report details why, alongside the methodologies.
SAMPLE VIEW
Market Trends & Strategies Report
A comprehensive analysis of the current market landscape, alongside strategic recommendations.
Market Data & Forecasting Report
The market-leading research suite for the 'Fraud Detection and Prevention in Banking' market includes access to the full set of forecast data of 54 tables and 24,600 datapoints.
Metrics in the research suite include:
- Total Transaction Volume and Value of Fraudulent Transactions
- Total Annual Spend on Fraud Detection and Prevention Solutions by Banks and Financial Institutions, Split by the Following Market Segments:
- Banks and Credit Unions
- Fintechs
- Investment Companies
- Lending Companies
Juniper Research's Interactive Forecast Excel contains the following functionality:
- Statistics Analysis: Users benefit from the ability to search for specific metrics, displayed for all regions and countries across the data period. Graphs are easily modified and can be exported to the clipboard.
- Country Data Tool: This tool lets users look at metrics for all regions and countries in the forecast period. Users can refine the metrics displayed via a search bar.
- Country Comparison Tool: Users can select and compare specific countries. The ability to export graphs is included in this tool.
- What-if Analysis: Here, users can compare forecast metrics against their own assumptions, via five interactive scenarios.
Market Trends & Strategies Report
This report examines the 'Fraud Detection and Prevention in Banking' market landscape in depth; assessing trends and factors shaping the evolution of this rapidly growing market. The report delivers comprehensive analysis of the strategic opportunities for vendors providing fraud prevention solutions; addressing key verticals such as banks, credit unions, fintechs, investment companies, and lenders. This report also includes evaluation of key country-level opportunities for stakeholders in the fraud prevention market.
Competitor Leaderboard Report
The Competitor Leaderboard report provides a detailed evaluation and market positioning for 15 leading vendors in the fraud prevention space. The vendors are positioned as established leaders, leading challengers, or disruptors and challengers, based on capacity and capability assessments:
|
|
This document is centred around the Juniper Research Competitor Leaderboard; a vendor positioning tool that provides an at-a-glance view of the competitive landscape in a market, backed by a robust methodology.
Table of Contents
Market Trends & Strategies
1. Market Summary
- 1.1. Key Takeaways & Strategic Recommendations
- 1.2. Strategic Recommendations
2. Market Landscape
- 2.1. Market Landscape & Segmentation
- 2.1.1. Introduction
- 2.1.2. Definitions and Scope
- 2.2. Types of Fraud
- Figure 2.1: Types of Fraud
- 2.2.1. First-party Fraud
- i. Application Fraud and Fake Accounts
- ii. Money Mules
- iii. Fronting
- iv. Sleeper Fraud
- v. APP Fraud
- vi. Social Engineering Fraud
- 2.2.2. Money Laundering
- 2.2.3. Chargeback Fraud
- 2.2.4. ATO
- 2.2.5. Synthetic Identity
- i. Detection of Synthetic Identity Fraud
- 2.2.6. AI-driven Fraud
- 2.2.7. Insider Threat
- 2.3. Solutions Used in Issuer Fraud Detection & Prevention
- 2.3.1. Fraud Detection & Prevention Systems
- i. Biometric Identification
- ii. Tokenisation
- iii. Behavioural Analytics
- iv. AML Software
- 2.3.1. Fraud Detection & Prevention Systems
- 2.4. Challenges
- 2.4.1. Introduction
- Figure 2.2: Major Challenges Faced by Financial Institutions in the Fraud Landscape
- 2.4.2. Inflation and Financial Uncertainty
- 2.4.3. Technological Advancement
- 2.4.4. Urgent Need to Protect the 'Underbanked'
- 2.4.5. Rapidly Evolving Fraud Landscape
- 2.4.6. Cyber Security Talent Shortage
- 2.4.1. Introduction
3. Sector Analysis: Payment Types
- 3.1. Payment Types
- 3.1.1. Open Banking
- i. Avenues of Fraud Through Open Banking
- ii. How Open Banking Can Help Prevent Banking Fraud
- 3.1.2. Buy Now, Pay Later
- 3.1.3. CBDCs
- 3.1.4. Cryptocurrency
- 3.1.5. Instant Payments
- 3.1.6. Money Transfer
- 3.1.7. QR Codes
- i. Avenues of Fraud Via QR Code Payments
- ii. How QR Code Payments Can Reduce Fraud
- 3.1.1. Open Banking
- 4.1. Solutions & Opportunities
- 4.1.1. AI
- i. Advantages of AI in Fraud Detection and Prevention
- ii. Disadvantages of AI in Fraud Detection and Prevention
- 4.1.2. Machine Learning
- i. Advantages of Machine Learning in Fraud Detection and Prevention
- ii. Disadvantages of ML in Fraud Detection and Prevention
- 4.1.3. APIs
- i. Advantages of APIs in Fraud Detection and Prevention
- ii. Disadvantages of APIs in Fraud Detection and Prevention
- 4.1.4. Quantum-safe Cryptography
- i. Advantages of Quantum-safe Cryptography in Fraud Detection and Prevention
- ii. Disadvantages of Quantum-safe Cryptography in Fraud Detection and Prevention
- 4.1.1. AI
- 4.2. Regulations
- 4.2.1. UK Faster Payments Regulation
- 4.2.2. PSD2
- 4.2.3. Brazil's PIX Instant Payment Regulation
- 4.2.4. India's UPI and Real-time Payment Regulation
5. Segment Analysis: Business Verticals
- 5.1. Segment Analysis
- 5.1.1. Introduction
- 5.1.2. Banks and Credit Unions
- 5.1.3. Fintechs
- 5.1.4. Lenders
- 5.1.5. Investment Companies
- 5.1.6. Value-added Services
- 5.1.7. Invoice Financing
- 5.1.8. Accounts Payable (AP) and Accounts Receivable (AR) Automation
- 5.1.9. Trade Financing
- 5.1.10. Cashflow Forecasting and Analytics
- 5.1.11. Reconciliation Services
Competitor Leaderboard
1. Competitor Leaderboard
- 1.1. Why Read This Report
- Figure 1.1: Juniper Research Competitor Leaderboard: Fraud Detection & Prevention in Banking Vendor Product Portfolio
- Figure 1.2: Juniper Research Leaderboard: Fraud Detection & Prevention in Banking Vendors
- Table 1.3: Juniper Research Leaderboard: Fraud Detection & Prevention in Banking Vendor Positioning
- Figure 1.4: Juniper Research Leaderboard Heatmap: Fraud Detection & Prevention in Banking Vendors
- 1.2. Issuer Fraud Prevention Vendor Profiles
- 1.2.1. Accertify
- i. Corporate Information
- ii. Geographical Spread
- iii. Key Clients & Strategic Partnerships
- iv. High-level View of Offerings
- v. Juniper Research's View: Key Strengths & Strategic Development Opportunities
- 1.2.2. ACI Worldwide
- i. Corporate Information
- ii. Geographical Spread
- iii. Key Clients & Strategic Partnerships
- iv. High-level View of Offerings
- v. Juniper Research's View: Key Strengths & Strategic Development Opportunities
- 1.2.3. ComplyAdvantage
- i. Corporate Information
- ii. Geographical Spread
- iii. Key Clients & Strategic Partnerships
- iv. High-level View of Offerings
- v. Juniper Research's View: Key Strengths & Strategic Development Opportunities
- 1.2.4. Discover Financial Services
- i. Corporate Information
- ii. Geographical Spread
- iii. Key Clients & Strategic Partnerships
- iv. High-level View of Offerings
- v. Juniper Research's View: Key Strengths & Strategic Development Opportunities
- 1.2.5. Entrust
- i. Corporate Information
- ii. Geographical Spread
- iii. Key Clients & Strategic Partnerships
- iv. High-level View of Offerings
- v. Juniper Research's View: Key Strengths & Strategic Development Opportunities
- 1.2.6. Feedzai
- i. Corporate Information
- ii. Geographical Spread
- iii. Key Clients & Strategic Partnerships
- iv. High-level View of Offerings
- v. Juniper Research's View: Key Strengths & Strategic Development Opportunities
- 1.2.7. Fiserv
- i. Corporate Information
- ii. Geographical Spread
- iii. Key Clients & Strategic Partnerships
- iv. High-level View of Offerings
- v. Juniper Research's View: Key Strengths & Strategic Development Opportunities
- 1.2.8. Hawk
- i. Corporate Information
- ii. Geographical Spread
- iii. Key Clients & Strategic Partnerships
- iv. High-level View of Offerings
- v. Juniper Research's View: Key Strengths & Strategic Development Opportunities
- 1.2.9. LexisNexis Risk Solutions
- i. Corporate Information
- ii. Geographical Spread
- iii. Key Clients & Strategic Partnerships
- iv. High-level View of Offerings
- v. Juniper Research's View: Key Strengths & Strategic Development Opportunities
- 1.2.10. Mastercard
- i. Corporate Information
- ii. Geographical Spread
- iii. Key Clients & Strategic Partnerships
- iv. High-level View of Offerings
- v. Juniper Research's View: Key Strengths & Strategic Development Opportunities
- 1.2.11. SEON
- i. Corporate Information
- ii. Geographical Spread
- iii. Key Clients & Strategic Partnerships
- iv. High-level View of Offerings
- v. Juniper Research's View: Key Strengths & Strategic Development Opportunities
- 1.2.12. Thales
- i. Corporate Information
- ii. Geographical Spread
- iii. Key Clients & Strategic Partnerships
- iv. High-level View of Offerings
- v. Juniper Research's View: Key Strengths & Strategic Development Opportunities
- 1.2.13. Tookitaki
- i. Corporate Information
- ii. Geographical Spread
- iii. Key Clients & Strategic Partnerships
- iv. High-level View of Offerings
- v. Juniper Research's View: Key Strengths & Strategic Development Opportunities
- 1.2.14. TransUnion
- i. Corporate Information
- ii. Geographical Spread
- iii. Key Clients & Strategic Partnerships
- iv. High-level View of Offerings
- v. Juniper Research's View: Key Strengths & Strategic Development Opportunities
- 1.2.15. Visa
- i. Corporate Information
- ii. Geographical Spread
- iii. Key Clients & Strategic Partnerships
- iv. High-level View of Offerings
- v. Juniper Research's View: Key Strengths & Strategic Development Opportunities
- 1.2.1. Accertify
Data & Forecasting
1. Market Overview
- 1.1. Introduction
- 1.2. Definitions and Scope
- 1.2.1. Forecast Introduction
- 1.2.2. Methodology & Assumptions
- i. Methodology
- ii. Assumptions
- Figure 1.1: Fraud Detection & Prevention in Banking Market 2025-2030: Forecast Methodology
2. Forecast Summary
- 2.1. Issuer Fraud Prevention Forecast Summary
- 2.1.1. Number of Banks and Other Financial Institutions Using Fraud Detection & Prevention Solutions
- Figure & Table 2.1: Number of Banks & FIs Using FDP Solutions, Split by 8 Key Regions, 2025-2030
- 2.1.2. Total Annual Spend on Fraud Detection & Prevention Solutions by Banks & FIs
- Figure & Table 2.2: Total Annual Spend on FDP Solutions by Banks & FIs ($m), Split by 8 Key Regions, 2025-2030
- 2.1.3. Total Number of Fraudulent Transactions across Digital Banking and Money Transfers
- Figure & Table 2.3: Total Number of Fraudulent Transactions across Digital Banking and Money Transfer (m), Split by 8 Key Regions, 2025-2030
- 2.1.4. Total Value of Fraudulent Transactions across Banking and Money Transfers
- Figure & Table 2.4: Total Value of Fraudulent Banking & Money Transfer Transactions ($m), Split by 8 Key Regions, 2025-2030
- 2.1.1. Number of Banks and Other Financial Institutions Using Fraud Detection & Prevention Solutions
3. Banks and Other Financial Institutions
- 3.1.1. Number of Banks and Credit Unions Using Fraud Detection & Prevention Solutions
- Figure & Table 3.1: Banks & Credit Unions Using FDP Solutions, Split by 8 Key Regions, 2025-2030
- 3.1.2. Total Spend by Banks & Credit Unions on Fraud Detection & Prevention Solutions
- Figure & Table 3.2: Total Spend by Banks & Credit Unions on FDP Solutions ($m), Split by 8 Key Regions, 2025-2030
4. Fintechs
- 4.1.1. Number of Fintechs Using Fraud Detection & Prevention Solutions
- Figure & Table 4.1: Number of Fintechs Using FDP Solutions, Split by 8 Key Regions, 2025-2030
- 4.1.2. Total Spend by Fintechs on Fraud Detection & Prevention Solutions
- Figure & Table 4.2: Total Spend by Fintechs on FDP Solutions ($m), Split by 8 Key Regions, 2025-2030
5. Investment Companies
- 5.1.1. Number of Investment Companies Using Fraud Detection & Prevention Solutions
- Figure & Table 5.1: Number of Investment Companies Using FDP Solutions, Split by 8 Key Regions, 2025-2030
- 5.1.2. Total Spend by Investment Companies on Fraud Detection & Prevention Solutions
- Figure & Table 5.2: Total FDP Spend by Investment Companies ($m), Split by 8 Key Regions, 2025-2030
6. Lenders
- 6.1.1. Number of Lenders Using Fraud Detection & Prevention Solutions
- Figure & Table 6.1: Number of Lenders Using FDP Solutions, Split by 8 Key Regions, 2025-2030
- 6.1.2. Total Spend by Lenders on Fraud Detection & Prevention Solutions
- Figure & Table 6.2: Total Spend by Lenders on FDP Solutions ($m), Split by 8 Key Regions, 2025-2030
7. Fraudulent Transactions in Banking and Money Transfers
- 7.1.1. Total Number of Fraudulent Transactions in Digital Banking
- Figure & Table 7.1: Total Number of Fraudulent Transactions in Digital Banking (m), Split by 8 Key Regions, 2025-2030
- 7.1.2. Total Value of Fraudulent Transactions in Digital Banking
- Figure & Table 7.2: Total Value of Fraudulent Transactions in Digital Banking ($m), Split by 8 Key Regions, 2025-2030
- 7.1.3. Total Number of Fraudulent Transactions in Money Transfer
- Figure & Table 7.3: Total Number of Fraudulent Transactions in Money Transfer (m), Split by 8 Key Regions, 2025-2030
- 7.1.4. Total Fraudulent Transactions Value in Money Transfer
- Figure & Table 7.4: Total Fraudulent Transactions Value ($m), Split by 8 Key Regions, 2025-2030
 詐欺偵測與預防市場:2026-2032年全球市場預測(依組件、技術、部署模式、組織規模及最終用途分類)
 詐欺偵測與預防(FDP):市佔率分析、產業趨勢與統計、成長預測(2026-2031 年)
 詐騙偵測與預防市場:市場規模、佔有率和趨勢分析(按組件、應用、公司規模、行業和地區分類),細分市場預測(2026-2033 年)
 2026-2030年全球詐騙偵測與預防市場
 2026年全球詐騙偵測與預防市場報告2026年全球智慧人工智慧(AI)詐騙偵測與預防市場報告
 客戶轉型過程中的詐欺偵測與預防:人為安全
 詐欺偵測與預防市場分析及預測(至 2035 年):按類型、產品類型、服務、技術、組件、應用、部署類型、最終用戶和解決方案分類詐欺偵測與預防市場規模、佔有率、成長率及全球產業分析:按類型、應用和地區分類的洞察,2026-2034 年預測
 詐騙偵測與預防市場 - 全球產業規模、佔有率、趨勢、機會及預測(按組件、解決方案、應用、產業垂直領域、地區和競爭格局分類,2021-2031年)