


 |
市場調查報告書
商品編碼
1730125
mPOS終端及軟體POS的全球市場:2025-2030年Global mPOS Terminals & Soft POS Market: 2025-2030 |
||||||
"到2030年,軟POS交易量將以2150%的成長率成長:重新定義小型企業的行動交易"
| 主要統計 | |
|---|---|
| 2030年的mPOS終端的整體交易額: | 49億美元 |
| 2030年的軟體POS終端的整體交易額: | 5,400億美元 |
| 從2025年開始2030年的軟體POS市場成長率: | 2,150% |
| 預測期間: | 2025-2030年 |
概述
我們的研究套件提供了詳細而深刻的分析mPOS 終端和軟 POS 市場,使 POS 硬體製造商、支付基礎設施提供商、軟體開發商、酒店和零售商等利益相關者能夠了解未來成長、關鍵趨勢和競爭格局。
我們的套件包含映射 POS 未來成長的數據、揭示市場最新趨勢和機會的直觀研究,以及對 mPOS 終端機和軟 POS 領域 27 家市場領導者進行深入分析的文檔。其無與倫比的全面性使我們的研究套件成為規劃如此高成長市場未來發展方向的極其有用的資源。
主要特點
- 市場動態:我們提供對市場格局的深入洞察,分析各種形式的 POS 及其具體用例。它還評估了軟 POS 對 mPOS 的威脅,以及智慧型 POS 系統內建的增強功能如何幫助緩解這一威脅。報告包含細分分析,分析了mPOS終端和軟POS在六個不同產業領域面臨的機會和課題。報告最後提供了一個國家就緒指數,用於識別mPOS和軟POS供應商的高成長市場和潛在區域。
- 關鍵要點和策略建議:詳細分析POS市場的關鍵發展機會和關鍵發現,並為利害關係人提供重要的策略建議。
- 基準產業預測:POS採用和使用情況的五年市場預測,包括六種不同類型POS(專用POS、非接觸式POS、mPOS、生物辨識POS、智慧型POS和軟POS)的安裝基數、交易量和交易額的細分。該預測還包括POS軟體系統的採用情況和收入。
- Juniper Research競爭力排行榜:對27家領先POS供應商的能力進行評估。
樣品view
市場資料&預測報告
樣品
市場趨勢·策略報告
市場數據與預測報告
我們市場領先的 POS 終端市場研究套件包含 101 個完整表格以及超過 46,000 個數據點的預測數據。此研究套件包含以下指標:
- POS 終端機組裝機量
- POS 交易筆數
- POS 交易總金額
這些指標涵蓋以下主要市場:
- 專用 POS
- 非接觸式 POS
- 行動 POS
- 生物辨識 POS
- 智慧型 POS
- 軟體 POS
Juniper Research 的互動式預測 (Excel) 包含以下功能:
- 統計分析:顯示資料期間所有地區和國家的數據,並允許您搜尋特定指標。圖表可以輕鬆修改並匯出到剪貼簿。
- 國家/地區資料工具:此工具可讓您查看預測期間內所有地區和國家的指標。您可以在搜尋欄中縮小顯示的指標範圍。
- 國家比較工具:您可以選擇要比較的國家。此工具包含匯出圖表的功能。
- 假設分析:五個互動式場景可讓您將預測指標與您自己的假設進行比較。
市場趨勢與策略報告
本報告深入研究了mPOS終端和軟POS市場的趨勢,並評估了影響這一快速成長市場發展的市場趨勢和因素。它全面分析了mPOS終端和軟POS供應商的策略機遇,重點介紹了關鍵的垂直產業和發展課題,以及利害關係人應如何應對這些課題。
目錄
市場趨勢與策略
第1章 重要點·策略性建議
- 重要點
- 策略性建議
第2章 市場摘要
- 簡介
- 定義和範圍
- 專用POS
- mPOS
- 非接觸POS
- 智慧POS
- 生物識別POS
- 臉掃描
- 指紋辨識
- 手掌認識
- 新的生物識別
- 虹膜
- 視網膜
- 靜脈模式認識
- 生物識別的課題
- 安全與隱私問題
- 實施課題
- 使用者體驗問題
- 營運與財務障礙
- 軟體POS
- 各種POS機用例
- 推動因素與阻礙因素
- 替代性無現金社會
- 生物辨識POS機市場
- 消費者購買行為的演變
- 增強功能
- 智慧型POS機:應對日益激烈的競爭的解決方案
- 軟體POS
- 簡介
- 市場版圖
- 專用POS機和行動POS機面臨的威脅
- 軟POS機面臨的課題
- 未來展望
第3章 市場區隔分析
- 市場區隔分析的形勢
- 飯店與餐飲
- 旅遊與交通
- 速食店
- 加油站與無人駕駛
- 小型企業與專業服務
- 活動與體育場館
第4章 各國準備指數與地區分析
- 各國準備指數
- 關注市場
- 成長市場
- 新興國家市場
- 飽和市場
競爭排行榜
第一章:Juniper Research POS 終端機競爭排行榜
第2章 mPOS:競爭排行榜
- mPOS業者簡介
- Epos Now
- Fiserv
- Global Payments
- Lightspeed
- Mswipe
- NEXGO
- Newland NPT
- PAX
- PayPal
- Posiflex
- Square (Block)
- SumUp
- Toast
- Verifone
- Worldline
- 評估手法
- 限制與解釋
第3章 軟體POS競爭的排行榜
- 軟體POS供應商的簡介
- alcineo
- Apple
- CM.com
- Fiserv
- MagicCube
- Mypinpad
- Paypal
- Payten
- Square
- Stripe
- Tidypay
- Wizzit
- Worldline
- Worldpay
- 調查手法
- 評估手法
- 限制與解釋
- 相關調查
資料與預測
第1章 市場預測
第2章 市場摘要
- POS終端市場
- 用戶數(裝置量)
- 交易數
- 交易額
第3章 非接觸POS
- 用戶數(裝置量)
- 交易數
- 交易額
第4章 mPOS
- 用戶數(裝置量)
- 交易額
第5章 軟體POS
- 用戶數(裝置量)
- 交易數
- 交易額
'Soft POS Transactions to Accelerate by 2,150% in Value by 2030; Redefining On-the-go Transactions for Small Businesses'
| KEY STATISTICS | |
|---|---|
| Total mPOS terminal transaction value in 2030: | $4.9tn |
| Total soft POS terminal transaction value in 2030: | $540 bn |
| 2025 to 2030 soft POS market growth: | 2150% |
| Forecast period: | 2025-2030 |
Overview
Our "mPOS Terminals & Soft POS" market research suite provides detailed and insightful analysis of this evolving market; enabling stakeholders, from POS hardware manufacturers, payment infrastructure providers, software developers, and hospitality and retail vendors, to understand future growth, key trends and the competitive environment.
The suite includes several different options that can be purchased separately, including access to data mapping the future growth of POS, an intuitive study uncovering the latest trends and opportunities within the market, and a document containing extensive analysis of the 27 market leaders within the mPOS terminals & soft POS space. The coverage can also be purchased as a Full Research Suite, containing all these elements, and including a substantial discount.
Collectively, they provide a critical tool for understanding this rapidly emerging market; allowing POS manufacturers and technology vendors to shape their future strategy. Its unparalleled coverage makes this research suite an incredibly useful resource for charting the future of such a high-growth market.
All report content is delivered in the English language.
Key Features
- Market Dynamics: Extensive insight into the market landscape; analysing the various forms of POS and their specific use cases. This section also assesses the threat that soft POS poses to mPOS, as well as how the enhanced features embedded within smart POS systems can help alleviate this threat. The report includes a segment analysis which looks at the opportunities and challenges faced by mPOS terminals and soft POS across six distinct industry segments. This document concludes with a Country Readiness Index, which identifies high-growth markets and potential regions for mPOS & soft POS vendors.
- Key Takeaways & Strategic Recommendations: In-depth analysis of key development opportunities and key findings within the POS market, accompanied by key strategic recommendations for stakeholders.
- Benchmark Industry Forecasts: 5-year market forecasts for POS adoption and use, including a breakdown of the installed base, transaction volume, and transaction value for the six different types of POS: dedicated POS, contactless POS, mPOS, biometric POS, smart POS and soft POS. The forecast also contains adoption and revenue for POS software systems.
- Juniper Research Competitor Leaderboard: Key player capability and capacity assessment for 27 POS vendors, via two Juniper Research Competitor Leaderboard; separating mPOS and soft POS.
SAMPLE VIEW
Market Data & Forecasting Report
The numbers tell you what's happening, but our written report details why, alongside the methodologies.
Pic.SAMPLE VIEW
Market Trends & Strategies Report
A comprehensive analysis of the current market landscape, alongside strategic recommendations.
Market Data & Forecasting Report
The market-leading research suite for the POS Terminals market includes access to the full set of forecast data of 101 tables and over 46,000 datapoints. Metrics in the research suite include:
- Total POS Terminals Installed Base
- Total POS Transaction Volume
- Total POS Transaction Value
These metrics are provided for the following key market verticals:
- Dedicated POS
- Contactless POS
- mPOS
- Biometric POS
- Smart POS
- Soft POS
Juniper Research Interactive Forecast Excel contains the following functionality:
- Statistics Analysis: Users benefit from the ability to search for specific metrics, displayed for all regions and countries across the data period. Graphs are easily modified and can be exported to the clipboard.
- Country Data Tool: This tool lets users look at metrics for all regions and countries in the forecast period. Users can refine the metrics displayed via a search bar.
- Country Comparison Tool: Users can select countries and compare countries. The ability to export graphs is included in this tool.
- What-if Analysis: Here, users can compare forecast metrics against their own assumptions, featuring 5 interactive scenarios.
Market Trends & Strategies Report
This report examines the "mPOS Terminals & Soft POS" market landscape in detail; assessing market trends and factors shaping the evolution of this rapidly growing market. The report delivers comprehensive analysis of the strategic opportunities for mPOS terminals & soft POS vendors; addressing key verticals and developing challenges, and how stakeholders should navigate these. It also includes evaluation of key country-level opportunities for POS vendors.
Competitor Leaderboard Report
The Competitor Leaderboard report provides a detailed evaluation and market positioning for 27 leading vendors in the "mPOS Terminals & Soft POS" space split into two Competitor Leaderboards, one for traditional and one for soft POS. The vendors are positioned either as an established leader, leading challenger, or disruptor and challenger, based on capacity and capability assessments.
Juniper Research Competitor Leaderboard for mPOS:
|
|
Juniper Research Competitor Leaderboard for soft POS:
|
|
This document is centred around the Juniper Research Competitor Leaderboard; a vendor positioning tool that provides an at-a-glance view of the competitive landscape in a market, backed by a robust methodology.
Table of Contents
Market Trends & Strategies
1. Key Takeaways & Strategic Recommendations
- 1.1. Key Takeaways
- 1.2. Strategic Recommendations
2. Market Summary
- 2.1. Introduction
- 2.1.1. Definitions and Scope
- Figure 2.1: Types of POS
- 2.1.2. Dedicated POS
- 2.1.3. mPOS
- 2.1.4. Contactless POS
- Figure 2.2: Different POS Technologies
- 2.1.5. Smart POS
- Figure 2.3: Smart POS
- 2.1.6. Biometric POS
- Figure 2.4: Biometric POS Scanning Capabilities
- i. Face Scanning
- ii. Fingerprint Recognition
- iii. Palm Recognition
- 2.1.7. Emerging Biometrics
- i. Iris
- ii. Retina
- iii. Vein Pattern Recognition
- 2.1.8. Biometrics Challenges
- i. Security and Privacy Concerns
- ii. Implementation Challenges
- iii. User Experience Issues
- iv. Operational and Financial Barriers
- 2.1.9. Soft POS
- Figure 2.5: How to Use Soft POS
- 2.1.1. Definitions and Scope
- 2.2. Use Cases for Various POS
- 2.2.1. Superstores and Large Retailers
- i. QR Codes
- 2.2.2. Small Sum Fixed Point Transaction Environments
- 2.2.3. Mobile Retail Environments
- 2.2.1. Superstores and Large Retailers
- 2.3. Drivers and Constraints
- 2.3.1. Alternative Cashless Society
- 2.3.2. Biometric POS Markets
- 2.3.3. Evolving Consumer Shopping Behaviour
- 2.3.4. Enhanced Features
- 2.3.5. Smart POS: The Solution to Increasing Competition
- Figure 2.6: Smart POS Business Integrations
- i. Inventory Management
- ii. CRM and Loyalty Programmes
- iii. eCommerce Integration
- iv. Employee Management
- v. Data and Analytics
- vi. Integrated Payment Processing
- 2.4. Soft POS
- i. Introduction
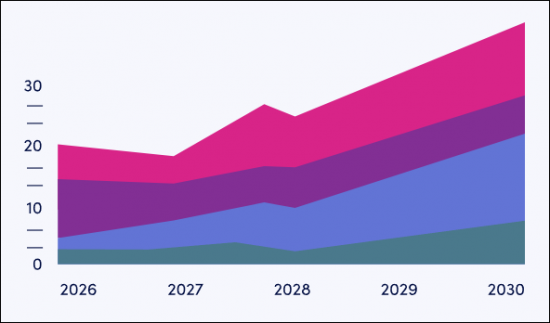
- Figure 2.7: Global Soft POS Transaction Volume ($m), Split by 8 Key Regions, 2025-2030
- 2.4.2. Market Landscape
- 2.4.3. Threat to Dedicated POS and Mobile POS
- 2.4.4. Challenges Facing Soft POS
- 2.4.5. Future Outlook
- i. Introduction
3. Segment Analysis
- 3.1. Segment Analysis Landscape
- Figure 3.1: POS Terminals' Key Leading and High-potential Industry Segments
- 3.1.1. Hospitality & Dining
- i. Opportunities
- ii. Challenges
- 3.1.2. Travel & Transportation
- i. Opportunities
- ii. Challenges
- 3.1.3. Quick-service Restaurants
- i. Opportunities
- ii. Challenges
- 3.1.4. Fuel & Unattended
- i. Opportunities
- ii. Challenges
- 3.1.5. SMEs & Professional Services
- i. Opportunities
- ii. Challenges
- 3.1.6. Events & Stadiums
- i. Opportunities
- ii. Challenges
4. Country Readiness Index & Regional Analysis
- 4.1.1. Country Readiness Index
- Figure 4.1: Juniper Research's 8 Key Regions
- Table 4.2: Juniper Research mPOS Terminals & Soft POS Market Country Readiness Index: Scoring Criteria
- Figure 4.3: Juniper Research mPOS Terminals & Soft POS Market Country Readiness Index
- Figure 4.4: Juniper Research mPOS Terminals & Soft POS Country Readiness Index: Market Segments
- 4.1.2. Focus Markets
- i. eCommerce and Omnichannel Retail Expansion
- ii. Regulatory Support and Fintech Innovation
- Figure 4.5: Total Transaction Value of Soft POS Systems ($m), Focus Markets, 2025-2030
- 4.1.3. Growth Markets
- Figure 4.6: Total mPOS Transactions per annum ($m), Growth Markets, 2025-2030
- i. Contactless Payment Surge
- ii. Government Initiatives
- 4.1.4. Developing Markets
- i. Mobile-first Solutions for Informal Economies
- ii. Cost-efficiency and Flexibility for Merchants
- Figure 4.7: Total mPOS Transactions per annum ($m), Developing Markets, 2025-2030
- 4.1.5. Saturated Markets
- Figure 4.8: Total mPOS Transaction Value per annum ($m), Saturated Markets, 2025-2030
- i. Hardware Dependency
- ii. Security and Certification Hurdles
- Figure 4.9: Juniper Research mPOS Terminals & Soft POS Market Country
- Readiness Index Heatmap: North America
- Figure 4.10: Juniper Research mPOS Terminals & Soft POS Market Country
- Readiness Index Heatmap: Latin America
- Figure 4.11: Juniper Research mPOS Terminals & Soft POS Market Country
- Readiness Index Heatmap: West Europe
- Figure 4.12: Juniper Research mPOS Terminals & Soft POS Market Country
- Readiness Index Heatmap: Central & East Europe
- Figure 4.13: Juniper Research mPOS Terminals & Soft POS Market Country
- Readiness Index Heatmap: Far East & China
- Figure 4.14: Juniper Research mPOS Terminals & Soft POS Market Country
- Readiness Index Heatmap: Indian Subcontinent
- Figure 4.15: Juniper Research mPOS Terminals & Soft POS Market Country
- Readiness Index Heatmap: Rest of Asia Pacific
- Figure 4.16: Juniper Research mPOS Terminals & Soft POS Market Country
- Readiness Index Heatmap: Africa & Middle East
Competitor Leaderboard
1. Juniper Research POS Terminals Competitor Leaderboards
- 1.1. Why Read This Report
- 1.2. Key mPOS & Soft POS Market Takeaways
2. mPOS Competitor Leaderboard
- Figure 2.1: Juniper Research Competitor Leaderboard mPOS Vendors Included & Product Portfolio
- Figure 2.2: Juniper Research Competitor Leaderboard for mPOS Terminals Vendors
- Table 2.3: Juniper Research Competitor Leaderboard: mPOS Terminals Vendors & Positioning
- Table 2.4: Juniper Research Competitor Leaderboard for mPOS Terminals: Heatmap
- 2.1. mPOS Vendor Profiles
- 2.1.1. Epos Now
- i. Corporate
- ii. Geographical Spread
- iii. Key Clients and Strategic Developments
- iv. High-level View of Offerings
- v. Juniper Research's View: Key Strengths & Strategic Development Opportunities
- 2.1.2. Fiserv
- i. Corporate
- Figure 2.5: Fiserv's Financial Snapshot ($m), 2022-2024
- ii. Geographical Spread
- iii. Key Clients & Strategic Partnerships
- iv. High-level View of Offerings
- v. Juniper Research's View: Key Strengths & Strategic Development Opportunities
- i. Corporate
- 2.1.3. Global Payments
- i. Corporate
- Figure 2.6: Global Payments' Financial Snapshot ($m), 2022-2024
- ii. Geographical Spread
- iii. Key Clients & Strategic Partnerships
- iv. High-level View of Offerings
- v. Juniper Research's View: Key Strengths & Strategic Development Opportunities
- i. Corporate
- 2.1.4. Lightspeed
- i. Corporate
- Figure 2.7: Lightspeed Financial Snapshot ($m), 2022-2024
- ii. Geographical Spread
- iii. Key Clients & Strategic Partnerships
- iv. High-level View of Offerings
- v. Juniper Research's View: Key Strengths & Strategic Development Opportunities
- i. Corporate
- 2.1.5. Mswipe
- i. Corporate
- ii. Geographical Reach
- iii. Key Clients & Strategic Partnerships
- iv. High-level View of Offerings
- v. Juniper Research's View: Key Strengths & Strategic Development Opportunities
- 2.1.6. NEXGO
- i. Corporate
- ii. Geographical Reach
- iii. Key Clients & Strategic Partnerships
- iv. High-level View of Offerings
- v. Juniper Research's View: Key Strengths & Strategic Development Opportunities
- 2.1.7. Newland NPT
- i. Corporate
- ii. Geographical Spread
- iii. Key Clients & Strategic Partnerships
- iv. High-level View of Offerings
- v. Juniper Research's View: Key Strengths & Strategic Development Opportunities
- 2.1.8. PAX
- i. Corporate
- Table 2.8: PAX's Financial Snapshot ($m), 2022-2024
- ii. Geographical Reach
- iii. Key Clients & Strategic Partnerships
- iv. High-level View of Offerings
- v. Juniper Research's View: Key Strengths & Strategic Development Opportunities
- i. Corporate
- 2.1.9. PayPal
- i. Corporate
- Table 2.9: Notable PayPal Acquisitions Summary ($m)
- ii. Geographical Spread
- iii. Key Clients & Strategic Partnerships
- iv. High-level View of Offerings
- v. Juniper Research's View: Key Strengths & Strategic Development Opportunities
- i. Corporate
- 2.1.10. Posiflex
- i. Corporate
- Figure 2.10: Posiflex's Financial Snapshot ($m), 2021-2023, Converted from TWD
- ii. Geographical Spread
- iii. Key Clients & Strategic Partnerships
- iv. High-level View of Offerings
- v. Juniper Research's View: Key Strengths & Strategic Development Opportunities
- i. Corporate
- 2.1.11. Square (Block)
- i. Corporate
- ii. Geographical Reach
- iii. Key Clients & Strategic Partnerships
- iv. High-level View of Offerings
- v. Juniper Research's View: Key Strengths & Strategic Development Opportunities
- 2.1.12. SumUp
- i. Corporate
- ii. Geographical Spread
- iii. Key Clients & Strategic Partnerships
- iv. High-level View of Offerings
- v. Juniper Research's View: Key Strengths & Strategic Development Opportunities
- 2.1.13. Toast
- i. Corporate
- Table 2.11: Toast's Investment Rounds ($m), 2015-2020
- ii. Geographical Reach
- iii. Key Clients & Strategic Partnerships
- iv. High-level View of Offerings
- v. Juniper Research's View: Key Strengths & Strategic Development Opportunities
- i. Corporate
- 2.1.14. Verifone
- i. Corporate
- ii. Geographical Spread
- iii. Key Clients & Strategic Partnerships
- iv. High-level View of Offerings
- v. Juniper Research's View: Key Strengths & Strategic Development Opportunities
- 2.1.15. Worldline
- i. Corporate
- ii. Geographical Reach
- iii. Key Clients & Strategic Partnerships
- iv. High-level View of Offerings
- v. Juniper Research's View: Key Strengths and Strategic Development Opportunities
- 2.1.1. Epos Now
- 2.2. Juniper Research Competitor Leaderboard Assessment Methodology
- 2.3. Limitations & Interpretation
- Figure 2.12: Juniper Research mPOS Competitor Leaderboard
3. Soft POS Competitor Leaderboard
- Figure 3.1: Juniper Research Competitor Leaderboard Soft POS Vendors Included & Product Portfolio
- Figure 3.2: Juniper Research Competitor Leaderboard for Soft POS Vendors
- Table 3.3: Juniper Research Competitor Leaderboard: Soft POS Vendors & Positioning
- Table 3.4: Juniper Research Competitor Leaderboard for Soft POS: Heatmap
- 3.1. Soft POS Vendor Profiles
- 3.1.1. alcineo
- i. Corporate
- ii. Geographical Spread
- iii. Key Clients & Strategic Partnerships
- iv. High-level View of Offerings
- Figure 3.5: alcineo Technology Architecture
- v. Juniper Research's View: Key Strengths & Strategic Development Opportunities
- 3.1.2. Apple
- i. Corporate
- Table 3.6: Apple's Financial Snapshot, $m, FY 2022-2024
- ii. Geographical Spread
- iii. Key Clients & Strategic Partnerships
- iv. High-level View of Offerings
- v. Juniper Research's View: Key Strengths & Strategic Development Opportunities
- i. Corporate
- 3.1.3. CM.com
- i. Corporate
- Figure 3.7: CM.com Financial Snapshot ($m), 2022-2024 (Converted from Euro-1 @1.10)
- ii. Geographical Spread
- iii. Key Clients & Strategic Developments
- iv. High-level View of Offering
- v. Juniper Research's View: Key Strengths & Strategic Development
- i. Corporate
- 3.1.4. Fiserv
- i. Corporate
- Figure 3.8: Fiserv Financial Snapshot ($m), 2022-2024
- ii. Geographical Spread
- iii. Key Clients & Strategic Partnerships
- iv. High-Level View of Offerings
- v. Juniper Research's View: Key Strengths & Strategic Development
- i. Corporate
- 3.1.5. MagicCube
- i. Corporate
- Table 3.9: MagicCube Investment Rounds ($m), 2015-2021
- ii. Geographical Reach
- iii. Key Clients & Strategic Developments
- iv. High-level View of Offering
- v. Juniper Research's View: Key Strengths & Strategic Development
- i. Corporate
- 3.1.6. Mypinpad
- i. Corporate
- ii. Geographical Reach
- iii. Key Clients & Strategic Developments
- iv. High-level View of Offering
- v. Juniper Research's View: Key Strengths & Strategic Development
- 3.1.7. Paypal
- i. Corporate
- Table 3.10: Notable PayPal Acquisitions Summary ($m)
- ii. Geographical Spread
- iii. Key Clients & Strategic Partnerships
- iv. High-level View of Offerings
- v. Juniper Research's View: Key Strengths & Strategic Development Opportunities
- i. Corporate
- 3.1.8. Payten
- i. Corporate
- ii. Geographical Reach
- iii. Key Clients & Strategic Developments
- iv. High-level View of Offering
- v. Juniper Research's View: Key Strengths and Strategic Development
- 3.1.9. Square
- i. Corporate
- ii. Geographical Reach
- iii. Key Clients & Strategic Developments
- iv. High-level View of Offering
- v. Juniper Research's View: Key Strengths and Strategic Development
- 3.1.10. Stripe
- i. Corporate
- ii. Geographic Spread
- iii. Key Clients & Strategic Partnerships
- iv. High-level View of Offerings
- v. Juniper Research's View: Key Strengths and Strategic Development
- 3.1.11. Tidypay
- i. Corporate
- ii. Geographical Spread
- iii. Key Clients & Strategic Partnerships
- iv. High-Level View of Offerings
- v. Juniper Research's View: Key Strengths & Strategic Development Opportunities
- Figure 3.11: Viva.com Soft POS Terminal App Overview
- v. Juniper Research's View: Key Strengths & Strategic Development Opportunities
- 3.1.13. Wizzit
- i. Corporate
- ii. Geographical Spread
- iii. Key Clients & Strategic Partnerships
- iv. High-Level View of Offerings
- v. Juniper Research's View: Key Strengths & Strategic Development Opportunities
- 3.1.14. Worldline
- i. Corporate
- ii. Geographical Reach
- iii. Key Clients & Strategic Developments
- iv. High-level View of Offering
- v. Juniper Research's View: Key Strengths & Strategic Development Opportunities
- 3.1.15. Worldpay
- i. Corporate
- ii. Geographical Spread
- iii. Key Clients & Strategic Partnerships
- iv. High-Level View of Offerings
- v. Juniper Research's View: Key Strengths & Strategic Development Opportunities
- 3.1.1. alcineo
- 3.2. Methodology
- Table 3.12: Juniper Research Competitor Leaderboard Soft POS Methodology
- 3.3. Juniper Research Competitor Leaderboard Assessment Methodology
- 3.4. Limitations & Interpretation
- 3.5. Related Research
- Endnotes
Data & Forecasting
1. Market Forecasts
- 1.1. Introduction
- 1.2. Methodology & Assumptions
- Figure 1.1: POS Terminal Market Forecast Methodology
2. Market Summary
- 2.1. POS Terminals Market
- 2.1.1. POS Terminals Installed Base
- Figure & Table 2.1: Global POS Installed Base (m), Split by 8 Key Regions, 2025-2030
- Figure 2.2: North America - Proportion of mPOS in Use That Are Smart POS (%), 2025-2030
- 2.1.2. Total POS Transaction Volume
- Figure & Table 2.3: Global POS Transaction Volume (m), 2025-2030
- 2.1.3. Total POS Transaction Value
- Figure & Table 2.4: Global POS Transaction Value ($m), Split by 8 Key Regions, 2025-2030
- 2.1.1. POS Terminals Installed Base
3. Contactless POS
- 3.1.1. Contactless Terminals Installed Base
- Figure & Table 3.1: Global Contactless POS Installed Base (m), Split by 8 Key Regions, 2025-2030
- Table 3.2: Global Percentage of Dedicated POS That Are Contactless Enabled (%), 2025-2030
- 3.1.2. Contactless POS Transaction Volume
- Figure & Table 3.3: Global Contactless POS Transaction Volume (m), Split by 8 Key Regions, 2025-2030
- 3.1.3. Contactless POS Transaction Value
- Figure & Table 3.4: Global Contactless POS Transaction Value ($m), Split by 8 Key Regions, 2025-2030
4. mPOS
- 4.1.1. mPOS Installed Base
- Figure & Table 4.1: mPOS Installed Base (m), Split by 8 Key Regions, 2025-2030
- 4.1.2. mPOS Transaction Value
- Figure & Table 4.2: Global mPOS Transaction Value ($m), Split by 8 Key Regions, 2025-2030
5. Soft POS
- 5.1.1. Soft POS Installed Base
- Figure & Table 5.1: Number of Smartphones Using Soft POS (m), Split by 8 Key Regions, 2025-2030
- 5.1.2. Soft POS Transaction Volume
- Figure & Table 5.2: Global Soft POS Transaction Volume (m), Split by 8 Key Regions, 2025-2030
- 5.1.3. Soft POS Transaction Value
- Figure & Table 5.3: Global Soft POS Transaction Value ($m), Split by 8 Key Regions, 2025-2030
 行動POS終端市場規模、佔有率和成長分析:按組件、部署模式、作業系統、連接方式、企業規模、最終用戶和地區分類-產業預測,2026-2033年
 行動POS終端市場規模、佔有率和趨勢分析報告:按組件、類型、應用、地區和細分市場預測(2026-2033年)
 2026-2030年全球行動POS終端市場
 mPOS終端市場:按組件、外形規格、支付方式、連接方式、運行環境、應用案例、最終用戶行業和配銷通路分類——2026-2032年全球市場預測
 行動POS終端市場分析及預測(至2035年):類型、產品類型、服務、技術、組件、應用、部署模式、最終用戶、功能
 2026年全球行動POS終端市場報告
 行動POS終端市場-全球產業規模、佔有率、趨勢、機會、預測:按組件、類型、應用、地區和競爭格局分類,2021-2031年
 MPOS 終端市場規模、佔有率及成長分析(按組件、解決方案、部署、應用和地區)-2025 年至 2032 年產業預測
 全球mPOS設備市場:實績與預測(2020-2031年)
 mPOS 終端市場規模 - 按組件、按產品、按應用、按部署模型、按技術和預測,2024 年至 2032 年