


 |
市場調查報告書
商品編碼
1719509
智慧交通管理的全球市場:2025-2030年Global Smart Traffic Management Market: 2025-2030 |
||||||
受永續發展和都市化驅動,到 2027 年,智慧交通管理市場規模將達到 200 億美元
| 主要統計 | |
|---|---|
| 2025年的總收益 | 148億美元 |
| 2030年的總收益 | 327億美元 |
| 從2025年~2030年的市場成長率 | 121% |
| 預測期間 | 2025-2030年 |
我們的研究套件對不斷發展的智慧交通管理市場提供了詳細而深刻的分析,幫助所有利害關係人(從智慧交通管理提供者到監管機構和技術供應商)了解未來成長、關鍵趨勢和競爭格局。該研究包含一項貨幣化模型分析,評估領先的部署模式,並為私人網路供應商和營運商提供策略建議,以實現收入最大化。此外,研究還包含瞻博網路研究公司的未來領導者指數,該指數檢視了挑戰主導營運商的新興智慧交通供應商。
研究套件包含多個可單獨購買的選項,包括存取未來五年智慧交通管理市場採用情況和未來成長情況的數據,並按智慧交通技術劃分:
|
|
|
該報告還提供了富有洞察力的研究,重點介紹了智慧交通領域的最新趨勢和機會。交通管理市場,包括人工智慧和自動化在智慧交通管理解決方案中的應用,以及日益普及的車聯網 (V2X) 技術。該技術將車輛與其周圍環境連接起來,實現即時交通管理。該報告還對智慧交通管理領域的 15 家市場領導者進行了深入分析。
主要特點
- 關鍵要點和策略建議:詳細分析了智慧交通管理供應商、技術供應商和監管機構的關鍵發展機會、關鍵進展和關鍵策略建議。
- 市場展望:深入分析了智慧交通管理市場的關鍵推動因素和挑戰,重點介紹了整合複雜性和預算限制帶來的挑戰以及如何克服這些挑戰。該報告還分析了智慧交通管理技術的當前和未來趨勢,並為智慧交通管理供應商、技術公司和監管機構提供了克服當前市場挑戰的策略建議。它還重點介紹了智慧交通管理技術的關鍵獲利機會,例如數據獲利。
- 基準產業預測:提供智慧交通管理市場的規模和預測,包括總收入、已部署的智慧交通管理系統總數以及已部署的智慧交通管理感測器總數。該預測進一步按三個技術領域細分了總收入和智慧交通管理系統的部署:智慧交叉路口、智慧停車和智慧高速公路。
- Juniper Research 競賽排行榜:包括對 15 家領先智慧交通管理供應商的能力評估以及主要參與者的市場規模。
樣品
市場趨勢·策略PDF報告
樣品view
市場資料·預測
市場數據與預測
研究套件包含 82 個表格和超過 37,000 個資料點的全套預測資料。此研究套件包含以下指標:
- 已部署智慧交通管理系統
- 已部署智慧交通管理感測器
- 智慧交通管理效益
- 智慧交通管理系統帶來的擁擠和排放成本節省規模
這些指標涵蓋以下關鍵技術:
- 智慧高速公路
- 智慧交叉路口
- 智慧停車
此預測進一步將總體擁塞和排放成本節省細分為:
- 壅塞管理
- 減排
Juniper Research 的互動式預測(Excel)包含以下功能:
- 統計分析:您可以搜尋資料期間所有地區和國家/地區顯示的特定指標。圖表可以輕鬆修改並匯出到剪貼簿。
- 國家/地區資料工具:您可以查看預測期間內所有地區和國家的指標。搜尋列可縮小顯示指標的範圍。
- 國家比較工具:您可以選擇特定的國家進行比較。該工具支援導出圖表。
- 假設分析:透過五個互動式場景,使用者可以將結果與預測假設進行比較。
目錄
市場趨勢與策略
第1章 重要點和策略性建議
- 重要點
- 策略性建議
第2章 未來市場展望,促進因素,課題
- 未來市場預測
- 促進因素
- 課題
- 趨勢
- 技術分析
第3章 經營模式分析
- 經營模式分析
- 部署模型
- 內部部署
- 雲端基礎
- 邊緣基礎
- haiburi
- 模組型
- 摘要
- 部署模型
第4章 futurereaders(leaders)目錄
- 業者簡介
- AISP
- Asura Technologies
- Autilent
- Flow Labs
- GridMatrix
- NoTraffic
- Pushpak AI
- Simplifai Systems
- 評估手法
- 限制與解釋
競爭排行榜
第1章 Juniper Research的競爭排行榜
第2章 企業簡介
- 業者簡介
- AtkinsRealis
- Cubic Corporation
- Huawei Technologies
- IBM
- Indra Group
- INRIX
- Iteris
- Kapsch TrafficCom
- Miovision
- Q-Free
- Thales
- TomTom
- TransCore
- Transoft Solutions
- Umovity
- 評估手法
- 相關調查
資料·預測
第1章 簡介·調查手法
第2章 市場概要
- 智慧交通管理系統的整體引進數
- 智慧交通管理的總支出額
第3章 智慧交叉路口
- 整體引進數
- 總支出額
第4章 智慧停車
- 整體引進數
- 總支出額
第5章 智慧高速公路
- 整體引進數
- 總支出額
第6章 混亂管理
- 智慧交通管理系統節省擁擠管理成本
第7章 排放削減
- 智慧交通管理系統節省排放成本
'Smart Traffic Management Market Growth Fuelled by Sustainability & Urbanisation, Reaching $20 Billion by 2027'
| KEY STATISTICS | |
|---|---|
| Total revenue in 2025: | $14.8bn |
| Total revenue in 2030: | $32.7bn |
| 2025 to 2030 market growth: | 121% |
| Forecast period: | 2025-2030 |
Overview
Juniper Research's "Smart Traffic Management" research suite provides a detailed and insightful analysis of this progressing market; enabling stakeholders, from smart traffic management providers to regulators and technology vendors, to understand future growth, key trends and the competitive environment. The market-leading study includes monetisation model analysis that evaluates the key deployment models in the market; providing strategic recommendations for private network vendors and operators to maximise revenue. Additionally, it features Juniper Research's Future Leaders Index, which examines emerging smart traffic vendors who are challenging dominant players in the market. The coverage can also be purchased as a full research suite, containing all these elements and a substantial discount.
The research suite includes several different options that can be purchased separately, including access to data mapping the adoption and future growth of the smart traffic management market over the next five years, split by the following smart traffic technologies:
|
|
|
It also provides an insightful study uncovering the latest trends and opportunities within the smart traffic management market, including the use of AI and automation in smart traffic management solutions and the rising adoption of vehicle-to-everything (V2X) technologies that enable real-time traffic management by connecting vehicles to their surrounding environment. It also features an extensive analysis of the 15 market leaders in the smart traffic management space.
Collectively, these documents provide a critical tool for understanding this fast-evolving market. They allow smart traffic management vendors and operators to shape their future strategy and capitalise on future growth opportunities in digitally transforming regions. This research suite's extensive coverage makes it a valuable tool for navigating this rapidly growing market.
All report content is delivered in the English language.
Key Features
- Key Takeaways & Strategic Recommendations: In-depth analysis of key development opportunities, key findings and key strategic recommendations for smart traffic management vendors, technology vendors and regulators.
- Market Outlook: Insights into key drivers and market challenges within the smart traffic management market, addressing challenges posed by integration complexity and budget constraints and how these can be overcome. It also provides an analysis into the current and future trends in smart traffic management technology, providing strategic recommendations for smart traffic management vendors, technology companies and regulators, to overcome the current market challenges. It highlights the key monetisation opportunities for smart traffic management technologies, including data monetisation.
- Benchmark Industry Forecasts: The market size and forecast for the smart traffic management market, including total revenue, total smart traffic management systems deployed, and total number of deployed smart traffic management sensors. The forecast further breaks down total revenue and smart traffic management systems deployed by the three technology segments (smart intersections, smart parking and smart highways).
- Juniper Research Competitor Leaderboard: Key player capability and capacity assessment for 15 smart traffic management vendors via the Juniper Research Competitor Leaderboard; featuring smart traffic management market size for major players in the smart traffic management industry.
SAMPLE VIEW
Market Trends & Strategies PDF Report
A comprehensive analysis of the current market landscape, alongside strategic recommendations and a walk-through of the forecasts.
SAMPLE VIEW
Market Data & Forecasting
The numbers tell you what's happening, but our written report details why, alongside the methodologies.
Market Trends & Strategies
This report provides a detailed outlook for the market, assessing market trends and the factors shaping the evolution of this growing market. Technological developments, particularly in AI, have led to real-time traffic monitoring capabilities, enhancing traffic flows, increasing road safety, and reducing congestion and emissions from vehicles. It also evaluates challenges posed by older infrastructure and existing systems which have hindered modern solutions adoption, given the cost of enabling these to integrate with existing systems.
This report delivers an insightful analysis of the strategic opportunities for smart traffic management vendors and operators, as well as strategic recommendations to overcome emerging market challenges such as interoperability. It also includes an evaluation of key technology segment opportunities for smart traffic management vendors and operators, highlighting key markets with the highest growth potential.
Market Data & Forecasting
The market-leading research suite for the "Smart Traffic Management" market includes access to the full set of forecast data of 82 tables and over 37,000 datapoints. Metrics in the research suite include:
- Deployed Smart Traffic Management Systems
- Deployed Smart Traffic Management Sensors
- Smart Traffic Management Revenue
- Congestion & Emissions Cost Savings by Smart Traffic Management Systems
These metrics are provided for the following key technologies:
- Smart Highways
- Smart Intersections
- Smart Parking
The forecast further splits the total congestion and emissions cost savings by the following:
- Congestion Management
- Emissions Reduction
Juniper Research Interactive Forecast Excel contains the following functionality:
- Statistics Analysis: Users benefit from the ability to search for specific metrics, displayed for all regions and countries across the data period. Graphs are easily modified and can be exported to the clipboard.
- Country Data Tool: This tool lets users look at metrics for all regions and countries in the forecast period. Users can refine the metrics displayed via a search bar.
- Country Comparison Tool: Users can select and compare specific countries. The ability to export graphs is included in this tool.
- What-if Analysis: Here, users can compare forecast metrics against their own assumptions, via five interactive scenarios.
Competitor Leaderboard Report
The Competitor Leaderboard report provides a detailed evaluation and market positioning for 15 leading vendors in the smart traffic management space. The vendors are positioned as an established leader, leading challenger, or disruptor and challenger based on capacity and capability assessments:
|
|
This document is centred around the Juniper Research Competitor Leaderboard, a vendor positioning tool that provides an at-a-glance view of the competitive landscape in a market, backed by a robust methodology.
Table of Contents
Market Trends & Strategies
1. Key Takeaways and Strategic Recommendations
- 1.1. Key Takeaways
- 1.2. Strategic Recommendations
2. Future Market Outlook, Drivers and Challenges
- 2.1. Future Market Outlook
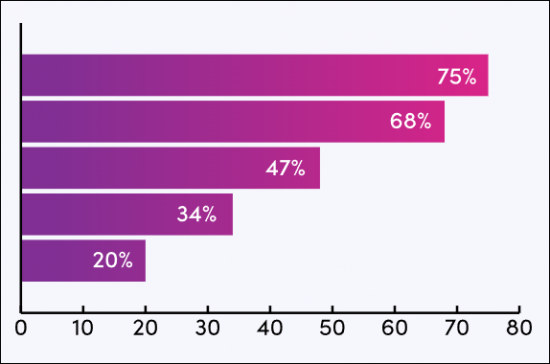
- Figure 2.1: Key Benefits of Smart Traffic Technology
- 2.1.1. Drivers
- i. Urbanisation and Population Growth
- ii. Technological Advancements
- iii. Government Investment
- iv. Environmental and Regulatory Pressures
- Figure 2.2: Total City Vehicle Emissions Cost Savings ($m), Split by 4 Key Countries, 2025-2030
- 2.1.2. Challenges
- i. Budget Constraints
- ii. Interoperability
- iii. Data Privacy and Cybersecurity Concerns
- 2.1.3. Trends
- i. Vehicle-to-Everything Communication
- Figure 2.3: Types of V2X
- ii. Multimodal Traffic Ecosystems
- iii. Connectivity
- i. Vehicle-to-Everything Communication
- 2.1.4. Technology Analysis
- i. Smart Intersections
- Figure 2.4: Total Number of Smart Intersections, Split by 8 Key Regions, 2025-2030
- Figure 2.5: Total Smart Intersection Spend ($m), Split by 5 Key Countries, 2025-2030
- ii. Smart Highways
- Figure 2.6: Total Length of Highways Converted to Smart Highways (km), Split by 8 Key Regions, 2025-2030
- iii. Smart Parking
- Figure 2.7: Total Smart Parking Spend ($m), Split by 8 Key Regions, 2025-2030
- iv. Summary
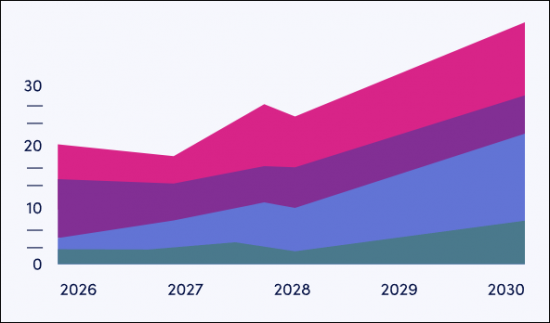
- Figure 2.8: Total Smart Traffic Management Spend ($m), Split by Sector, 2025-2030
- i. Smart Intersections
3. Business Model Analysis
- 3.1. Business Model Analysis
- 3.1.1. Deployment Models
- i. On-premises Deployment
- Table 3.1: Mitigation Strategies for On-premises Deployments
- ii. Cloud-based Deployment
- iii. Edge-based Deployments
- iv. Hybrid Deployments
- v. Modular Deployments
- vi. Summary
- i. On-premises Deployment
- 3.1.1. Deployment Models
4. Future Leaders Index
- 4.1. Why Read This Report
- Figure 4.1: Juniper Research Future Leaders Index: Smart Traffic Management Vendor Solutions
- Figure 4.2: Juniper Research Future Leaders Index: Smart Traffic Management Vendors
- Table 4.3: Juniper Research Smart Traffic Management Vendors Ranking
- Figure 4.4: Juniper Research Future Leaders Index Heatmap: Smart Traffic Management Vendors
- 4.2. Vendor Profiles
- 4.2.1. AISP
- i. Corporate
- ii. Geographical Spread
- iii. Key Clients and Strategic Partnerships
- iv. High-level View of Offerings
- v. Juniper Research's View: Key Strengths & Strategic Opportunities
- 4.2.2. Asura Technologies
- i. Corporate
- ii. Geographical Spread
- iii. Key Clients and Strategic Partnerships
- iv. High-level View of Offerings
- v. Juniper Research's View: Key Strengths & Strategic Opportunities
- 4.2.3. Autilent
- i. Corporate
- ii. Geographical Spread
- iii. Key Clients and Strategic Partnerships
- iv. High-level View of Offerings
- v. Juniper Research's View: Key Strengths & Strategic Opportunities
- 4.2.4. Flow Labs
- i. Corporate
- ii. Geographical Spread
- iii. Key Clients and Strategic Partnerships
- iv. High-level View of Offerings
- v. Juniper Research's View: Key Strengths & Strategic Opportunities
- 4.2.5. GridMatrix
- i. Corporate
- ii. Geographical Spread
- iii. Key Clients and Strategic Partnerships
- iv. High-level View of Offerings
- v. Juniper Research's View: Key Strengths & Strategic Opportunities
- 4.2.6. NoTraffic
- i. Corporate
- ii. Geographical Spread
- iii. Key Clients and Strategic Partnerships
- iv. High-level View of Offerings
- v. Juniper Research's View: Key Strengths & Strategic Opportunities
- 4.2.7. Pushpak AI
- i. Corporate
- ii. Geographical Spread
- iii. Key Clients and Strategic Partnerships
- iv. High-level View of Offerings
- v. Juniper Research's View: Key Strengths & Strategic Opportunities
- 4.2.8. Simplifai Systems
- i. Corporate
- ii. Geographical Spread
- iii. Key Clients and Strategic Partnerships
- iv. High-level View of Offerings
- v. Juniper Research's View: Key Strengths & Strategic Opportunities
- 4.2.1. AISP
- 4.3. Juniper Research Future Leaders Index Assessment Methodology
- 4.4. Limitations & Interpretations
- Figure 4.5: Juniper Research Future Leaders Index: Smart Traffic Management Services Criteria
Competitor Leaderboard
1. Juniper Research Competitor Leaderboard
- Why Read this Report
- Table 1.1: Juniper Research Competitor Leaderboard: Smart Traffic Management Providers: Product & Portfolio (Part 1)
- Table 1.1: Juniper Research Competitor Leaderboard: Smart Traffic Management Providers: Product & Portfolio (Part 2)
- Figure 1.2: Juniper Research Competitor Leaderboard: Smart Traffic Management Vendors
- Source: Juniper Research
- Table 1.3: Juniper Research Competitor Leaderboard: Vendor & Position
- Figure 1.4: Juniper Research Competitor Leaderboard Heatmap: Smart Traffic Management Vendors
2. Company Profiles
- 2.1. Vendor Profiles
- 2.1.1. AtkinsRealis
- i. Corporate Information
- Table 2.1: AtkinsRealis's Financial Summary ($m), 2022-2023
- ii. Geographical Spread
- iii. Key Clients & Strategic Partnerships
- iv. High-level View of Offerings
- v. Juniper Research's View: Key Strengths & Strategic Development Opportunities
- i. Corporate Information
- 2.1.2. Cubic Corporation
- i. Corporate Information
- ii. Geographical Spread
- iii. Key Clients & Strategic Partnerships
- iv. High-level View of Offerings
- v. Juniper Research's View: Key Strengths & Strategic Development Opportunities
- 2.1.3. Huawei Technologies
- i. Corporate Information
- Table 2.2: Huawei's Financial Information ($m), 2023-2024
- ii. Geographical Spread
- iii. Key Clients & Strategic Partnerships
- iv. High-level View of Offerings
- Figure 2.3: Diagram of Huawei's Intelligent Transportation System
- v. Juniper Research's View: Key Strengths & Strategic Development Opportunities
- i. Corporate Information
- 2.1.4. IBM
- i. Corporate Information
- Table 2.4: IBM's Financial Summary ($m), 2023-2024
- ii. Geographical Spread
- iii. Key Clients & Strategic Partnerships
- iv. High-level View of Offerings
- v. Juniper Research's View: Key Strengths & Strategic Development Opportunities
- i. Corporate Information
- 2.1.5. Indra Group
- i. Corporate Information
- Table 2.5: Indra's Financial Summary ($m), 2023-2024
- ii. Geographical Spread
- iii. Key Clients & Strategic Partnerships
- iv. High-level View of Offerings
- v. Juniper Research's View: Key Strengths & Strategic Development Opportunities
- i. Corporate Information
- 2.1.6. INRIX
- i. Corporate Information
- ii. Geographical Spread
- iii. Key Clients & Strategic Partnerships
- iv. High-level View of Offerings
- v. Juniper Research's View: Key Strengths & Strategic Development Opportunities
- 2.1.7. Iteris
- i. Corporate
- Table 2.6: Iteris's Financial Summary ($m), 2023-2024
- ii. Geographical Spread
- iii. Key Clients & Strategic Partnerships
- iv. High-level View of Offerings
- Figure 2.7: Diagram of Iteris's ClearMobility Platform
- v. Juniper Research's View: Key Strengths & Strategic Development Opportunities
- i. Corporate
- 2.1.8. Kapsch TrafficCom
- i. Corporate Information
- Table 2.8: Kapsch TrafficCom's Financial Summary ($m), 2023-2024
- ii. Geographical Spread
- iii. Key Clients & Strategic Partnerships
- iv. High-level View of Offerings
- v. Juniper Research's View: Key Strengths & Strategic Development Opportunities
- i. Corporate Information
- 2.1.9. Miovision
- i. Corporate
- ii. Geographical Spread
- iii. Key Clients & Strategic Partnerships
- iv. High-level View of Offerings
- v. Juniper Research's View: Key Strengths & Strategic Development Opportunities
- 2.1.10. Q-Free
- i. Corporate
- ii. Geographical Spread
- iii. Key Clients & Strategic Partnerships
- iv. High-level View of Offerings
- v. Juniper Research's View: Key Strengths & Strategic Development Opportunities
- 2.1.11. Thales
- i. Corporate Information
- Table 2.9: Thales's Financial Summary ($m), 2023-2024
- ii. Geographical Spread
- iii. Key Clients & Strategic Partnerships
- iv. High-level View of Offerings
- v. Juniper Research's View: Key Strengths & Strategic Development Opportunities
- i. Corporate Information
- 2.1.12. TomTom
- i. Corporate Information
- Table 2.10: TomTom's Financial Summary ($m), 2023-2024
- ii. Geographical Spread
- iii. Key Clients & Strategic Partnerships
- iv. High-level View of Offerings
- v. Juniper Research's View: Key Strengths & Strategic Development Opportunities
- i. Corporate Information
- 2.1.13. TransCore
- i. Corporate Information
- ii. Geographical Spread
- iii. Key Clients & Strategic Partnerships
- iv. High-level View of Offerings
- v. Juniper Research's View: Key Strengths & Strategic Development Opportunities
- 2.1.14. Transoft Solutions
- i. Corporate Information
- ii. Geographical Spread
- iii. Key Clients and Strategic Partnerships
- iv. High-level View of Offerings
- v. Juniper Research's View: Key Strengths & Strategic Development Opportunities
- 2.1.15. Umovity
- i. Corporate Information
- ii. Geographical Spread
- iii. Key Clients & Strategic Partnerships
- iv. High-level View of Offerings
- v. Juniper Research's View: Key Strengths & Strategic Development Opportunities
- 2.1.1. AtkinsRealis
- 2.2. Juniper Research Leaderboard Assessment Methodology
- 2.2.1. Limitation & Interpretations
- Table 2.11: Juniper Research Competitor Leaderboard Scoring Criteria: Smart Traffic Management Vendors
- 2.2.1. Limitation & Interpretations
- 2.3. Related Research
Data & Forecasting
1. Introduction and Methodology
- 1.1. Smart Traffic Management Market Summary and Future Outlook
- 1.2. Forecast Methodology
- Figure 1.1: Smart Intersections Methodology
- Figure 1.2: Smart Parking Methodology
- Figure 1.3: Smart Highway Forecast Methodology
- Figure 1.4: Congestion Management Forecast Methodology
- Figure 1.5: Emissions Reduction Forecast Methodology
2. Market Overview
- 2.1. Total Number of Deployed Smart Traffic Management Systems
- Figure and Table 2.1: Total Number of Deployed Smart Traffic Management Systems (m), Split by 8 Key Regions, 2025-2030
- 2.2. Total Smart Traffic Management Spend
- Figure and Table 2.2: Total Smart Traffic Management Spend ($m), Split by 8 Key Regions, 2025-2030
3. Smart Intersections
- 3.1. Total Number of Smart Intersections
- Figure and Table 3.1: Total Number of Smart Traffic Intersections (m), Split by 8 Key Regions, 2025-2030
- 3.1.1. Total Smart Intersection Spend
- Figure and Table 3.2: Total Smart Intersection Spend ($m), Split by 8 Key Regions, 2025-2030
4. Smart Parking
- 4.1. Total Number of Smart Parking Spaces
- Figure and Table 4.1: Total Smart Parking Spaces (m), Split by 8 Key Regions, 2025-2030
- 4.2. Total Smart Parking Spend
- Figure and Table 4.2: Total Smart Parking Spend ($m), Split by 8 Key Regions, 2025-2030
5. Smart Highways
- 5.1. Total Length of Highways Converted to Smart Highways
- Figure and Table 5.1: Total Length of Highways Converted to Smart Highways (km), Split by 8 Key Regions, 2025-2030
- 5.2. Total Smart Highway Spend
- Figure and Table 5.2: Total Smart Highway Spend ($m), Split by 8 Key Regions, 2025-2030
6. Congestion Management
- 6.1. Total Cost of Congestion Saved by Smart Traffic Management Systems
- Figure and Table 6.1: Total Cost of Congestion Saved by Smart Traffic Management Systems ($m), Split by 8 Key Regions, 2025-2030
7. Emissions Reduction
- 7.1. Total City Vehicle Emissions Cost Savings
- Figure and Table 7.1: Total City Vehicle Emissions Cost Savings ($m), Split by 8 Key Regions, 2025-2030
 通訊流量管理市場預測至2034年-按組件、部署模式、網路類型、技術、應用、最終用戶和地區分類的全球分析
 交通管理市場:按組件、技術、應用、最終用戶和部署模式分類-2026-2032年全球市場預測智慧交通管理系統市場預測至2034年-按解決方案、技術、最終用戶和區域分類的全球分析智慧交通管理與物聯網賦能道路市場預測:至2034年-按組件、部署模式、技術、應用和區域分類的全球分析智慧交通號誌市場按組件、連接方式、應用、安裝和最終用戶分類,全球預測(2026-2032年)
 交通管理市場分析及預測(至2035年):依類型、產品類型、服務、技術、組件、應用、設備、部署類型、最終用戶及解決方案分類
 運輸管理系統市場機會、成長要素、產業趨勢分析及預測(2026-2035年)
 交通管理市場規模、佔有率和成長分析(按組件、系統、應用和地區分類)—產業預測(2026-2033 年)交通管理市場預測至2032年:按組件、系統、部署模式、應用、最終用戶和區域分類的全球分析
 智慧交通管理系統市場-全球產業規模、佔有率、趨勢、機會和預測(按組件、按解決方案類型、按應用、按地區和按競爭分類,2020 年至 2030 年)