


 |
市場調查報告書
商品編碼
1413911
人工植牙和修復市場:按產品、材料、類型和最終用戶分類 - 全球預測 2024-2030Dental Implants & Prosthetics Market by Product (Dental Bridge, Dental Crowns, Dental Implants), Material (Ceramic, Titanium, Zirconium), Type, End-Use - Global Forecast 2024-2030 |
||||||
※ 本網頁內容可能與最新版本有所差異。詳細情況請與我們聯繫。
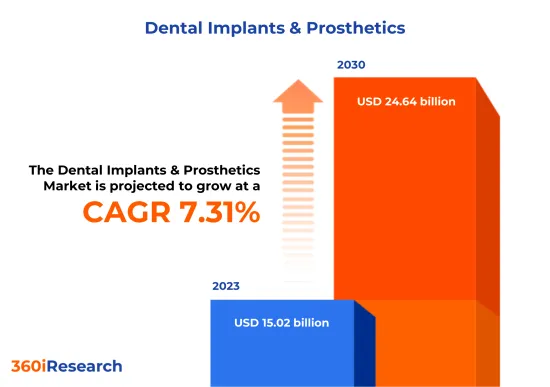
預計2023年人工植牙和修復體市場規模為150.2億美元,預計2024年將達161億美元,2030年將達246.4億美元,複合年成長率為7.31%。
全球人工植牙和修復體市場
| 主要市場統計 | |
|---|---|
| 基準年[2023] | 150.2億美元 |
| 預測年份 [2024] | 161億美元 |
| 預測年份 [2030] | 246.4億美元 |
| 複合年成長率(%) | 7.31% |
人工植牙是人造牙根,透過手術插入牙齦線下方的顎骨中,為支撐一顆或多顆人造牙齒(稱為牙冠)提供堅固、堅固的基礎。人工植牙旨在模仿生物牙齒的型態和功能。植入為失去牙齒的人提供了長期的解決方案,改善口腔健康、舒適度和美觀。牙科修補,又稱假牙學或牙科修補,是利用生物相容性替代品對牙齒或顎顏面組織缺損或缺損的患者進行口腔修復、舒適和美觀,進行健康診斷、治療、復健和維護。這包括假牙、牙冠、牙橋和植入支撐的修復體。人工植牙和修復市場由涉及人造牙結構製造、分銷和零售的公司組成。此市場範圍涵蓋新型植入材料和義肢設計的研發、製造、銷售和售後服務。它還包括對牙醫和牙科技師的專門培訓、手術技術的改進以及 CAD/CAM 系統和 3D 列印等數位牙科工具的整合。人工植牙和修復體市場的成長是由全球人口老化(牙齒更容易脫落)、牙科和牙周病流行導致的需求增加、全球美容牙科的新興趨勢以及全球可支配收入推動的。和醫療保健支出。有幾個因素在起作用,包括然而,人工植牙和修復術的採用受到以下因素的阻礙:人工植牙手術和修復術相關的高成本、與人工植牙和修復術相關的報銷有限、產品核可的嚴格監管要求、延誤和成本增加。 ,包括原因同時,持續的技術發展,例如人工植牙和修復體產品的增加,以及數位牙科和 CAD/CAM 技術的日益採用,為未來幾年的市場帶來了潛在的成長機會。
區域洞察
美國擁有完善的醫療保健體系和較高的人均醫療支出,對美容牙科和先進牙科治療的需求很高。客戶的購買行為趨向於優質、高品質的植入和義肢,偏好微創手術。儘管加拿大的公共健康保險涵蓋兒童的基本牙科服務,但成年人通常選擇私人牙科護理,其中包括植入和義肢等高級治療。在歐洲,對植入和義肢的需求強勁,成長集中在德國、英國、法國和義大利等國家。牙科疾病的高盛行率和完善的醫療保健系統有助於市場擴張。歐盟國家對醫療設備有高標準和強力的法律規範,為要求品質和可靠性的市場做出了貢獻。在高所得水平和對美學的關注的推動下,中東地區(尤其是海灣國家)對高階牙科服務的需求正在迅速成長。另一方面,由於醫療保健支出較低和獲得牙科護理的機會有限,非洲市場基本上開拓,但由於都市化和經濟發展,預計該市場將逐漸擴大。亞太地區,尤其是中國、日本和印度,為人工植牙和修復體提供了巨大的成長機會。口腔健康意識的提高、可支配收入的增加和老年人口的增加是主要促進因素。該地區對醫療基礎設施和牙科旅遊業的投資也有所增加。
FPNV定位矩陣
FPNV定位矩陣對於評估人工植牙和修復體市場至關重要。我們檢視與業務策略和產品滿意度相關的關鍵指標,以對供應商進行全面評估。這種深入的分析使用戶能夠根據自己的要求做出明智的決策。根據評估,供應商被分為四個成功程度不同的像限:前沿(F)、探路者(P)、利基(N)和重要(V)。
市場佔有率分析
市場佔有率分析是一種綜合工具,可以對人工植牙和修復體市場供應商的現狀進行深入而深入的研究。全面比較和分析供應商在整體收益、基本客群和其他關鍵指標方面的貢獻,以便更好地了解公司的績效及其在爭奪市場佔有率時面臨的挑戰。此外,該分析還提供了對該行業競爭特徵的寶貴考察,包括在研究基準年觀察到的累積、分散主導地位和合併特徵等因素。這種詳細程度的提高使供應商能夠做出更明智的決策並制定有效的策略,從而在市場上獲得競爭優勢。
本報告在以下方面提供了寶貴的見解:
1-市場滲透率:提供有關主要企業所服務的市場的全面資訊。
2-市場開拓:我們深入研究利潤豐厚的新興市場,並分析它們在成熟細分市場中的滲透率。
3- 市場多元化:提供有關新產品發布、開拓地區、最新發展和投資的詳細資訊。
4-競爭力評估與資訊:對主要企業的市場佔有率、策略、產品、認證、監管狀況、專利狀況、製造能力等進行全面評估。
5- 產品開發與創新:提供對未來技術、研發活動和突破性產品開發的見解。
本報告解決了以下關鍵問題:
1-人工植牙和修復體市場的市場規模和預測是多少?
2-在人工植牙和修復體市場的預測期內,有哪些產品、細分市場、應用和領域需要考慮投資?
3-人工植牙和修復市場的技術趨勢和法律規範是什麼?
4-人工植牙和修復市場主要供應商的市場佔有率是多少?
5-進入人工植牙和修復體市場合適的型態和策略手段是什麼?
目錄
第1章 前言
第2章調查方法
第3章執行摘要
第4章市場概況
第5章市場洞察
- 市場動態
- 促進因素
- 由於牙科和牙周病的流行,需求增加
- 全球美容牙科新趨勢
- 全球可支配收入和醫療費用增加
- 抑制因素
- 與人工植牙手術和修復相關的高成本
- 機會
- 持續技術發展,人工植牙和修復體新產品數量不斷增加
- 擴大數位牙科和 CAD/CAM 技術的引進
- 任務
- 與人工植牙和義肢相關的有限報銷
- 促進因素
- 市場區隔分析
- 產品:作為缺牙的長期解決方案,對人工植牙的需求增加
- 材質:陶瓷人工植牙因其出色的美觀性而變得越來越受歡迎
- 類型:由於易於引入,擴大了可拆式義肢的使用
- 最終用途:牙醫醫院和診所對人工植牙和修復的需求不斷增加
- 市場趨勢分析
- 高通膨的累積效應
- 波特五力分析
- 價值鍊和關鍵路徑分析
- 法律規範
第6章人工植牙與修復市場:依產品
- 牙橋
- 牙冠
- 人工植牙
- 牙貼面
- 假牙
第7章人工植牙與修復市場:依材料分類
- 陶瓷製品
- 鈦
- 鋯
第8章人工植牙和修復市場:按類型
- 不可拆卸
- 可拆卸的
第9章人工植牙和修復市場:依最終用途
- 牙醫醫院和診所
- 牙科調查
第10章美洲人工植牙與修復體市場
- 阿根廷
- 巴西
- 加拿大
- 墨西哥
- 美國
第11章亞太地區人工植牙與修復市場
- 澳洲
- 中國
- 印度
- 印尼
- 日本
- 馬來西亞
- 菲律賓
- 新加坡
- 韓國
- 台灣
- 泰國
- 越南
第12章歐洲、中東和非洲的人工植牙和修復市場
- 丹麥
- 埃及
- 芬蘭
- 法國
- 德國
- 以色列
- 義大利
- 荷蘭
- 奈及利亞
- 挪威
- 波蘭
- 卡達
- 俄羅斯
- 沙烏地阿拉伯
- 南非
- 西班牙
- 瑞典
- 瑞士
- 土耳其
- 阿拉伯聯合大公國
- 英國
第13章競爭形勢
- FPNV定位矩陣
- 市場佔有率分析:主要企業
- 主要企業競爭情境分析
- 併購
- 新產品發布和功能增強
- 獎項/獎勵/擴展
第14章競爭產品組合
- 主要公司簡介
- 3M Company
- Adin Dental Implant Systems Ltd.
- Alpha-Bio Tec Ltd.
- Anatomage Inc.
- AVINENT IMPLANT SYSTEM, SLU
- BEGO GmbH & Co. KG
- Bicon LLC
- Blue Sky Bio, LLC
- CAMLOG Biotechnologies GmbH
- Cortex Dental Implants Industries Ltd.
- DENTIS Co., Ltd.
- DentiumUSA
- DENTSPLY SIRONA Inc.
- Dio Implant Co., Ltd.
- Envista Holding Corporation
- Henry Schein Inc.
- HIOSSEN
- Institut Straumann AG
- Ivoclar Vivadent AG
- Keystone Dental Inc.
- Kuraray Co., Ltd.
- Mega'gen Implant Co.,Ltd
- National Dentex, LLC
- Neobiotech
- Neoss Limited
- Osstem Implant Co. Ltd.
- Planmeca OY
- ProScan
- Septodont Holding
- Southern Implants
- Spotimplant by Allisone Technologies
- Sweden & Martina SpA
- Thommen Medical AG
- Titan Implants Inc.
- TOV Implant Ltd.
- ZimVie Inc.
- 主要產品系列
第15章附錄
- 討論指南
- 關於許可證和定價
[184 Pages Report] The Dental Implants & Prosthetics Market size was estimated at USD 15.02 billion in 2023 and expected to reach USD 16.10 billion in 2024, at a CAGR 7.31% to reach USD 24.64 billion by 2030.
Global Dental Implants & Prosthetics Market
| KEY MARKET STATISTICS | |
|---|---|
| Base Year [2023] | USD 15.02 billion |
| Estimated Year [2024] | USD 16.10 billion |
| Forecast Year [2030] | USD 24.64 billion |
| CAGR (%) | 7.31% |
Dental implants are manufactured tooth roots surgically inserted into the jawbone beneath the gum line to provide a strong and sturdy ground for sustaining one or more artificial teeth, known as crowns. Dental implants are designed to imitate the form and function of biological teeth. They can be an efficacious long-term solution for individuals who suffer from missing teeth, offering improved oral health, comfort, and aesthetics. Dental prosthetics, also known as prosthetic dentistry or prosthodontics, involve diagnosing, treating, rehabilitating, and maintaining oral procedure, comfort, appearance, and health of patients with misplaced or deficient teeth and oral and maxillofacial tissues using biocompatible substitutes. This includes dentures, crowns, bridges, and implant-supported prostheses. The market for dental implants and prosthetics comprises businesses involved in producing, distributing, and retailing artificial dental structures. The scope of this market extends from the research and development of new implant materials and prosthetic designs to manufacturing, sales, and post-sale services. It also includes professional training for dentists and technicians, improving surgical techniques, and integrating digital dentistry tools such as CAD/CAM systems and 3D printing. Several factors influence the growth of the dental implants and prosthetics market, including an aging global population susceptible to tooth loss, increasing demand due to the prevalence of dental and periodontal diseases, emerging trends of cosmetic dentistry globally, and rising disposable income and healthcare expenditure worldwide. However, the adoption of dental implants and prosthetics is hindered by several challenges, such as High costs associated with dental implant procedures and prostheses, limited reimbursements associated with dental implants and prosthetics, and stringent regulatory requirements for product approval, causing delays and increased costs. On the other hand, ongoing technological developments with rising product launches in dental implants and prosthetics and expanding adoption of digital dentistry and CAD/CAM technologies present potential opportunities for the marker to grow in the coming years.
Regional Insights
The United States has a high demand for cosmetic dentistry and advanced dental care, supported by a well-established healthcare system and high per capita healthcare expenditure. The customer purchasing behavior leans towards premium, quality implants and prosthetics, with a preference for minimally invasive procedures. Canada's public health insurance covers basic dental services for children, but adults often opt for private dental care, which extends to advanced treatments such as implants and prosthetics. Europe exhibits a strong demand for dental implants and prosthetics, with growth centered in countries such as Germany, the UK, France, and Italy. The high prevalence of dental diseases and well-established healthcare systems contribute to the market's expansion. The EU countries, with their high standards for medical devices and strong regulatory frameworks, contribute to a market that demands quality and reliability. The Middle East, particularly the Gulf nations, shows a burgeoning demand for high-end dental services fueled by high-income levels and a focus on aesthetic appearance. Africa, on the other hand, has a largely untapped market due to lower healthcare spending and limited access to dental care, but it is expected to gradually increase due to urbanization and economic development. The APAC region, especially in nations such as China, Japan, and India, represents a significant growth opportunity for dental implants and prosthetics. Increased awareness about oral health, rising disposable incomes, and a growing elderly population are key drivers. The region is also seeing increased investment in healthcare infrastructure and a rise in dental tourism.
FPNV Positioning Matrix
The FPNV Positioning Matrix is pivotal in evaluating the Dental Implants & Prosthetics Market. It offers a comprehensive assessment of vendors, examining key metrics related to Business Strategy and Product Satisfaction. This in-depth analysis empowers users to make well-informed decisions aligned with their requirements. Based on the evaluation, the vendors are then categorized into four distinct quadrants representing varying levels of success: Forefront (F), Pathfinder (P), Niche (N), or Vital (V).
Market Share Analysis
The Market Share Analysis is a comprehensive tool that provides an insightful and in-depth examination of the current state of vendors in the Dental Implants & Prosthetics Market. By meticulously comparing and analyzing vendor contributions in terms of overall revenue, customer base, and other key metrics, we can offer companies a greater understanding of their performance and the challenges they face when competing for market share. Additionally, this analysis provides valuable insights into the competitive nature of the sector, including factors such as accumulation, fragmentation dominance, and amalgamation traits observed over the base year period studied. With this expanded level of detail, vendors can make more informed decisions and devise effective strategies to gain a competitive edge in the market.
Key Company Profiles
The report delves into recent significant developments in the Dental Implants & Prosthetics Market, highlighting leading vendors and their innovative profiles. These include 3M Company, Adin Dental Implant Systems Ltd., Alpha-Bio Tec Ltd., Anatomage Inc., AVINENT IMPLANT SYSTEM, S.L.U., BEGO GmbH & Co. KG, Bicon LLC, Blue Sky Bio, LLC, CAMLOG Biotechnologies GmbH, Cortex Dental Implants Industries Ltd., DENTIS Co., Ltd., DentiumUSA, DENTSPLY SIRONA Inc., Dio Implant Co., Ltd., Envista Holding Corporation, Henry Schein Inc., HIOSSEN, Institut Straumann AG, Ivoclar Vivadent AG, Keystone Dental Inc., Kuraray Co., Ltd., Mega'gen Implant Co.,Ltd, National Dentex, LLC, Neobiotech, Neoss Limited, Osstem Implant Co. Ltd., Planmeca OY, ProScan, Septodont Holding, Southern Implants, Spotimplant by Allisone Technologies, Sweden & Martina S.p.A., Thommen Medical AG, Titan Implants Inc., TOV Implant Ltd., and ZimVie Inc..
Market Segmentation & Coverage
This research report categorizes the Dental Implants & Prosthetics Market to forecast the revenues and analyze trends in each of the following sub-markets:
- Product
- Dental Bridge
- Dental Crowns
- Dental Implants
- Dental Veneers
- Dentures
- Material
- Ceramic
- Titanium
- Zirconium
- Type
- Non-removable
- Removable
- End-Use
- Dental Hospitals & Clinics
- Dental Research Laboratories
- Region
- Americas
- Argentina
- Brazil
- Canada
- Mexico
- United States
- California
- Florida
- Illinois
- New York
- Ohio
- Pennsylvania
- Texas
- Asia-Pacific
- Australia
- China
- India
- Indonesia
- Japan
- Malaysia
- Philippines
- Singapore
- South Korea
- Taiwan
- Thailand
- Vietnam
- Europe, Middle East & Africa
- Denmark
- Egypt
- Finland
- France
- Germany
- Israel
- Italy
- Netherlands
- Nigeria
- Norway
- Poland
- Qatar
- Russia
- Saudi Arabia
- South Africa
- Spain
- Sweden
- Switzerland
- Turkey
- United Arab Emirates
- United Kingdom
- Americas
The report offers valuable insights on the following aspects:
1. Market Penetration: It presents comprehensive information on the market provided by key players.
2. Market Development: It delves deep into lucrative emerging markets and analyzes the penetration across mature market segments.
3. Market Diversification: It provides detailed information on new product launches, untapped geographic regions, recent developments, and investments.
4. Competitive Assessment & Intelligence: It conducts an exhaustive assessment of market shares, strategies, products, certifications, regulatory approvals, patent landscape, and manufacturing capabilities of the leading players.
5. Product Development & Innovation: It offers intelligent insights on future technologies, R&D activities, and breakthrough product developments.
The report addresses key questions such as:
1. What is the market size and forecast of the Dental Implants & Prosthetics Market?
2. Which products, segments, applications, and areas should one consider investing in over the forecast period in the Dental Implants & Prosthetics Market?
3. What are the technology trends and regulatory frameworks in the Dental Implants & Prosthetics Market?
4. What is the market share of the leading vendors in the Dental Implants & Prosthetics Market?
5. Which modes and strategic moves are suitable for entering the Dental Implants & Prosthetics Market?
Table of Contents
1. Preface
- 1.1. Objectives of the Study
- 1.2. Market Segmentation & Coverage
- 1.3. Years Considered for the Study
- 1.4. Currency & Pricing
- 1.5. Language
- 1.6. Limitations
- 1.7. Assumptions
- 1.8. Stakeholders
2. Research Methodology
- 2.1. Define: Research Objective
- 2.2. Determine: Research Design
- 2.3. Prepare: Research Instrument
- 2.4. Collect: Data Source
- 2.5. Analyze: Data Interpretation
- 2.6. Formulate: Data Verification
- 2.7. Publish: Research Report
- 2.8. Repeat: Report Update
3. Executive Summary
4. Market Overview
- 4.1. Introduction
- 4.2. Dental Implants & Prosthetics Market, by Region
5. Market Insights
- 5.1. Market Dynamics
- 5.1.1. Drivers
- 5.1.1.1. Increasing demand due to the prevalence of dental and periodontal diseases
- 5.1.1.2. Emerging trend of cosmetic dentistry globally
- 5.1.1.3. Rising disposable income and healthcare expenditure worldwide
- 5.1.2. Restraints
- 5.1.2.1. High costs associated with dental implant procedures and prosthesis
- 5.1.3. Opportunities
- 5.1.3.1. Ongoing technological developments with rising product launches in dental implants and prosthetics
- 5.1.3.2. Expanding adoption of digital dentistry and CAD/CAM technologies
- 5.1.4. Challenges
- 5.1.4.1. Limited reimbursements associated with dental implants and prosthetic
- 5.1.1. Drivers
- 5.2. Market Segmentation Analysis
- 5.2.1. Product: Increasing demand for dental implants for a long-term solution to tooth loss
- 5.2.2. Material: Rising preference for ceramic dental implants for its excellent aesthetics
- 5.2.3. Type: Expanding usage of removable prosthetics due to its ease of adoption
- 5.2.4. End-Use: Growing demand for dental implants & prosthetics from dental hospitals & clinics
- 5.3. Market Trend Analysis
- 5.4. Cumulative Impact of High Inflation
- 5.5. Porter's Five Forces Analysis
- 5.5.1. Threat of New Entrants
- 5.5.2. Threat of Substitutes
- 5.5.3. Bargaining Power of Customers
- 5.5.4. Bargaining Power of Suppliers
- 5.5.5. Industry Rivalry
- 5.6. Value Chain & Critical Path Analysis
- 5.7. Regulatory Framework
6. Dental Implants & Prosthetics Market, by Product
- 6.1. Introduction
- 6.2. Dental Bridge
- 6.3. Dental Crowns
- 6.4. Dental Implants
- 6.5. Dental Veneers
- 6.6. Dentures
7. Dental Implants & Prosthetics Market, by Material
- 7.1. Introduction
- 7.2. Ceramic
- 7.3. Titanium
- 7.4. Zirconium
8. Dental Implants & Prosthetics Market, by Type
- 8.1. Introduction
- 8.2. Non-removable
- 8.3. Removable
9. Dental Implants & Prosthetics Market, by End-Use
- 9.1. Introduction
- 9.2. Dental Hospitals & Clinics
- 9.3. Dental Research Laboratories
10. Americas Dental Implants & Prosthetics Market
- 10.1. Introduction
- 10.2. Argentina
- 10.3. Brazil
- 10.4. Canada
- 10.5. Mexico
- 10.6. United States
11. Asia-Pacific Dental Implants & Prosthetics Market
- 11.1. Introduction
- 11.2. Australia
- 11.3. China
- 11.4. India
- 11.5. Indonesia
- 11.6. Japan
- 11.7. Malaysia
- 11.8. Philippines
- 11.9. Singapore
- 11.10. South Korea
- 11.11. Taiwan
- 11.12. Thailand
- 11.13. Vietnam
12. Europe, Middle East & Africa Dental Implants & Prosthetics Market
- 12.1. Introduction
- 12.2. Denmark
- 12.3. Egypt
- 12.4. Finland
- 12.5. France
- 12.6. Germany
- 12.7. Israel
- 12.8. Italy
- 12.9. Netherlands
- 12.10. Nigeria
- 12.11. Norway
- 12.12. Poland
- 12.13. Qatar
- 12.14. Russia
- 12.15. Saudi Arabia
- 12.16. South Africa
- 12.17. Spain
- 12.18. Sweden
- 12.19. Switzerland
- 12.20. Turkey
- 12.21. United Arab Emirates
- 12.22. United Kingdom
13. Competitive Landscape
- 13.1. FPNV Positioning Matrix
- 13.2. Market Share Analysis, By Key Player
- 13.3. Competitive Scenario Analysis, By Key Player
- 13.3.1. Merger & Acquisition
- 13.3.1.1. Henry Schein acquires majority stake in Biotech Dental
- 13.3.2. New Product Launch & Enhancement
- 13.3.2.1. Keystone Dental Announces Launch of the GENESIS ACTIVE Dental Implant System
- 13.3.2.2. BlueSkyBio Adds AI-Powered Automatic Implant Placing to Software
- 13.3.3. Award, Recognition, & Expansion
- 13.3.3.1. SprintRay Launches OnX Tough 2, the First and Only 3D Printing Resin FDA Cleared for Fixed, Implant-Supported Dentures
- 13.3.1. Merger & Acquisition
14. Competitive Portfolio
- 14.1. Key Company Profiles
- 14.1.1. 3M Company
- 14.1.2. Adin Dental Implant Systems Ltd.
- 14.1.3. Alpha-Bio Tec Ltd.
- 14.1.4. Anatomage Inc.
- 14.1.5. AVINENT IMPLANT SYSTEM, S.L.U.
- 14.1.6. BEGO GmbH & Co. KG
- 14.1.7. Bicon LLC
- 14.1.8. Blue Sky Bio, LLC
- 14.1.9. CAMLOG Biotechnologies GmbH
- 14.1.10. Cortex Dental Implants Industries Ltd.
- 14.1.11. DENTIS Co., Ltd.
- 14.1.12. DentiumUSA
- 14.1.13. DENTSPLY SIRONA Inc.
- 14.1.14. Dio Implant Co., Ltd.
- 14.1.15. Envista Holding Corporation
- 14.1.16. Henry Schein Inc.
- 14.1.17. HIOSSEN
- 14.1.18. Institut Straumann AG
- 14.1.19. Ivoclar Vivadent AG
- 14.1.20. Keystone Dental Inc.
- 14.1.21. Kuraray Co., Ltd.
- 14.1.22. Mega'gen Implant Co.,Ltd
- 14.1.23. National Dentex, LLC
- 14.1.24. Neobiotech
- 14.1.25. Neoss Limited
- 14.1.26. Osstem Implant Co. Ltd.
- 14.1.27. Planmeca OY
- 14.1.28. ProScan
- 14.1.29. Septodont Holding
- 14.1.30. Southern Implants
- 14.1.31. Spotimplant by Allisone Technologies
- 14.1.32. Sweden & Martina S.p.A.
- 14.1.33. Thommen Medical AG
- 14.1.34. Titan Implants Inc.
- 14.1.35. TOV Implant Ltd.
- 14.1.36. ZimVie Inc.
- 14.2. Key Product Portfolio
15. Appendix
- 15.1. Discussion Guide
- 15.2. License & Pricing
LIST OF FIGURES
- FIGURE 1. DENTAL IMPLANTS & PROSTHETICS MARKET RESEARCH PROCESS
- FIGURE 2. DENTAL IMPLANTS & PROSTHETICS MARKET SIZE, 2023 VS 2030
- FIGURE 3. DENTAL IMPLANTS & PROSTHETICS MARKET SIZE, 2018-2030 (USD MILLION)
- FIGURE 4. DENTAL IMPLANTS & PROSTHETICS MARKET SIZE, BY REGION, 2023 VS 2030 (%)
- FIGURE 5. DENTAL IMPLANTS & PROSTHETICS MARKET SIZE, BY REGION, 2023 VS 2024 VS 2030 (USD MILLION)
- FIGURE 6. DENTAL IMPLANTS & PROSTHETICS MARKET DYNAMICS
- FIGURE 7. DENTAL IMPLANTS & PROSTHETICS MARKET SIZE, BY PRODUCT, 2023 VS 2030 (%)
- FIGURE 8. DENTAL IMPLANTS & PROSTHETICS MARKET SIZE, BY PRODUCT, 2023 VS 2024 VS 2030 (USD MILLION)
- FIGURE 9. DENTAL IMPLANTS & PROSTHETICS MARKET SIZE, BY MATERIAL, 2023 VS 2030 (%)
- FIGURE 10. DENTAL IMPLANTS & PROSTHETICS MARKET SIZE, BY MATERIAL, 2023 VS 2024 VS 2030 (USD MILLION)
- FIGURE 11. DENTAL IMPLANTS & PROSTHETICS MARKET SIZE, BY TYPE, 2023 VS 2030 (%)
- FIGURE 12. DENTAL IMPLANTS & PROSTHETICS MARKET SIZE, BY TYPE, 2023 VS 2024 VS 2030 (USD MILLION)
- FIGURE 13. DENTAL IMPLANTS & PROSTHETICS MARKET SIZE, BY END-USE, 2023 VS 2030 (%)
- FIGURE 14. DENTAL IMPLANTS & PROSTHETICS MARKET SIZE, BY END-USE, 2023 VS 2024 VS 2030 (USD MILLION)
- FIGURE 15. AMERICAS DENTAL IMPLANTS & PROSTHETICS MARKET SIZE, BY COUNTRY, 2023 VS 2030 (%)
- FIGURE 16. AMERICAS DENTAL IMPLANTS & PROSTHETICS MARKET SIZE, BY COUNTRY, 2023 VS 2024 VS 2030 (USD MILLION)
- FIGURE 17. UNITED STATES DENTAL IMPLANTS & PROSTHETICS MARKET SIZE, BY STATE, 2023 VS 2030 (%)
- FIGURE 18. UNITED STATES DENTAL IMPLANTS & PROSTHETICS MARKET SIZE, BY STATE, 2023 VS 2024 VS 2030 (USD MILLION)
- FIGURE 19. ASIA-PACIFIC DENTAL IMPLANTS & PROSTHETICS MARKET SIZE, BY COUNTRY, 2023 VS 2030 (%)
- FIGURE 20. ASIA-PACIFIC DENTAL IMPLANTS & PROSTHETICS MARKET SIZE, BY COUNTRY, 2023 VS 2024 VS 2030 (USD MILLION)
- FIGURE 21. EUROPE, MIDDLE EAST & AFRICA DENTAL IMPLANTS & PROSTHETICS MARKET SIZE, BY COUNTRY, 2023 VS 2030 (%)
- FIGURE 22. EUROPE, MIDDLE EAST & AFRICA DENTAL IMPLANTS & PROSTHETICS MARKET SIZE, BY COUNTRY, 2023 VS 2024 VS 2030 (USD MILLION)
- FIGURE 23. DENTAL IMPLANTS & PROSTHETICS MARKET, FPNV POSITIONING MATRIX, 2023
- FIGURE 24. DENTAL IMPLANTS & PROSTHETICS MARKET SHARE, BY KEY PLAYER, 2023
LIST OF TABLES
- TABLE 1. DENTAL IMPLANTS & PROSTHETICS MARKET SEGMENTATION & COVERAGE
- TABLE 2. UNITED STATES DOLLAR EXCHANGE RATE, 2018-2023
- TABLE 3. DENTAL IMPLANTS & PROSTHETICS MARKET SIZE, 2018-2030 (USD MILLION)
- TABLE 4. GLOBAL DENTAL IMPLANTS & PROSTHETICS MARKET SIZE, BY REGION, 2018-2030 (USD MILLION)
- TABLE 5. DENTAL IMPLANTS & PROSTHETICS MARKET SIZE, BY PRODUCT, 2018-2030 (USD MILLION)
- TABLE 6. DENTAL IMPLANTS & PROSTHETICS MARKET SIZE, BY DENTAL BRIDGE, BY REGION, 2018-2030 (USD MILLION)
- TABLE 7. DENTAL IMPLANTS & PROSTHETICS MARKET SIZE, BY DENTAL CROWNS, BY REGION, 2018-2030 (USD MILLION)
- TABLE 8. DENTAL IMPLANTS & PROSTHETICS MARKET SIZE, BY DENTAL IMPLANTS, BY REGION, 2018-2030 (USD MILLION)
- TABLE 9. DENTAL IMPLANTS & PROSTHETICS MARKET SIZE, BY DENTAL VENEERS, BY REGION, 2018-2030 (USD MILLION)
- TABLE 10. DENTAL IMPLANTS & PROSTHETICS MARKET SIZE, BY DENTURES, BY REGION, 2018-2030 (USD MILLION)
- TABLE 11. DENTAL IMPLANTS & PROSTHETICS MARKET SIZE, BY MATERIAL, 2018-2030 (USD MILLION)
- TABLE 12. DENTAL IMPLANTS & PROSTHETICS MARKET SIZE, BY CERAMIC, BY REGION, 2018-2030 (USD MILLION)
- TABLE 13. DENTAL IMPLANTS & PROSTHETICS MARKET SIZE, BY TITANIUM, BY REGION, 2018-2030 (USD MILLION)
- TABLE 14. DENTAL IMPLANTS & PROSTHETICS MARKET SIZE, BY ZIRCONIUM, BY REGION, 2018-2030 (USD MILLION)
- TABLE 15. DENTAL IMPLANTS & PROSTHETICS MARKET SIZE, BY TYPE, 2018-2030 (USD MILLION)
- TABLE 16. DENTAL IMPLANTS & PROSTHETICS MARKET SIZE, BY NON-REMOVABLE, BY REGION, 2018-2030 (USD MILLION)
- TABLE 17. DENTAL IMPLANTS & PROSTHETICS MARKET SIZE, BY REMOVABLE, BY REGION, 2018-2030 (USD MILLION)
- TABLE 18. DENTAL IMPLANTS & PROSTHETICS MARKET SIZE, BY END-USE, 2018-2030 (USD MILLION)
- TABLE 19. DENTAL IMPLANTS & PROSTHETICS MARKET SIZE, BY DENTAL HOSPITALS & CLINICS, BY REGION, 2018-2030 (USD MILLION)
- TABLE 20. DENTAL IMPLANTS & PROSTHETICS MARKET SIZE, BY DENTAL RESEARCH LABORATORIES, BY REGION, 2018-2030 (USD MILLION)
- TABLE 21. AMERICAS DENTAL IMPLANTS & PROSTHETICS MARKET SIZE, BY PRODUCT, 2018-2030 (USD MILLION)
- TABLE 22. AMERICAS DENTAL IMPLANTS & PROSTHETICS MARKET SIZE, BY MATERIAL, 2018-2030 (USD MILLION)
- TABLE 23. AMERICAS DENTAL IMPLANTS & PROSTHETICS MARKET SIZE, BY TYPE, 2018-2030 (USD MILLION)
- TABLE 24. AMERICAS DENTAL IMPLANTS & PROSTHETICS MARKET SIZE, BY END-USE, 2018-2030 (USD MILLION)
- TABLE 25. AMERICAS DENTAL IMPLANTS & PROSTHETICS MARKET SIZE, BY COUNTRY, 2018-2030 (USD MILLION)
- TABLE 26. ARGENTINA DENTAL IMPLANTS & PROSTHETICS MARKET SIZE, BY PRODUCT, 2018-2030 (USD MILLION)
- TABLE 27. ARGENTINA DENTAL IMPLANTS & PROSTHETICS MARKET SIZE, BY MATERIAL, 2018-2030 (USD MILLION)
- TABLE 28. ARGENTINA DENTAL IMPLANTS & PROSTHETICS MARKET SIZE, BY TYPE, 2018-2030 (USD MILLION)
- TABLE 29. ARGENTINA DENTAL IMPLANTS & PROSTHETICS MARKET SIZE, BY END-USE, 2018-2030 (USD MILLION)
- TABLE 30. BRAZIL DENTAL IMPLANTS & PROSTHETICS MARKET SIZE, BY PRODUCT, 2018-2030 (USD MILLION)
- TABLE 31. BRAZIL DENTAL IMPLANTS & PROSTHETICS MARKET SIZE, BY MATERIAL, 2018-2030 (USD MILLION)
- TABLE 32. BRAZIL DENTAL IMPLANTS & PROSTHETICS MARKET SIZE, BY TYPE, 2018-2030 (USD MILLION)
- TABLE 33. BRAZIL DENTAL IMPLANTS & PROSTHETICS MARKET SIZE, BY END-USE, 2018-2030 (USD MILLION)
- TABLE 34. CANADA DENTAL IMPLANTS & PROSTHETICS MARKET SIZE, BY PRODUCT, 2018-2030 (USD MILLION)
- TABLE 35. CANADA DENTAL IMPLANTS & PROSTHETICS MARKET SIZE, BY MATERIAL, 2018-2030 (USD MILLION)
- TABLE 36. CANADA DENTAL IMPLANTS & PROSTHETICS MARKET SIZE, BY TYPE, 2018-2030 (USD MILLION)
- TABLE 37. CANADA DENTAL IMPLANTS & PROSTHETICS MARKET SIZE, BY END-USE, 2018-2030 (USD MILLION)
- TABLE 38. MEXICO DENTAL IMPLANTS & PROSTHETICS MARKET SIZE, BY PRODUCT, 2018-2030 (USD MILLION)
- TABLE 39. MEXICO DENTAL IMPLANTS & PROSTHETICS MARKET SIZE, BY MATERIAL, 2018-2030 (USD MILLION)
- TABLE 40. MEXICO DENTAL IMPLANTS & PROSTHETICS MARKET SIZE, BY TYPE, 2018-2030 (USD MILLION)
- TABLE 41. MEXICO DENTAL IMPLANTS & PROSTHETICS MARKET SIZE, BY END-USE, 2018-2030 (USD MILLION)
- TABLE 42. UNITED STATES DENTAL IMPLANTS & PROSTHETICS MARKET SIZE, BY PRODUCT, 2018-2030 (USD MILLION)
- TABLE 43. UNITED STATES DENTAL IMPLANTS & PROSTHETICS MARKET SIZE, BY MATERIAL, 2018-2030 (USD MILLION)
- TABLE 44. UNITED STATES DENTAL IMPLANTS & PROSTHETICS MARKET SIZE, BY TYPE, 2018-2030 (USD MILLION)
- TABLE 45. UNITED STATES DENTAL IMPLANTS & PROSTHETICS MARKET SIZE, BY END-USE, 2018-2030 (USD MILLION)
- TABLE 46. UNITED STATES DENTAL IMPLANTS & PROSTHETICS MARKET SIZE, BY STATE, 2018-2030 (USD MILLION)
- TABLE 47. ASIA-PACIFIC DENTAL IMPLANTS & PROSTHETICS MARKET SIZE, BY PRODUCT, 2018-2030 (USD MILLION)
- TABLE 48. ASIA-PACIFIC DENTAL IMPLANTS & PROSTHETICS MARKET SIZE, BY MATERIAL, 2018-2030 (USD MILLION)
- TABLE 49. ASIA-PACIFIC DENTAL IMPLANTS & PROSTHETICS MARKET SIZE, BY TYPE, 2018-2030 (USD MILLION)
- TABLE 50. ASIA-PACIFIC DENTAL IMPLANTS & PROSTHETICS MARKET SIZE, BY END-USE, 2018-2030 (USD MILLION)
- TABLE 51. ASIA-PACIFIC DENTAL IMPLANTS & PROSTHETICS MARKET SIZE, BY COUNTRY, 2018-2030 (USD MILLION)
- TABLE 52. AUSTRALIA DENTAL IMPLANTS & PROSTHETICS MARKET SIZE, BY PRODUCT, 2018-2030 (USD MILLION)
- TABLE 53. AUSTRALIA DENTAL IMPLANTS & PROSTHETICS MARKET SIZE, BY MATERIAL, 2018-2030 (USD MILLION)
- TABLE 54. AUSTRALIA DENTAL IMPLANTS & PROSTHETICS MARKET SIZE, BY TYPE, 2018-2030 (USD MILLION)
- TABLE 55. AUSTRALIA DENTAL IMPLANTS & PROSTHETICS MARKET SIZE, BY END-USE, 2018-2030 (USD MILLION)
- TABLE 56. CHINA DENTAL IMPLANTS & PROSTHETICS MARKET SIZE, BY PRODUCT, 2018-2030 (USD MILLION)
- TABLE 57. CHINA DENTAL IMPLANTS & PROSTHETICS MARKET SIZE, BY MATERIAL, 2018-2030 (USD MILLION)
- TABLE 58. CHINA DENTAL IMPLANTS & PROSTHETICS MARKET SIZE, BY TYPE, 2018-2030 (USD MILLION)
- TABLE 59. CHINA DENTAL IMPLANTS & PROSTHETICS MARKET SIZE, BY END-USE, 2018-2030 (USD MILLION)
- TABLE 60. INDIA DENTAL IMPLANTS & PROSTHETICS MARKET SIZE, BY PRODUCT, 2018-2030 (USD MILLION)
- TABLE 61. INDIA DENTAL IMPLANTS & PROSTHETICS MARKET SIZE, BY MATERIAL, 2018-2030 (USD MILLION)
- TABLE 62. INDIA DENTAL IMPLANTS & PROSTHETICS MARKET SIZE, BY TYPE, 2018-2030 (USD MILLION)
- TABLE 63. INDIA DENTAL IMPLANTS & PROSTHETICS MARKET SIZE, BY END-USE, 2018-2030 (USD MILLION)
- TABLE 64. INDONESIA DENTAL IMPLANTS & PROSTHETICS MARKET SIZE, BY PRODUCT, 2018-2030 (USD MILLION)
- TABLE 65. INDONESIA DENTAL IMPLANTS & PROSTHETICS MARKET SIZE, BY MATERIAL, 2018-2030 (USD MILLION)
- TABLE 66. INDONESIA DENTAL IMPLANTS & PROSTHETICS MARKET SIZE, BY TYPE, 2018-2030 (USD MILLION)
- TABLE 67. INDONESIA DENTAL IMPLANTS & PROSTHETICS MARKET SIZE, BY END-USE, 2018-2030 (USD MILLION)
- TABLE 68. JAPAN DENTAL IMPLANTS & PROSTHETICS MARKET SIZE, BY PRODUCT, 2018-2030 (USD MILLION)
- TABLE 69. JAPAN DENTAL IMPLANTS & PROSTHETICS MARKET SIZE, BY MATERIAL, 2018-2030 (USD MILLION)
- TABLE 70. JAPAN DENTAL IMPLANTS & PROSTHETICS MARKET SIZE, BY TYPE, 2018-2030 (USD MILLION)
- TABLE 71. JAPAN DENTAL IMPLANTS & PROSTHETICS MARKET SIZE, BY END-USE, 2018-2030 (USD MILLION)
- TABLE 72. MALAYSIA DENTAL IMPLANTS & PROSTHETICS MARKET SIZE, BY PRODUCT, 2018-2030 (USD MILLION)
- TABLE 73. MALAYSIA DENTAL IMPLANTS & PROSTHETICS MARKET SIZE, BY MATERIAL, 2018-2030 (USD MILLION)
- TABLE 74. MALAYSIA DENTAL IMPLANTS & PROSTHETICS MARKET SIZE, BY TYPE, 2018-2030 (USD MILLION)
- TABLE 75. MALAYSIA DENTAL IMPLANTS & PROSTHETICS MARKET SIZE, BY END-USE, 2018-2030 (USD MILLION)
- TABLE 76. PHILIPPINES DENTAL IMPLANTS & PROSTHETICS MARKET SIZE, BY PRODUCT, 2018-2030 (USD MILLION)
- TABLE 77. PHILIPPINES DENTAL IMPLANTS & PROSTHETICS MARKET SIZE, BY MATERIAL, 2018-2030 (USD MILLION)
- TABLE 78. PHILIPPINES DENTAL IMPLANTS & PROSTHETICS MARKET SIZE, BY TYPE, 2018-2030 (USD MILLION)
- TABLE 79. PHILIPPINES DENTAL IMPLANTS & PROSTHETICS MARKET SIZE, BY END-USE, 2018-2030 (USD MILLION)
- TABLE 80. SINGAPORE DENTAL IMPLANTS & PROSTHETICS MARKET SIZE, BY PRODUCT, 2018-2030 (USD MILLION)
- TABLE 81. SINGAPORE DENTAL IMPLANTS & PROSTHETICS MARKET SIZE, BY MATERIAL, 2018-2030 (USD MILLION)
- TABLE 82. SINGAPORE DENTAL IMPLANTS & PROSTHETICS MARKET SIZE, BY TYPE, 2018-2030 (USD MILLION)
- TABLE 83. SINGAPORE DENTAL IMPLANTS & PROSTHETICS MARKET SIZE, BY END-USE, 2018-2030 (USD MILLION)
- TABLE 84. SOUTH KOREA DENTAL IMPLANTS & PROSTHETICS MARKET SIZE, BY PRODUCT, 2018-2030 (USD MILLION)
- TABLE 85. SOUTH KOREA DENTAL IMPLANTS & PROSTHETICS MARKET SIZE, BY MATERIAL, 2018-2030 (USD MILLION)
- TABLE 86. SOUTH KOREA DENTAL IMPLANTS & PROSTHETICS MARKET SIZE, BY TYPE, 2018-2030 (USD MILLION)
- TABLE 87. SOUTH KOREA DENTAL IMPLANTS & PROSTHETICS MARKET SIZE, BY END-USE, 2018-2030 (USD MILLION)
- TABLE 88. TAIWAN DENTAL IMPLANTS & PROSTHETICS MARKET SIZE, BY PRODUCT, 2018-2030 (USD MILLION)
- TABLE 89. TAIWAN DENTAL IMPLANTS & PROSTHETICS MARKET SIZE, BY MATERIAL, 2018-2030 (USD MILLION)
- TABLE 90. TAIWAN DENTAL IMPLANTS & PROSTHETICS MARKET SIZE, BY TYPE, 2018-2030 (USD MILLION)
- TABLE 91. TAIWAN DENTAL IMPLANTS & PROSTHETICS MARKET SIZE, BY END-USE, 2018-2030 (USD MILLION)
- TABLE 92. THAILAND DENTAL IMPLANTS & PROSTHETICS MARKET SIZE, BY PRODUCT, 2018-2030 (USD MILLION)
- TABLE 93. THAILAND DENTAL IMPLANTS & PROSTHETICS MARKET SIZE, BY MATERIAL, 2018-2030 (USD MILLION)
- TABLE 94. THAILAND DENTAL IMPLANTS & PROSTHETICS MARKET SIZE, BY TYPE, 2018-2030 (USD MILLION)
- TABLE 95. THAILAND DENTAL IMPLANTS & PROSTHETICS MARKET SIZE, BY END-USE, 2018-2030 (USD MILLION)
- TABLE 96. VIETNAM DENTAL IMPLANTS & PROSTHETICS MARKET SIZE, BY PRODUCT, 2018-2030 (USD MILLION)
- TABLE 97. VIETNAM DENTAL IMPLANTS & PROSTHETICS MARKET SIZE, BY MATERIAL, 2018-2030 (USD MILLION)
- TABLE 98. VIETNAM DENTAL IMPLANTS & PROSTHETICS MARKET SIZE, BY TYPE, 2018-2030 (USD MILLION)
- TABLE 99. VIETNAM DENTAL IMPLANTS & PROSTHETICS MARKET SIZE, BY END-USE, 2018-2030 (USD MILLION)
- TABLE 100. EUROPE, MIDDLE EAST & AFRICA DENTAL IMPLANTS & PROSTHETICS MARKET SIZE, BY PRODUCT, 2018-2030 (USD MILLION)
- TABLE 101. EUROPE, MIDDLE EAST & AFRICA DENTAL IMPLANTS & PROSTHETICS MARKET SIZE, BY MATERIAL, 2018-2030 (USD MILLION)
- TABLE 102. EUROPE, MIDDLE EAST & AFRICA DENTAL IMPLANTS & PROSTHETICS MARKET SIZE, BY TYPE, 2018-2030 (USD MILLION)
- TABLE 103. EUROPE, MIDDLE EAST & AFRICA DENTAL IMPLANTS & PROSTHETICS MARKET SIZE, BY END-USE, 2018-2030 (USD MILLION)
- TABLE 104. EUROPE, MIDDLE EAST & AFRICA DENTAL IMPLANTS & PROSTHETICS MARKET SIZE, BY COUNTRY, 2018-2030 (USD MILLION)
- TABLE 105. DENMARK DENTAL IMPLANTS & PROSTHETICS MARKET SIZE, BY PRODUCT, 2018-2030 (USD MILLION)
- TABLE 106. DENMARK DENTAL IMPLANTS & PROSTHETICS MARKET SIZE, BY MATERIAL, 2018-2030 (USD MILLION)
- TABLE 107. DENMARK DENTAL IMPLANTS & PROSTHETICS MARKET SIZE, BY TYPE, 2018-2030 (USD MILLION)
- TABLE 108. DENMARK DENTAL IMPLANTS & PROSTHETICS MARKET SIZE, BY END-USE, 2018-2030 (USD MILLION)
- TABLE 109. EGYPT DENTAL IMPLANTS & PROSTHETICS MARKET SIZE, BY PRODUCT, 2018-2030 (USD MILLION)
- TABLE 110. EGYPT DENTAL IMPLANTS & PROSTHETICS MARKET SIZE, BY MATERIAL, 2018-2030 (USD MILLION)
- TABLE 111. EGYPT DENTAL IMPLANTS & PROSTHETICS MARKET SIZE, BY TYPE, 2018-2030 (USD MILLION)
- TABLE 112. EGYPT DENTAL IMPLANTS & PROSTHETICS MARKET SIZE, BY END-USE, 2018-2030 (USD MILLION)
- TABLE 113. FINLAND DENTAL IMPLANTS & PROSTHETICS MARKET SIZE, BY PRODUCT, 2018-2030 (USD MILLION)
- TABLE 114. FINLAND DENTAL IMPLANTS & PROSTHETICS MARKET SIZE, BY MATERIAL, 2018-2030 (USD MILLION)
- TABLE 115. FINLAND DENTAL IMPLANTS & PROSTHETICS MARKET SIZE, BY TYPE, 2018-2030 (USD MILLION)
- TABLE 116. FINLAND DENTAL IMPLANTS & PROSTHETICS MARKET SIZE, BY END-USE, 2018-2030 (USD MILLION)
- TABLE 117. FRANCE DENTAL IMPLANTS & PROSTHETICS MARKET SIZE, BY PRODUCT, 2018-2030 (USD MILLION)
- TABLE 118. FRANCE DENTAL IMPLANTS & PROSTHETICS MARKET SIZE, BY MATERIAL, 2018-2030 (USD MILLION)
- TABLE 119. FRANCE DENTAL IMPLANTS & PROSTHETICS MARKET SIZE, BY TYPE, 2018-2030 (USD MILLION)
- TABLE 120. FRANCE DENTAL IMPLANTS & PROSTHETICS MARKET SIZE, BY END-USE, 2018-2030 (USD MILLION)
- TABLE 121. GERMANY DENTAL IMPLANTS & PROSTHETICS MARKET SIZE, BY PRODUCT, 2018-2030 (USD MILLION)
- TABLE 122. GERMANY DENTAL IMPLANTS & PROSTHETICS MARKET SIZE, BY MATERIAL, 2018-2030 (USD MILLION)
- TABLE 123. GERMANY DENTAL IMPLANTS & PROSTHETICS MARKET SIZE, BY TYPE, 2018-2030 (USD MILLION)
- TABLE 124. GERMANY DENTAL IMPLANTS & PROSTHETICS MARKET SIZE, BY END-USE, 2018-2030 (USD MILLION)
- TABLE 125. ISRAEL DENTAL IMPLANTS & PROSTHETICS MARKET SIZE, BY PRODUCT, 2018-2030 (USD MILLION)
- TABLE 126. ISRAEL DENTAL IMPLANTS & PROSTHETICS MARKET SIZE, BY MATERIAL, 2018-2030 (USD MILLION)
- TABLE 127. ISRAEL DENTAL IMPLANTS & PROSTHETICS MARKET SIZE, BY TYPE, 2018-2030 (USD MILLION)
- TABLE 128. ISRAEL DENTAL IMPLANTS & PROSTHETICS MARKET SIZE, BY END-USE, 2018-2030 (USD MILLION)
- TABLE 129. ITALY DENTAL IMPLANTS & PROSTHETICS MARKET SIZE, BY PRODUCT, 2018-2030 (USD MILLION)
- TABLE 130. ITALY DENTAL IMPLANTS & PROSTHETICS MARKET SIZE, BY MATERIAL, 2018-2030 (USD MILLION)
- TABLE 131. ITALY DENTAL IMPLANTS & PROSTHETICS MARKET SIZE, BY TYPE, 2018-2030 (USD MILLION)
- TABLE 132. ITALY DENTAL IMPLANTS & PROSTHETICS MARKET SIZE, BY END-USE, 2018-2030 (USD MILLION)
- TABLE 133. NETHERLANDS DENTAL IMPLANTS & PROSTHETICS MARKET SIZE, BY PRODUCT, 2018-2030 (USD MILLION)
- TABLE 134. NETHERLANDS DENTAL IMPLANTS & PROSTHETICS MARKET SIZE, BY MATERIAL, 2018-2030 (USD MILLION)
- TABLE 135. NETHERLANDS DENTAL IMPLANTS & PROSTHETICS MARKET SIZE, BY TYPE, 2018-2030 (USD MILLION)
- TABLE 136. NETHERLANDS DENTAL IMPLANTS & PROSTHETICS MARKET SIZE, BY END-USE, 2018-2030 (USD MILLION)
- TABLE 137. NIGERIA DENTAL IMPLANTS & PROSTHETICS MARKET SIZE, BY PRODUCT, 2018-2030 (USD MILLION)
- TABLE 138. NIGERIA DENTAL IMPLANTS & PROSTHETICS MARKET SIZE, BY MATERIAL, 2018-2030 (USD MILLION)
- TABLE 139. NIGERIA DENTAL IMPLANTS & PROSTHETICS MARKET SIZE, BY TYPE, 2018-2030 (USD MILLION)
- TABLE 140. NIGERIA DENTAL IMPLANTS & PROSTHETICS MARKET SIZE, BY END-USE, 2018-2030 (USD MILLION)
- TABLE 141. NORWAY DENTAL IMPLANTS & PROSTHETICS MARKET SIZE, BY PRODUCT, 2018-2030 (USD MILLION)
- TABLE 142. NORWAY DENTAL IMPLANTS & PROSTHETICS MARKET SIZE, BY MATERIAL, 2018-2030 (USD MILLION)
- TABLE 143. NORWAY DENTAL IMPLANTS & PROSTHETICS MARKET SIZE, BY TYPE, 2018-2030 (USD MILLION)
- TABLE 144. NORWAY DENTAL IMPLANTS & PROSTHETICS MARKET SIZE, BY END-USE, 2018-2030 (USD MILLION)
- TABLE 145. POLAND DENTAL IMPLANTS & PROSTHETICS MARKET SIZE, BY PRODUCT, 2018-2030 (USD MILLION)
- TABLE 146. POLAND DENTAL IMPLANTS & PROSTHETICS MARKET SIZE, BY MATERIAL, 2018-2030 (USD MILLION)
- TABLE 147. POLAND DENTAL IMPLANTS & PROSTHETICS MARKET SIZE, BY TYPE, 2018-2030 (USD MILLION)
- TABLE 148. POLAND DENTAL IMPLANTS & PROSTHETICS MARKET SIZE, BY END-USE, 2018-2030 (USD MILLION)
- TABLE 149. QATAR DENTAL IMPLANTS & PROSTHETICS MARKET SIZE, BY PRODUCT, 2018-2030 (USD MILLION)
- TABLE 150. QATAR DENTAL IMPLANTS & PROSTHETICS MARKET SIZE, BY MATERIAL, 2018-2030 (USD MILLION)
- TABLE 151. QATAR DENTAL IMPLANTS & PROSTHETICS MARKET SIZE, BY TYPE, 2018-2030 (USD MILLION)
- TABLE 152. QATAR DENTAL IMPLANTS & PROSTHETICS MARKET SIZE, BY END-USE, 2018-2030 (USD MILLION)
- TABLE 153. RUSSIA DENTAL IMPLANTS & PROSTHETICS MARKET SIZE, BY PRODUCT, 2018-2030 (USD MILLION)
- TABLE 154. RUSSIA DENTAL IMPLANTS & PROSTHETICS MARKET SIZE, BY MATERIAL, 2018-2030 (USD MILLION)
- TABLE 155. RUSSIA DENTAL IMPLANTS & PROSTHETICS MARKET SIZE, BY TYPE, 2018-2030 (USD MILLION)
- TABLE 156. RUSSIA DENTAL IMPLANTS & PROSTHETICS MARKET SIZE, BY END-USE, 2018-2030 (USD MILLION)
- TABLE 157. SAUDI ARABIA DENTAL IMPLANTS & PROSTHETICS MARKET SIZE, BY PRODUCT, 2018-2030 (USD MILLION)
- TABLE 158. SAUDI ARABIA DENTAL IMPLANTS & PROSTHETICS MARKET SIZE, BY MATERIAL, 2018-2030 (USD MILLION)
- TABLE 159. SAUDI ARABIA DENTAL IMPLANTS & PROSTHETICS MARKET SIZE, BY TYPE, 2018-2030 (USD MILLION)
- TABLE 160. SAUDI ARABIA DENTAL IMPLANTS & PROSTHETICS MARKET SIZE, BY END-USE, 2018-2030 (USD MILLION)
- TABLE 161. SOUTH AFRICA DENTAL IMPLANTS & PROSTHETICS MARKET SIZE, BY PRODUCT, 2018-2030 (USD MILLION)
- TABLE 162. SOUTH AFRICA DENTAL IMPLANTS & PROSTHETICS MARKET SIZE, BY MATERIAL, 2018-2030 (USD MILLION)
- TABLE 163. SOUTH AFRICA DENTAL IMPLANTS & PROSTHETICS MARKET SIZE, BY TYPE, 2018-2030 (USD MILLION)
- TABLE 164. SOUTH AFRICA DENTAL IMPLANTS & PROSTHETICS MARKET SIZE, BY END-USE, 2018-2030 (USD MILLION)
- TABLE 165. SPAIN DENTAL IMPLANTS & PROSTHETICS MARKET SIZE, BY PRODUCT, 2018-2030 (USD MILLION)
- TABLE 166. SPAIN DENTAL IMPLANTS & PROSTHETICS MARKET SIZE, BY MATERIAL, 2018-2030 (USD MILLION)
- TABLE 167. SPAIN DENTAL IMPLANTS & PROSTHETICS MARKET SIZE, BY TYPE, 2018-2030 (USD MILLION)
- TABLE 168. SPAIN DENTAL IMPLANTS & PROSTHETICS MARKET SIZE, BY END-USE, 2018-2030 (USD MILLION)
- TABLE 169. SWEDEN DENTAL IMPLANTS & PROSTHETICS MARKET SIZE, BY PRODUCT, 2018-2030 (USD MILLION)
- TABLE 170. SWEDEN DENTAL IMPLANTS & PROSTHETICS MARKET SIZE, BY MATERIAL, 2018-2030 (USD MILLION)
- TABLE 171. SWEDEN DENTAL IMPLANTS & PROSTHETICS MARKET SIZE, BY TYPE, 2018-2030 (USD MILLION)
- TABLE 172. SWEDEN DENTAL IMPLANTS & PROSTHETICS MARKET SIZE, BY END-USE, 2018-2030 (USD MILLION)
- TABLE 173. SWITZERLAND DENTAL IMPLANTS & PROSTHETICS MARKET SIZE, BY PRODUCT, 2018-2030 (USD MILLION)
- TABLE 174. SWITZERLAND DENTAL IMPLANTS & PROSTHETICS MARKET SIZE, BY MATERIAL, 2018-2030 (USD MILLION)
- TABLE 175. SWITZERLAND DENTAL IMPLANTS & PROSTHETICS MARKET SIZE, BY TYPE, 2018-2030 (USD MILLION)
- TABLE 176. SWITZERLAND DENTAL IMPLANTS & PROSTHETICS MARKET SIZE, BY END-USE, 2018-2030 (USD MILLION)
- TABLE 177. TURKEY DENTAL IMPLANTS & PROSTHETICS MARKET SIZE, BY PRODUCT, 2018-2030 (USD MILLION)
- TABLE 178. TURKEY DENTAL IMPLANTS & PROSTHETICS MARKET SIZE, BY MATERIAL, 2018-2030 (USD MILLION)
- TABLE 179. TURKEY DENTAL IMPLANTS & PROSTHETICS MARKET SIZE, BY TYPE, 2018-2030 (USD MILLION)
- TABLE 180. TURKEY DENTAL IMPLANTS & PROSTHETICS MARKET SIZE, BY END-USE, 2018-2030 (USD MILLION)
- TABLE 181. UNITED ARAB EMIRATES DENTAL IMPLANTS & PROSTHETICS MARKET SIZE, BY PRODUCT, 2018-2030 (USD MILLION)
- TABLE 182. UNITED ARAB EMIRATES DENTAL IMPLANTS & PROSTHETICS MARKET SIZE, BY MATERIAL, 2018-2030 (USD MILLION)
- TABLE 183. UNITED ARAB EMIRATES DENTAL IMPLANTS & PROSTHETICS MARKET SIZE, BY TYPE, 2018-2030 (USD MILLION)
- TABLE 184. UNITED ARAB EMIRATES DENTAL IMPLANTS & PROSTHETICS MARKET SIZE, BY END-USE, 2018-2030 (USD MILLION)
- TABLE 185. UNITED KINGDOM DENTAL IMPLANTS & PROSTHETICS MARKET SIZE, BY PRODUCT, 2018-2030 (USD MILLION)
- TABLE 186. UNITED KINGDOM DENTAL IMPLANTS & PROSTHETICS MARKET SIZE, BY MATERIAL, 2018-2030 (USD MILLION)
- TABLE 187. UNITED KINGDOM DENTAL IMPLANTS & PROSTHETICS MARKET SIZE, BY TYPE, 2018-2030 (USD MILLION)
- TABLE 188. UNITED KINGDOM DENTAL IMPLANTS & PROSTHETICS MARKET SIZE, BY END-USE, 2018-2030 (USD MILLION)
- TABLE 189. DENTAL IMPLANTS & PROSTHETICS MARKET, FPNV POSITIONING MATRIX, 2023
- TABLE 190. DENTAL IMPLANTS & PROSTHETICS MARKET SHARE, BY KEY PLAYER, 2023
- TABLE 191. DENTAL IMPLANTS & PROSTHETICS MARKET LICENSE & PRICING
 2024-2032 年按材料、產品、最終用途和地區分類的牙種植體市場報告
 2024 年人工植牙全球市場報告
 全球植牙與人工牙根市場:洞察、競爭格局、市場預測:2030 年
 牙植體 - 全球市場考量、競爭格局、市場預測 (2030)
 支台齒植入:按類型、材料、連接和最終用戶 - 2024-2030 年全球預測
 2024 年人工植牙和修復體全球市場報告
 人工植牙和牙科修補的全球市場(~2029):按產品(人工植牙和牙科修補)、人工植牙(材料、設計、類型、價格、設施類型)、牙科修補和地區
 全球牙種植體和修復體合約製造市場研究報告 - 2024 年至 2032 年行業分析、規模、佔有率、成長、趨勢和預測
 人工植牙/牙科修補契約製造市場規模、佔有率、趨勢分析報告:按產品、按最終用途、按地區、細分市場預測,2024-2030 年
 牙植體和基台市場:市場規模(按細分市場)、份額、監管、報銷、程序、預測(~2033)