


 |
市場調查報告書
商品編碼
2121107
工業用精密發酵生物反應器市場機會、成長要素、產業趨勢分析及2026-2035年預測Industrial Precision Fermentation Bioreactors Market Opportunity, Growth Drivers, Industry Trend Analysis, and Forecast 2026 - 2035 |
||||||

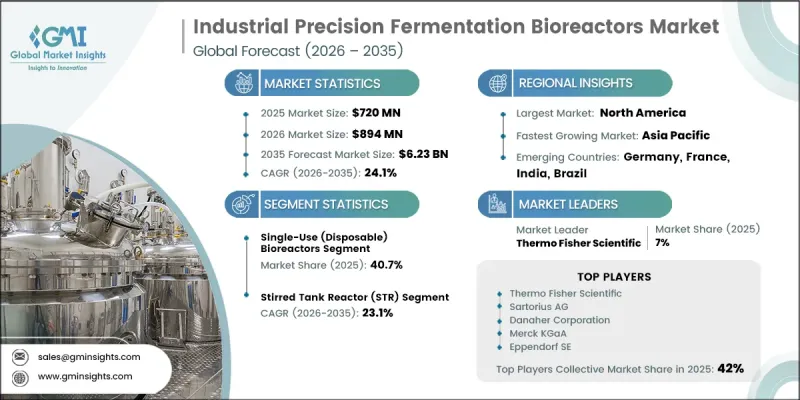
全球工業精密發酵生物反應器市場預計到 2025 年將達到 7.2 億美元,年複合成長率為 24.1%,到 2035 年將達到 62.3 億美元。
隨著生物技術和食品技術公司不斷增強生物製造能力並加大對其他加工基礎設施的投資,市場展現出強勁的成長動能。對微發酵日益成長的需求正推動企業擴大產能,並加速新建和現有生物反應器設施的投資。隨著製造商尋求更有效率、擴充性的生產系統,生物反應器在整個工業發酵過程中變得愈發重要。因此,隨著企業升級現有設施和建立新的生產基地,採購活動也日益活躍。工業生物技術的廣泛發展以及對可控發酵環境日益成長的需求也推動了市場成長。生物反應器設計、製程可擴展性和製造基礎設施的進步為設備供應商創造了更多商機。隨著微發酵商業性應用的不斷發展,製造商正專注於能夠支援不斷成長的產量並保持穩定製程性能的設備。
| 市場範圍 | |
|---|---|
| 開始年份 | 2025 |
| 預測期 | 2026-2035 |
| 初始市場規模 | 7.2億美元 |
| 預計金額 | 62.3億美元 |
| 複合年成長率 | 24.1% |
預計到2025年,一次性生物反應器市佔率將達到40.7%,並在2035年之前以26.2%的複合年成長率成長。這兩大細分市場的佔有率接近,反映出微發酵生產環境中對高度柔軟性的一次性系統和耐用可重複使用設備的持續需求。這些趨勢正在增強對工業微發酵生物反應器的需求,並為2035年之前的市場持續擴張創造有利條件。
預計到2025年,攪拌釜式反應器(STR)市佔率將達到53.8%,並在2035年之前以23.1%的複合年成長率成長。 STR系統的強勁地位反映了其在工業發酵製程中的重要性,以及其對可控和可擴展製程需求的適用性。預計在整個預測期內,精準發酵生產的持續擴張將支撐對基於STR的生物反應器系統的需求。
預計到2025年,亞太地區工業精密發酵生物反應器市佔率將達到25.1%,並在2035年之前以27.5%的複合年成長率成長。這一區域擴張的促進因素包括:中國主導加大對生物製造基礎設施的投資、印度精密發酵生態系統的發展以及新加坡監管環境的持續改善。這些發展正在強化區域生物製造環境,並刺激對發酵生產能力的投資。基礎設施建設的進步和人們對精密發酵日益成長的興趣,正在為整個亞太地區的生物反應器製造商創造更多商機。
目錄
第1章:調查方法
第2章執行摘要
第3章 行業洞察
- 產業生態系分析
- 影響價值鏈的因素
- 利潤率分析
- 中斷
- 未來展望
- 製造商
- 中斷
- 供應商情況
- 主要新聞和舉措
- 技術與創新展望
- 監理情勢
- 對產業的影響
- 促進因素
- 產業潛在風險與挑戰
- 機會
- 波特的分析
- PESTLE分析
- 價格分析
- 過去價格趨勢分析(2019-2024)
- 定價策略:按業務類型分類
- 貿易數據分析
- 進出口量及進口額趨勢
- 主要貿易路線及關稅的影響
- 人工智慧和生成式人工智慧對市場的影響
- 利用人工智慧改造現有經營模式
- 按細分市場分類的生成式人工智慧用例和部署藍圖
- 風險、限制和監管考量
- 目前分銷基礎設施和通路滲透情況
- 按地區與業態(現代零售與傳統零售)分類的通路覆蓋率
- 缺乏最後一公里基礎設施和不斷變化的管道
第4章 競爭情勢
- 介紹
- 企業市佔率分析
- 競爭定位矩陣
- 戰略展望矩陣
- 主要市場公司的競爭分析
- 主要進展
- 併購
- 夥伴關係和聯盟
- 新產品發布
- 業務拓展計劃
第5章 市場估算與預測:依產品類型分類,2022-2035年
- 一次性(用完即棄)生物反應器
- 不銹鋼(多用途)生物反應器
- 玻璃生物反應器
- 混合生物反應器
- 其他(灌注、膜、中空纖維)
第6章 市場規模估算與預測(2022-2035年)
- 實驗室/研究規模
- 中試規模
- 商業規模
第7章 市場估計與預測:依技術分類,2022-2035年
- 攪拌釜式反應器(STR)
- 波浪/振盪生物反應器
- 鼓泡柱生物反應器
- 氣升升式生物反應器
- 其他(中空纖維、膜、微流體系統)
第8章 市場估算與預測:依應用領域分類,2022-2035年
- 食品/飲料
- 替代蛋白
- 發酵衍生成分(非蛋白質)
- 機能性食品及營養保健品
- 製藥和生物技術
- 工業和化學
- 其他(農業、化妝品、研究)
第9章:預測:依地區分類,2022-2035年
- 北美洲
- 美國
- 加拿大
- 歐洲
- 德國
- 英國
- 法國
- 義大利
- 西班牙
- 亞太地區
- 中國
- 印度
- 日本
- 韓國
- 澳洲
- 拉丁美洲
- 巴西
- 墨西哥
- 阿根廷
- 中東和非洲
- UAE
- 沙烏地阿拉伯
- 南非
第10章:公司簡介
- 世界公司
- Thermo Fisher Scientific
- Sartorius AG
- Danaher Corporation
- Merck KGaA
- Eppendorf SE
- GEA Group
- Tetra Pak
- 當地公司
- ABEC Inc.
- DCI Inc./DCI-Biolafitte LLC
- ZETA USA
- TK Modular
- PBS Biotech Inc.
- Getinge AB
- Infors HT
- Bioengineering AG
- Donaldson Company
- 新興企業
- FermenteQ Innovations Inc.
- Sarvatek
- Bionet Engineering
- DCI Group
- Celltainer Biotech BV
The Global Industrial Precision Fermentation Bioreactors Market was valued at USD 720 million in 2025 and is estimated to grow at a CAGR of 24.1% to reach USD 6.23 billion by 2035.
The market is gaining significant traction as biotechnology and food technology companies increase their biomanufacturing capabilities and invest in additional processing infrastructure. Rising demand for precision fermentation is encouraging companies to expand production capacity and accelerate investments in both new and existing bioreactor facilities. As manufacturers seek more efficient and scalable production systems, bioreactors are becoming increasingly important across industrial fermentation operations. Procurement activity is consequently increasing as companies upgrade existing facilities and establish new production sites. The market is also benefiting from the broader development of industrial biotechnology and the growing need for controlled fermentation environments. Advances in bioreactor design, process scalability, and manufacturing infrastructure are creating additional opportunities for equipment suppliers. As commercial applications of precision fermentation continue to develop, manufacturers are focusing on equipment that can support growing production volumes while maintaining consistent process performance.
| Market Scope | |
|---|---|
| Start Year | 2025 |
| Forecast Year | 2026-2035 |
| Start Value | $720 Million |
| Forecast Value | $6.23 Billion |
| CAGR | 24.1% |
The single-use (disposable) bioreactors segment held a 40.7% share in 2025 and is forecast to grow at a CAGR of 26.2% through 2035. The close market shares of these two configurations reflect continued demand for both flexible disposable systems and durable multi-use equipment across precision fermentation production environments. These trends are strengthening demand for industrial precision fermentation bioreactors and creating favorable conditions for continued market expansion through 2035.
The stirred tank reactor (STR) segment captured a 53.8% share in 2025 and is forecast to grow at a CAGR of 23.1% through 2035. The strong position of STR systems reflects their importance in industrial fermentation operations and their suitability for controlled and scalable processing requirements. Continued expansion of precision fermentation production is expected to support demand for STR-based bioreactor systems throughout the forecast period.
Asia Pacific Industrial Precision Fermentation Bioreactors Market accounted for a 25.1% share in 2025 and is forecast to grow at a CAGR of 27.5% through 2035. Regional expansion is being supported by increasing state-backed investment in biomanufacturing infrastructure in China, the development of a growing precision fermentation ecosystem in India, and continued progress in regulatory infrastructure in Singapore. These developments are strengthening the regional biomanufacturing landscape and encouraging investment in fermentation production capabilities. Growing infrastructure development and increasing interest in precision fermentation are creating additional opportunities for bioreactor manufacturers throughout Asia Pacific.
Prominent companies operating in the global industrial precision fermentation bioreactors market include Sartorius AG, Danaher Corporation, ABEC Inc., Eppendorf SE, Thermo Fisher Scientific, GEA Group, Bioengineering AG, Merck KGaA, Getinge AB, Tetra Pak, ZETA USA, Celltainer Biotech BV, PBS Biotech Inc., Donaldson Company, DCI Group, Bionet Engineering, FermenteQ Innovations Inc., DCI Inc. / DCI-Biolafitte LLC, Infors HT, Sarvatek, and TK Modular. Companies in the global industrial precision fermentation bioreactors market are strengthening their positions through product innovation, capacity expansion, strategic partnerships, and broader technology portfolios. Manufacturers are developing bioreactor systems designed to support greater scalability, process flexibility, and operational efficiency. Companies are also expanding their manufacturing and service capabilities to address increasing demand from precision fermentation producers. Strategic collaborations with biotechnology companies and other industry participants are helping suppliers develop solutions aligned with evolving production requirements. Market participants are also focusing on both single-use and multi-use systems to serve different manufacturing preferences and facility configurations. Expansion into high-growth regions is another key strategy, particularly as biomanufacturing infrastructure develops across emerging markets. Companies are investing in research and development to improve bioreactor performance, process control, and integration capabilities. By expanding product offerings, strengthening customer relationships, and increasing regional reach, manufacturers are working to secure long-term opportunities in the rapidly expanding global industrial precision fermentation bioreactors market.
Table of Contents
Chapter 1 Research Methodology
- 1.1 Research approach
- 1.2 Quality Commitments
- 1.2.1 GMI AI policy & data integrity commitment
- 1.2.1.1 Source consistency protocol
- 1.2.1 GMI AI policy & data integrity commitment
- 1.3 Research Trail & Confidence Scoring
- 1.3.1 Research Trail Components
- 1.3.2 Scoring Components
- 1.4 Data Collection
- 1.4.1 Partial list of primary sources
- 1.5 Data mining sources
- 1.5.1 Paid sources
- 1.5.1.1 Sources, by region
- 1.5.1 Paid sources
- 1.6 Base estimates and calculations
- 1.6.1 Base year calculation for any one approach
- 1.7 Forecast model
- 1.7.1 Quantified market impact analysis
- 1.7.1.1 Mathematical impact of growth parameters on forecast
- 1.7.1 Quantified market impact analysis
- 1.8 Research transparency addendum
- 1.8.1 Source attribution framework
- 1.8.2 Quality assurance metrics
- 1.8.3 Our commitment to trust
Chapter 2 Executive Summary
- 2.1 Industry 360° synopsis, 2022 – 2035
- 2.2 Key market trends
- 2.2.1 Regional
- 2.2.2 Product Type
- 2.2.3 Scale
- 2.2.4 Technology
- 2.2.5 Application
Chapter 3 Industry Insights
- 3.1 Industry ecosystem analysis
- 3.1.1 Factor affecting the value chain
- 3.1.2 Profit margin analysis
- 3.1.3 Disruptions
- 3.1.4 Future outlook
- 3.1.5 Manufacturers
- 3.1.6 Distributors
- 3.2 Supplier landscape
- 3.3 Key news & initiatives
- 3.4 Technology & Innovation Landscape
- 3.5 Regulatory landscape
- 3.6 Impact on forces
- 3.6.1 Growth drivers
- 3.6.2 Industry pitfalls & challenges
- 3.6.3 Opportunities
- 3.7 Porter’s analysis
- 3.8 PESTEL analysis
- 3.9 Pricing analysis (driven by primary research)
- 3.9.1 Historical Price Trend Analysis, 2019–2024 (Driven by Primary Research)
- 3.9.2 Pricing Strategy by Player Type (Driven by Primary Research)
- 3.10 Trade data analysis (driven by paid database)
- 3.10.1 Import/Export Volume & Value Trends (Driven by Primary Research)
- 3.10.2 Key Trade Corridors & Tariff Impact (Driven by Primary Research)
- 3.11 Impact of AI & Generative AI on the Market
- 3.11.1 AI-Driven Disruption of Existing Business Models
- 3.11.2 GenAI Use Cases & Adoption Roadmap by Segment
- 3.11.3 Risks, Limitations & Regulatory Considerations
- 3.12 Distribution Infrastructure & Channel Penetration Landscape (Driven by Primary Research)
- 3.12.1 Channel Coverage by Region & Format (Modern vs. Traditional Trade) (Driven by Primary Research)
- 3.12.2 Last-Mile Infrastructure Gaps & Emerging Channel Shifts (Driven by Primary Research)
Chapter 4 Competitive Landscape, 2025
- 4.1 Introduction
- 4.2 Company market share analysis
- 4.3 Competitive positioning matrix
- 4.4 Strategic outlook matrix
- 4.5 Competitive analysis of major market players
- 4.6 Key developments
- 4.6.1 Mergers & acquisitions
- 4.6.2 Partnerships & collaborations
- 4.6.3 New product launches
- 4.6.4 Expansion plans
Chapter 5 Market Estimates and Forecast, By Product Type, 2022 – 2035 ($ Million, Units)
- 5.1 Key trends
- 5.2 Single-Use (Disposable) Bioreactors
- 5.3 Stainless Steel (Multi-Use) Bioreactors
- 5.4 Glass Bioreactors
- 5.5 Hybrid Bioreactors
- 5.6 Others (Perfusion, Membrane, Hollow Fiber)
Chapter 6 Market Estimates and Forecast, By Scale, 2022 – 2035 ($ Million, Units)
- 6.1 Key trends
- 6.2 Laboratory / Research Scale
- 6.3 Pilot Scale
- 6.4 Commercial Scale
Chapter 7 Market Estimates and Forecast, By Technology, 2022 – 2035 ($ Million, Units)
- 7.1 Key trends
- 7.2 Stirred-Tank Reactor (STR)
- 7.3 Wave / Rocking Motion Bioreactors
- 7.4 Bubble Column Bioreactors
- 7.5 Airlift Bioreactors
- 7.6 Others (Hollow Fiber, Membrane, Microfluidic Systems)
Chapter 8 Market Estimates and Forecast, By Application, 2022 – 2035 ($ Million, Units)
- 8.1 Key trends
- 8.2 Food and Beverage
- 8.2.1 Alternative Proteins
- 8.2.2 Fermentation-Derived Ingredients (Non-Protein)
- 8.2.3 Functional Foods and Nutraceuticals
- 8.3 Pharmaceutical and Biotech
- 8.4 Industrial and Chemical
- 8.5 Others (Agriculture, Cosmetics, Research)
Chapter 9 Forecast, By Region, 2022 – 2035, (USD Million, Thousand Units)
- 9.1 Key trends
- 9.2 North America
- 9.2.1 U.S.
- 9.2.2 Canada
- 9.3 Europe
- 9.3.1 Germany
- 9.3.2 U.K.
- 9.3.3 France
- 9.3.4 Italy
- 9.3.5 Spain
- 9.4 Asia Pacific
- 9.4.1 China
- 9.4.2 India
- 9.4.3 Japan
- 9.4.4 South Korea
- 9.4.5 Australia
- 9.5 Latin America
- 9.5.1 Brazil
- 9.5.2 Mexico
- 9.5.3 Argentina
- 9.6 MEA
- 9.6.1 UAE
- 9.6.2 Saudi Arabia
- 9.6.3 South Africa
Chapter 10 Company Profiles
- 10.1 Global players
- 10.1.1 Thermo Fisher Scientific
- 10.1.2 Sartorius AG
- 10.1.3 Danaher Corporation
- 10.1.4 Merck KGaA
- 10.1.5 Eppendorf SE
- 10.1.6 GEA Group
- 10.1.7 Tetra Pak
- 10.2 Regional players
- 10.2.1 ABEC Inc.
- 10.2.2 DCI Inc. / DCI-Biolafitte LLC
- 10.2.3 ZETA USA
- 10.2.4 TK Modular
- 10.2.5 PBS Biotech Inc.
- 10.2.6 Getinge AB
- 10.2.7 Infors HT
- 10.2.8 Bioengineering AG
- 10.2.9 Donaldson Company
- 10.3 Emerging players
- 10.3.1 FermenteQ Innovations Inc.
- 10.3.2 Sarvatek
- 10.3.3 Bionet Engineering
- 10.3.4 DCI Group
- 10.3.5 Celltainer Biotech BV

 小型生物反應器市場:依生物反應器容量、細胞培養類型、運作方法、生物反應器類型、最終用戶、運作規模和地區分類-趨勢與預測至2035年
 生物反應器市場:按類型、組件、運作模式、類別、容量、結構材料、控制方法、應用和最終用戶分類-2026-2032年全球市場預測
 2026-2030年全球生物反應器市場全球小規模生物反應器市場:產業趨勢及至2035年預測:按生物反應器容量、細胞培養類型、運作、生物反應器類型、最終用戶、運作規模、地區和主要參與者細分
 生物反應器市場規模、佔有率、趨勢和預測:按類型、用途、規模、控制類型和地區分類,2026-2034年
 可重複使用生物反應器市場機會、成長要素、產業趨勢分析及2026-2035年預測
 生物反應器市場:按生物反應器類型、應用、容量、最終用戶和地區分類
 2026年全球一次性生物反應器袋市場報告2026年全球大表面積微載體生物反應器市場報告2026年全球奈米生物反應器市場報告