


 |
市場調查報告書
商品編碼
2109271
抽油機市場機會、成長促進因素、產業趨勢分析及2026-2035年預測Pumpjacks Market Opportunity, Growth Drivers, Industry Trend Analysis, and Forecast 2026 - 2035 |
||||||

預計到 2025 年,全球抽油機市場價值將達到 37 億美元,年複合成長率為 5.3%,到 2035 年將達到 63 億美元。
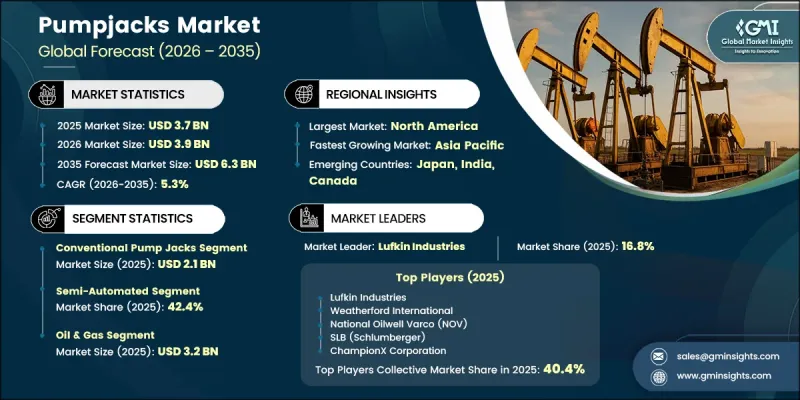
隨著油氣生產商致力於維持成熟陸上油井的產量,對人工採油基礎設施的持續投資正在推動市場成長。隨著儲存壓力隨時間推移而下降,營運商越來越依賴可靠的機械抽油系統來維持商業性可行的產量水平,並最大限度地延長現有資產的運作。抽油機因其性能可靠、成本效益高和使用壽命長,仍是中低產量油井最廣泛採用的人工採油技術之一。隨著各公司努力提高生產效率並控制營運成本,對設備現代化和升級的持續投資進一步促進了市場擴張。成熟油田活動的活性化持續創造對先進抽油設備的穩定需求,從而強化了整個產業的穩定採購趨勢。此外,提高設備耐久性、運作效率和監測能力的技術進步正在推動最新抽油機系統的更廣泛應用,從而增強了抽油機市場的長期前景。
| 市場範圍 | |
|---|---|
| 開始年份 | 2025 |
| 預測期 | 2026-2035 |
| 初始市場規模 | 37億美元 |
| 預測金額 | 63億美元 |
| 複合年成長率 | 5.3% |
預計2025年,傳統抽油機市場銷售額將達21億美元。其強大的市場地位得益於在全部區域的廣泛部署以及完善的服務和維護網路。傳統抽油機系統因其機械結構簡單、運作可靠以及能夠在各種井況下高效運作而廣泛應用。其易於維護和性能可靠,使其成為那些對操作便利性和設備耐用性要求極高的場所的理想選擇。
到2025年,半自動化油田將佔據42.4%的市場佔有率,並創造16億美元的收入。隨著營運商擴大採用部分自動化技術來改善生產監測並最佳化油井性能,而無需完全更換現有設備,半自動化油田將繼續引領市場成長。半自動化系統提供了一種經濟高效的解決方案,既能提高營運效率,又能延長運作中抽油機組的使用壽命,從而支持對成熟油田的持續投資。
到2025年,美國抽油機市場將佔據88.16%的市場佔有率,市場規模將達到14.1億美元。預計2026年至2035年,該市場將以4.7%的複合年成長率成長。美國憑藉其完善的陸上石油生產基礎設施和豐富的抽油系統經驗,鞏固了其市場主導地位。持續投資以維持現有油井的產量,以及不斷升級抽油設備,將支撐穩定的市場需求,並協助美國在區域產業中確立主導地位。
目錄
第1章:調查方法
第2章執行摘要
第3章 行業洞察
- 產業生態系分析
- 影響價值鏈的因素
- 利潤率分析
- 中斷
- 前景
- 製造商
- 中斷
- 供應商情況
- 主要新聞和舉措
- 技術與創新展望
- 監理情勢
- 對產業的影響
- 促進因素
- 隨著原油產量的增加,對抽油機設備的需求也上升。
- 成熟油井作業規模的擴大正在推動抽油機的應用。
- 能源需求的成長正在推動石油上游領域的投資。
- 產業潛在風險與挑戰
- 原油價格波動正在影響資本投資。
- 高昂的維護成本推高了營運費用。
- 機會
- 數位化監控提高了抽油機的運作性能。
- 自動化技術提升了智慧抽油機的運作效率。
- 促進因素
- 波特的分析
- PESTLE分析
- 價格分析
- 過去價格趨勢分析(2019-2024)
- 依球員類型分類的定價策略(高級球員、超值球員、成本加成球員)
- 依最終用途細分市場和油井類型分類的價格敏感度
- 貿易數據分析
- 抽油機設備進出口量和價值的趨勢。
- 主要貿易路線(美國-中東、中國-拉丁美洲、歐洲-獨立國協)及關稅的影響
- 人工智慧和生成式人工智慧對抽油機市場的影響
- 人工智慧改變了傳統的抽油機運作和維護模式。
- 針對特定領域的生成式人工智慧應用案例和實施藍圖(預測性維護、動態圖解釋、油井最佳化)
- 人工智慧在油田地面設施中的風險、限制和監管考量
- 生產能力和生產情況
- 按地區和主要生產國(北美、中東、亞太地區)分類的抽油機安裝數量
- 原始設備製造商的產能運轉率和擴張計劃
第4章 競爭情勢
- 介紹
- 企業市佔率分析
- 競爭定位矩陣
- 戰略展望矩陣
- 主要市場公司的競爭分析
- 主要進展
- 併購
- 夥伴關係和聯盟
- 新產品發布
- 業務拓展計劃
第5章 市場估算與預測:依泵浦類型分類,2022-2035年
- 傳統泵浦千斤頂
- 液壓千斤頂
- 電動幫浦千斤頂
- 其他
第6章 市場估計與預測:依營運區分,2022-2035年
- 手動的
- 半自動
- 自動化
第7章 市場估計與預測:依產能分類,2022-2035年
- 100桶/天或更少
- 100~500 bpd
- 500~1,000 bpd
- 1000桶/日或以上
第8章 市場估計與預測:依應用領域分類,2022-2035年
- 石油和天然氣
- 礦業
- 農業
- 其他
第9章 市場估價與預測:依通路分類,2022-2035年
- 直銷
- 間接銷售
第10章 市場估價與預測:依地區分類,2022-2035年
- 北美洲
- 美國
- 加拿大
- 歐洲
- 德國
- 英國
- 法國
- 義大利
- 西班牙
- 亞太地區
- 中國
- 印度
- 日本
- 韓國
- 澳洲
- 拉丁美洲
- 巴西
- 墨西哥
- 阿根廷
- 中東和非洲
- UAE
- 沙烏地阿拉伯
- 南非
第11章:公司簡介
- 世界公司
- Lufkin Industries
- Weatherford International
- National Oilwell Varco(NOV)
- SLB(Schlumberger)
- Baker Hughes
- Liberty Lift Solutions
- Unico, Inc.
- 本地公司
- Shengli Oilfield Highland Petroleum Equipment Co., Ltd.
- Sanjack Petro
- Puyang Zhongshi Group Co., Ltd.
- SEACO Oilfield Equipment Co., Ltd.
- Redhead Artificial Lift
- United Lift Technologies(ULT)
- BCP Group Artificial Lift, Inc.
- 新興企業
- IJACK Technologies Inc.
- SSi Artificial Lift
- Reynolds Lift Technologies
- Encline Artificial Lift Technologies LLC
- Air Lift Technology LLC
- JCPump LLC
- Paradigm Hydraulics
The Global Pumpjacks Market was valued at USD 3.7 billion in 2025 and is estimated to grow at a CAGR of 5.3% to reach USD 6.3 billion by 2035.
Market growth is driven by continued investment in artificial lift infrastructure as oil and gas producers focus on maintaining production from mature onshore wells. As reservoir pressure declines over time, operators increasingly rely on dependable mechanical lifting systems to sustain commercially viable production rates and maximize the operational life of existing assets. Pumpjacks remain one of the most widely adopted artificial lift technologies for low- and medium-production wells because they offer reliable performance, cost efficiency, and long service life. Ongoing investments in equipment modernization and replacement programs are further supporting market expansion as companies seek to improve production efficiency while controlling operating expenses. Growing activity across mature oilfields continues to generate steady demand for advanced lifting equipment, reinforcing stable procurement trends throughout the industry. In addition, technological improvements that enhance equipment durability, operational efficiency, and monitoring capabilities are encouraging broader adoption of modern pumpjack systems, strengthening the long-term outlook for the Pumpjacks Market.
| Market Scope | |
|---|---|
| Start Year | 2025 |
| Forecast Year | 2026-2035 |
| Start Value | $3.7 Billion |
| Forecast Value | $6.3 Billion |
| CAGR | 5.3% |
The conventional pump jack segment generated USD 2.1 billion in 2025. Its strong market presence is supported by an extensive installed base across onshore oil-producing regions and a well-developed service and maintenance ecosystem. Conventional beam pump systems continue to be widely adopted because of their straightforward mechanical design, dependable operation, and ability to perform efficiently under a broad range of well conditions. Their ease of maintenance and reliable performance make them particularly suitable for locations where operational simplicity and equipment durability are critical.
The semi-automated segment accounted for 42.4% share in 2025, generating USD 1.6 billion. This segment continues to lead the market as operators increasingly adopt partial automation technologies that improve production monitoring and optimize well performance without requiring complete replacement of existing equipment. Semi-automated systems provide a cost-effective solution for enhancing operational efficiency while extending the usefulness of installed pumpjack fleets, supporting continued investment across mature oilfields.
United States Pumpjacks Market accounted for 88.16% share in 2025, generating USD 1.41 billion, and is expected to grow at a CAGR of 4.7% between 2026 and 2035. The country's market leadership is supported by its extensive onshore oil production infrastructure and substantial installed base of artificial lift systems. Continuous investment in maintaining production from existing wells, along with ongoing upgrades to artificial lift equipment, continues to support stable market demand and reinforces the country's leading position within the regional industry.
Key companies operating in the global pumpjacks market include Lufkin Industries, Weatherford International, National Oilwell Varco (NOV), SLB (Schlumberger), Baker Hughes, Liberty Lift Solutions, Unico, Inc., Shengli Oilfield Highland Petroleum Equipment Co., Ltd., Sanjack Petro, Puyang Zhongshi Group Co., Ltd., SEACO Oilfield Equipment Co., Ltd., Redhead Artificial Lift, United Lift Technologies (ULT), BCP Group Artificial Lift, Inc., IJACK Technologies Inc., SSi Artificial Lift, Reynolds Lift Technologies, Encline Artificial Lift Technologies LLC, Air Lift Technology LLC, JCPump LLC, and Paradigm Hydraulics. Companies operating in the global pumpjacks market are strengthening their competitive position by investing in product innovation, expanding artificial lift portfolios, and improving equipment reliability and operational efficiency. Manufacturers are focusing on research and development to enhance system durability, reduce maintenance requirements, and improve production performance across mature oilfields. Strategic partnerships with oil and gas operators, distributors, and service providers are helping companies expand their customer base and strengthen regional market presence. Businesses are also increasing investments in manufacturing capabilities, aftermarket services, and technical support to improve customer satisfaction and long-term retention.
Table of Contents
Chapter 1 Research Methodology
- 1.1 Research approach
- 1.2 Quality Commitments
- 1.2.1 GMI AI policy & data integrity commitment
- 1.2.1.1 Source consistency protocol
- 1.2.1 GMI AI policy & data integrity commitment
- 1.3 Research Trail & Confidence Scoring
- 1.3.1 Research Trail Components
- 1.3.2 Scoring Components
- 1.4 Data Collection
- 1.4.1 Partial list of primary sources
- 1.5 Data mining sources
- 1.5.1 Paid sources
- 1.5.1.1 Sources, by region
- 1.5.1 Paid sources
- 1.6 Base estimates and calculations
- 1.6.1 Base year calculation for any one approach
- 1.7 Forecast model
- 1.7.1 Quantified market impact analysis
- 1.7.1.1 Mathematical impact of growth parameters on forecast
- 1.7.1 Quantified market impact analysis
- 1.8 Research transparency addendum
- 1.8.1 Source attribution framework
- 1.8.2 Quality assurance metrics
- 1.8.3 Our commitment to trust
Chapter 2 Executive Summary
- 2.1 Industry 360° synopsis, 2022 – 2035
- 2.2 Key market trends
- 2.2.1 Regional
- 2.2.2 Pump Type
- 2.2.3 Operations
- 2.2.4 Capacity
- 2.2.5 Application
- 2.2.6 Distribution Channel
Chapter 3 Industry Insights
- 3.1 Industry ecosystem analysis
- 3.1.1 Factor affecting the value chain
- 3.1.2 Profit margin analysis
- 3.1.3 Disruptions
- 3.1.4 Future outlook
- 3.1.5 Manufacturers
- 3.1.6 Distributors
- 3.2 Supplier landscape
- 3.3 Key news & initiatives
- 3.4 Technology & innovation landscape
- 3.5 Regulatory landscape
- 3.6 Impact on forces
- 3.6.1 Growth drivers
- 3.6.1.1 Rising oil production increases pumpjack equipment demand
- 3.6.1.2 Growing mature well operations support pumpjack adoption
- 3.6.1.3 Increasing energy demand boosts upstream oil investments
- 3.6.2 Industry pitfalls & challenges
- 3.6.2.1 Volatile crude oil prices affect equipment investments
- 3.6.2.2 High maintenance costs increase operating expenses
- 3.6.3 Opportunities
- 3.6.3.1 Digital monitoring improves pumpjack operational performance
- 3.6.3.2 Automation technologies strengthen intelligent pumpjack operations
- 3.6.1 Growth drivers
- 3.7 Porter’s analysis
- 3.8 PESTEL analysis
- 3.9 Pricing analysis (driven by primary research)
- 3.9.1 Historical price trend analysis (2019–2024) (driven by primary research)
- 3.9.2 Pricing strategy by player type (premium / value / cost-plus) (driven by primary research)
- 3.9.3 Price sensitivity by end-use segment & well type
- 3.10 Trade data analysis (driven by paid database)
- 3.10.1 Import/export volume & value trends for pumpjack equipment (HS code 8413) (driven by paid database)
- 3.10.2 Key trade corridors (U.S.–Middle East, China–Latin America, Europe–CIS) & tariff impact (driven by paid database)
- 3.11 Impact of AI & generative AI on the pumpjacks market
- 3.11.1 AI-driven disruption of conventional pumpjack operations & maintenance models
- 3.11.2 GenAI use cases & adoption roadmap by segment (predictive maintenance, dynagraph interpretation, well optimization)
- 3.11.3 Risks, limitations & regulatory considerations for AI in oilfield surface equipment
- 3.12 Capacity & production landscape (driven by primary research)
- 3.12.1 Installed pumpjack base by region & key producer (North America, Middle East, Asia Pacific) (driven by primary research)
- 3.12.2 Manufacturing capacity utilization rates & expansion pipelines among OEMs (driven by primary research)
Chapter 4 Competitive Landscape, 2025
- 4.1 Introduction
- 4.2 Company market share analysis
- 4.3 Competitive positioning matrix
- 4.4 Strategic outlook matrix
- 4.5 Competitive analysis of major market players
- 4.6 Key developments
- 4.6.1 Mergers & acquisitions
- 4.6.2 Partnerships & collaborations
- 4.6.3 New product launches
- 4.6.4 Expansion plans
Chapter 5 Market Estimates & Forecast, By Pump Type, 2022-2035 (USD Billion) (Million Units)
- 5.1 Key trends
- 5.2 Conventional pump jacks
- 5.3 Hydraulic pump jacks
- 5.4 Electric pump jacks
- 5.5 Others
Chapter 6 Market Estimates & Forecast, By Operations, 2022-2035 (USD Billion) (Million Units)
- 6.1 Key trends
- 6.2 Manual
- 6.3 Semi-Automatic
- 6.4 Automated
Chapter 7 Market Estimates & Forecast, By Capacity, 2022-2035 (USD Billion) (Million Units)
- 7.1 Key trends
- 7.2 Up to 100 bpd
- 7.3 100–500 bpd
- 7.4 500–1,000 bpd
- 7.5 Above 1,000 bpd
Chapter 8 Market Estimates & Forecast, By Application, 2022-2035 (USD Billion) (Million Units)
- 8.1 Key trends
- 8.2 Oil & gas
- 8.3 Mining
- 8.4 Agriculture
- 8.5 Others
Chapter 9 Market Estimates & Forecast, By Distribution Channel, 2022-2035 (USD Billion) (Million Units)
- 9.1 Key trends
- 9.2 Direct sales
- 9.3 Indirect sales
Chapter 10 Market Estimates & Forecast, By Region, 2022 – 2035, (USD Billion) (Million Units)
- 10.1 Key trends
- 10.2 North America
- 10.2.1 U.S.
- 10.2.2 Canada
- 10.3 Europe
- 10.3.1 Germany
- 10.3.2 U.K.
- 10.3.3 France
- 10.3.4 Italy
- 10.3.5 Spain
- 10.4 Asia Pacific
- 10.4.1 China
- 10.4.2 India
- 10.4.3 Japan
- 10.4.4 South Korea
- 10.4.5 Australia
- 10.5 Latin America
- 10.5.1 Brazil
- 10.5.2 Mexico
- 10.5.3 Argentina
- 10.6 MEA
- 10.6.1 UAE
- 10.6.2 Saudi Arabia
- 10.6.3 South Africa
Chapter 11 Company Profiles
- 11.1 Global players
- 11.1.1 Lufkin Industries
- 11.1.2 Weatherford International
- 11.1.3 National Oilwell Varco (NOV)
- 11.1.4 SLB (Schlumberger)
- 11.1.5 Baker Hughes
- 11.1.6 Liberty Lift Solutions
- 11.1.7 Unico, Inc.
- 11.2 Regional players
- 11.2.1 Shengli Oilfield Highland Petroleum Equipment Co., Ltd.
- 11.2.2 Sanjack Petro
- 11.2.3 Puyang Zhongshi Group Co., Ltd.
- 11.2.4 SEACO Oilfield Equipment Co., Ltd.
- 11.2.5 Redhead Artificial Lift
- 11.2.6 United Lift Technologies (ULT)
- 11.2.7 BCP Group Artificial Lift, Inc.
- 11.3 Emerging players
- 11.3.1 IJACK Technologies Inc.
- 11.3.2 SSi Artificial Lift
- 11.3.3 Reynolds Lift Technologies
- 11.3.4 Encline Artificial Lift Technologies LLC
- 11.3.5 Air Lift Technology LLC
- 11.3.6 JCPump LLC
- 11.3.7 Paradigm Hydraulics


