

 |
市場調查報告書
商品編碼
2109243
互動式平板顯示器市場機會、成長促進因素、產業趨勢分析及2026-2035年預測Interactive Flat Panel Display Market Opportunity, Growth Drivers, Industry Trend Analysis, and Forecast 2026 - 2035 |
||||||

全球互動式平板顯示器市場預計到 2025 年將達到 140 億美元,年複合成長率為 7.4%,到 2035 年將達到 288 億美元。
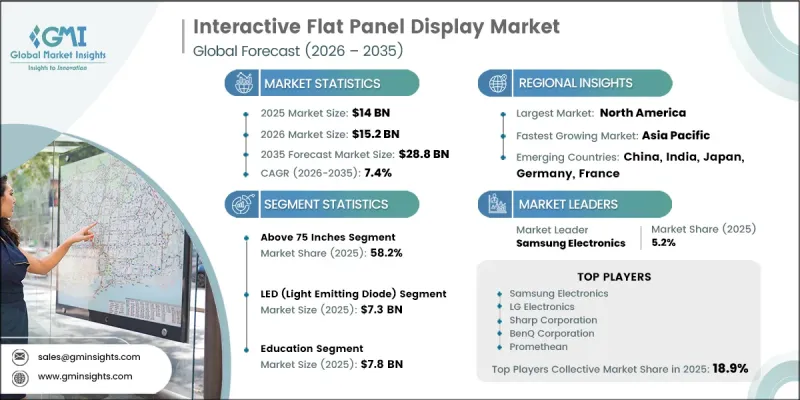
互動式平板顯示器產業正蓬勃發展,這主要得益於教育機構、企業和政府機構日益普及的數位轉型 (DX) 計畫。對智慧教室基礎設施的投資增加、對先進協作工具的需求不斷成長,以及人工智慧 (AI) 和雲端技術的融合,都在加速市場擴張。混合式學習和靈活辦公室模式的興起,進一步提升了對能夠實現無縫溝通和互動的互動式顯示解決方案的需求。顯示技術的不斷進步,以及人們對互聯協作環境日益成長的偏好,為市場創造了巨大的成長機會。各行各業的組織機構都在擴大採用互動式平板顯示器,以提高生產力、增強學習體驗並支援數位化協作。
| 市場範圍 | |
|---|---|
| 開始年份 | 2025 |
| 預測期 | 2026-2035 |
| 初始市場規模 | 140億美元 |
| 預測金額 | 288億美元 |
| 複合年成長率 | 7.4% |
政府加大對數位教育基礎設施和智慧教室建設的投入,顯著推動了互動式平板顯示器市場的擴張。主要經濟體的政府正優先發展技術驅動型教育體系,以提升數位技能、改進教學方法並擴大最新學習工具的普及範圍。這些措施正在推動學校、大學和培訓中心採用互動式顯示技術。在歐洲國家,政府主導的、以連網教室和協作學習環境為重點的數位教育計畫也在擴大其應用。對教室現代化、教育機構數位化以及教師培訓計畫的投入,正在提振對互動式平板顯示器的需求。
到2025年,75吋以上尺寸的顯示器將佔據58.2%的市場。在教室、禮堂和專業培訓中心等需要高視覺性的寬敞環境中,大型互動式顯示器越來越受歡迎。這些顯示器支援多用戶觸控和協作內容共用等高階互動功能,使其適用於大型群體。除了主要終端用戶數量的成長外,預計在預測期內,對數位化教育和混合辦公環境的投資增加也將進一步推動對大型互動式平板顯示器的需求。
預計到2025年,教育領域的市場規模將達到78億美元。由於學校、大學和職業培訓機構廣泛採用互動顯示螢幕,該領域保持了強勁的市場地位。智慧教室、數位學習平台的日益普及以及政府推行的混合式學習模式等項目,都為市場成長提供了支持。觸控協作、多媒體整合和即時內容共用等互動功能,正在提升學生的參與度,並創造更有效率的學習環境。隨著人們對科技主導教育的日益關注,教育機構正在加速推動以互動式數位解決方案取代傳統教學方法。
到2025年,北美互動式平板顯示器市佔率將達到35.5%。該地區市場的成長得益於對數位教育科技投資的增加、混合辦公解決方案的日益普及,以及各組織和公共機構對協作通訊平台的需求不斷成長。政府支持的數位轉型計畫、技術現代化支出的增加以及對雲端互動式顯示器的日益青睞,都促進了美國和加拿大市場滲透率的提升。鑑於該地區對互聯學習和改善職場協作的重視,預計對互動式平板顯示器解決方案的需求將保持強勁。
目錄
第1章:調查方法和範圍
第2章執行摘要
第3章 行業洞察
- 產業生態系分析
- 供應商情況
- 利潤率
- 成本結構
- 每個階段增加的價值
- 影響價值鏈的因素
- 中斷
- 影響產業的因素
- 促進因素
- 政府加大對數位教育基礎建設的投資
- 混合辦公和企業協作解決方案的普及應用日益廣泛
- 快速整合人工智慧驅動的協作平台與雲端平台
- 企業培訓和高等教育領域對互動式顯示設備的需求日益成長。
- 4K/8K、多點觸控和節能顯示技術的不斷進步。
- 產業潛在風險與挑戰
- 高昂的初始投資和實施成本
- 與傳統IT系統相容性和整合相關的挑戰
- 市場機遇
- 擴展人工智慧驅動的互動式顯示器和智慧協作解決方案
- 在新興市場,數位教育和智慧政府措施正在推動技術普及。
- 促進因素
- 成長潛力分析
- 監理情勢
- 波特的分析
- PESTLE分析
- 技術與創新展望
- 最新科技趨勢
- 新興技術
- 價格趨勢
- 按地區
- 依產品
- 定價策略
- 新興經營模式
- 合規要求
- 專利和智慧財產權分析
第4章 競爭情勢
- 介紹
- 企業市佔率分析
- 按地區
- 市場集中度分析
- 主要公司的競爭標竿分析
- 財務績效比較
- 收入
- 利潤率
- R&D
- 產品系列比較
- 產品線寬度
- 科技
- 創新
- 區域擴張比較
- 全球擴張分析
- 服務網路覆蓋
- 按地區分類的市場滲透率
- 競爭定位矩陣
- 領導者
- 挑戰者
- 追蹤者
- 小眾玩家
- 戰略展望矩陣
- 財務績效比較
- 主要進展
- 併購
- 夥伴關係和聯盟
- 技術進步
- 擴張和投資策略
- 數位轉型計劃
- 新興企業競爭公司和新創企業的趨勢
第5章 市場估價與預測:依螢幕尺寸分類,2022-2035年
- 小於 55 英寸
- 55-65英寸
- 65-75英寸
- 75吋或更大
第6章 市場估計與預測:依解析度分類,2022-2035年
- HD(1280 x 720)
- 全高清 (1920×1080)
- 4K UHD(3840 x 2160)
- 8K UHD(7680 x 4320)
第7章 市場估算與預測:Touch Technology公司,2022-2035年
- 紅外線的
- 電容式
- 光學
- 電磁學
- 其他
第8章 市場估算與預測:依顯示技術分類,2022-2035年
- LCD(液晶顯示器)
- LED(發光二極體)
- OLED(有機發光二極體)
- 其他
第9章 市場估計與預測:依作業系統分類,2022-2035年
- 基於安卓系統的IFPD
- 基於Windows的IFPD
- 雙系統(安卓+Windows)
- 其他
第10章 市場估價與預測:依最終用途分類,2022-2035年
- 教育
- 公司
- 衛生保健
- 零售
- 飯店業
- 其他
第11章 市場估價與預測:按地區分類,2022-2035年
- 北美洲
- 美國
- 加拿大
- 歐洲
- 德國
- 英國
- 法國
- 西班牙
- 義大利
- 亞太地區
- 中國
- 印度
- 日本
- 澳洲
- 韓國
- 拉丁美洲
- 巴西
- 墨西哥
- 阿根廷
- 中東和非洲
- 南非
- 沙烏地阿拉伯
- UAE
第12章:公司簡介
- 全球主要公司
- Samsung Electronics
- LG Electronics
- Sharp Corporation
- BenQ Corporation
- Promethean
- 該地區的主要公司
- 北美洲
- ViewSonic Corporation
- SMART Technologies
- Newline Interactive
- Boxlight Corporation
- Egan Teamboard
- 亞太地區
- Seewo(CVTE)
- Hitevision
- Huawei Technologies
- Hikvision
- Panasonic
- Ricoh Company
- Changhong Electric
- MAXHUB(CVTE/Comm-Works)
- Julong Educational Technology
- IQBoard(Returnstar)
- StarBoard
- 歐洲
- Avocor
- CleverTouch Technologies
- 北美洲
- 小眾玩家/顛覆者
- iFlytek
- Horion
The Global Interactive Flat Panel Display Market was valued at USD 14 billion in 2025 and is estimated to grow at a CAGR of 7.4% to reach USD 28.8 billion in 2035.
The growth of the interactive flat panel display industry is driven by the increasing adoption of digital transformation programs across educational institutions, corporate environments, and government facilities. Rising investments in smart classroom infrastructure, growing demand for advanced collaboration tools, and the integration of artificial intelligence and cloud-based technologies are accelerating market expansion. The shift toward hybrid learning and flexible workplace models is further increasing the need for interactive display solutions that enable seamless communication and engagement. Continuous advancements in display technologies, combined with the rising preference for connected and collaborative environments, are creating strong opportunities for market growth. Organizations across sectors are increasingly adopting interactive flat panel displays to improve productivity, enhance learning experiences, and support digital collaboration.
| Market Scope | |
|---|---|
| Start Year | 2025 |
| Forecast Year | 2026-2035 |
| Start Value | $14 Billion |
| Forecast Value | $28.8 Billion |
| CAGR | 7.4% |
Increasing government investment in digital education infrastructure and smart classroom development is significantly contributing to the expansion of the interactive flat panel display market. Governments across major economies are prioritizing technology-enabled education systems to improve digital skills, enhance teaching methods, and increase access to modern learning tools. These initiatives are encouraging schools, universities, and training centers to adopt interactive display technologies. European countries are also experiencing increased adoption due to government-backed digital education programs focused on connected classrooms and collaborative learning environments. Investments directed toward classroom modernization, institutional digitalization, and educator training programs are strengthening demand for interactive flat panel displays.
The above 75 inches segment accounted for 58.2% share in 2025. Large-format interactive displays are increasingly preferred for applications requiring enhanced visibility across spacious environments such as classrooms, auditoriums, and professional training facilities. These displays support advanced interactive capabilities, including multi-user touch functionality and collaborative content sharing, making them suitable for large-group engagement. Growing adoption among key end users, along with rising investments in digital education and hybrid work environments, is expected to further increase demand for large-sized interactive flat panel displays during the forecast period.
The education segment reached USD 7.8 billion in 2025. The segment maintained a strong market position due to extensive adoption of interactive displays across schools, universities, and professional training institutions. Increasing government programs focused on smart classroom implementation, digital learning platforms, and blended education models have supported market growth. Interactive features such as touch-based collaboration, multimedia integration, and real-time content sharing are improving student engagement and creating more effective learning environments. The growing emphasis on technology-driven education continues to encourage institutions to replace traditional teaching methods with interactive digital solutions.
North America Interactive Flat Panel Display Market accounted for a 35.5% share in 2025. The regional market is expanding due to increasing investments in digital education technologies, growing adoption of hybrid workplace solutions, and rising demand for collaborative communication platforms across organizations and public institutions. Government-supported digital transformation initiatives, increased spending on technology modernization, and greater preference for cloud-compatible interactive displays are contributing to stronger market penetration across the United States and Canada. The region's focus on improving connected learning and workplace collaboration environments is expected to sustain demand for interactive flat panel display solutions.
Prominent players operating in the global interactive flat panel display industry are Samsung Electronics, SMART Technologies, LG Electronics, ViewSonic Corporation, Avocor, Huawei Technologies, BenQ Corporation, Promethean (Mynd.ai), Sharp Corporation, Panasonic, Boxlight Corporation, Hikvision, Newline Interactive, Ricoh Company, CleverTouch Technologies, iFlytek, Hitevision, MAXHUB (CVTE/Comm-Works), Changhong Electric, Seewo (CVTE), IQBoard (Returnstar), Egan Teamboard, Horion, StarBoard, and Julong Educational Technology. Companies operating in the interactive flat panel display market are implementing strategies centered around product innovation, technological advancements, strategic partnerships, and expansion into emerging application areas to strengthen their market presence. Manufacturers are focusing on developing displays with improved touch accuracy, enhanced connectivity, artificial intelligence integration, and cloud collaboration capabilities to meet changing customer requirements. Companies are also expanding their product portfolios to serve education, corporate, and government sectors. Strategic collaborations with software providers and educational technology companies are helping businesses deliver complete digital solutions.
Table of Contents
Chapter 1 Methodology and Scope
- 1.1 Market scope and definition
- 1.2 Research design
- 1.2.1 Research approach
- 1.2.2 Data collection methods
- 1.3 Data mining sources
- 1.3.1 Global
- 1.3.2 Regional/Country
- 1.4 Base estimates and calculations
- 1.4.1 Base year calculation
- 1.4.2 Key trends for market estimation
- 1.5 Primary research and validation
- 1.5.1 Primary sources
- 1.6 Forecast model
- 1.7 Research assumptions and limitations
Chapter 2 Executive Summary
- 2.1 Industry 360° synopsis, 2022 - 2035
- 2.2 Key market trends
- 2.2.1 Screen size trends
- 2.2.2 Resolution trends
- 2.2.3 Touch technology trends
- 2.2.4 Display technology trends
- 2.2.5 Operating system trends
- 2.2.6 End-use trends
- 2.2.7 Regional trends
- 2.3 TAM Analysis, 2026-2035
- 2.4 CXO perspectives: Strategic imperatives
Chapter 3 Industry Insights
- 3.1 Industry ecosystem analysis
- 3.1.1 Supplier Landscape
- 3.1.2 Profit Margin
- 3.1.3 Cost structure
- 3.1.4 Value addition at each stage
- 3.1.5 Factor affecting the value chain
- 3.1.6 Disruptions
- 3.2 Industry impact forces
- 3.2.1 Growth drivers
- 3.2.1.1 Rising government investments in digital education infrastructure
- 3.2.1.2 Increasing adoption of hybrid work and enterprise collaboration solutions
- 3.2.1.3 Rapid integration of AI-enabled collaboration and cloud-based platforms
- 3.2.1.4 Growing demand for interactive displays in corporate training and higher education
- 3.2.1.5 Continuous advancements in 4K/8K, multi-touch, and energy-efficient display technologies
- 3.2.2 Industry pitfalls and challenges
- 3.2.2.1 High initial investment and installation costs
- 3.2.2.2 Compatibility and integration challenges with legacy IT systems
- 3.2.3 Market opportunities
- 3.2.3.1 Expansion of AI-powered interactive displays and smart collaboration solutions
- 3.2.3.2 Growing adoption in emerging markets through digital education and smart government initiatives
- 3.2.1 Growth drivers
- 3.3 Growth potential analysis
- 3.4 Regulatory landscape
- 3.4.1 North America
- 3.4.2 Europe
- 3.4.3 Asia Pacific
- 3.4.4 Latin America
- 3.4.5 Middle East & Africa
- 3.5 Porter's analysis
- 3.6 PESTEL analysis
- 3.7 Technology and Innovation landscape
- 3.7.1 Current technological trends
- 3.7.2 Emerging technologies
- 3.8 Price trends
- 3.8.1 By region
- 3.8.2 By product
- 3.9 Pricing Strategies
- 3.10 Emerging Business Models
- 3.11 Compliance Requirements
- 3.12 Patent and IP analysis
Chapter 4 Competitive Landscape, 2025
- 4.1 Introduction
- 4.2 Company market share analysis
- 4.2.1 By region
- 4.2.1.1 North America
- 4.2.1.2 Europe
- 4.2.1.3 Asia Pacific
- 4.2.1.4 Latin America
- 4.2.1.5 Middle East & Africa
- 4.2.2 Market concentration analysis
- 4.2.1 By region
- 4.3 Competitive benchmarking of key players
- 4.3.1 Financial performance comparison
- 4.3.1.1 Revenue
- 4.3.1.2 Profit margin
- 4.3.1.3 R&D
- 4.3.2 Product portfolio comparison
- 4.3.2.1 Product range breadth
- 4.3.2.2 Technology
- 4.3.2.3 Innovation
- 4.3.3 Geographic presence comparison
- 4.3.3.1 Global footprint analysis
- 4.3.3.2 Service network coverage
- 4.3.3.3 Market penetration by region
- 4.3.4 Competitive positioning matrix
- 4.3.4.1 Leaders
- 4.3.4.2 Challengers
- 4.3.4.3 Followers
- 4.3.4.4 Niche players
- 4.3.5 Strategic outlook matrix
- 4.3.1 Financial performance comparison
- 4.4 Key developments
- 4.4.1 Mergers and acquisitions
- 4.4.2 Partnerships and collaborations
- 4.4.3 Technological advancements
- 4.4.4 Expansion and investment strategies
- 4.4.5 Digital transformation initiatives
- 4.5 Emerging/ startup competitors landscape
Chapter 5 Market Estimates and Forecast, By Screen Size, 2022 - 2035 (USD Million)
- 5.1 Key trends
- 5.2 Below 55 inches
- 5.3 55 to 65 inches
- 5.4 65 to 75 inches
- 5.5 Above 75 inches
Chapter 6 Market Estimates and Forecast, By Resolution, 2022 - 2035 (USD Million)
- 6.1 Key trends
- 6.2 HD (1280 x 720)
- 6.3 Full HD (1920 x 1080)
- 6.4 4K UHD (3840 x 2160)
- 6.5 8K UHD (7680 x 4320)
Chapter 7 Market Estimates and Forecast, By Touch Technology, 2022 - 2035 (USD Million)
- 7.1 Key trends
- 7.2 Infrared
- 7.3 Capacitive
- 7.4 Optical
- 7.5 Electromagnetic
- 7.6 Others
Chapter 8 Market Estimates and Forecast, By Display Technology, 2022 - 2035 (USD Million)
- 8.1 Key trends
- 8.2 LCD (Liquid Crystal Display)
- 8.3 LED (Light Emitting Diode)
- 8.4 OLED (Organic Light Emitting Diode)
- 8.5 Others
Chapter 9 Market Estimates and Forecast, By Operating System, 2022 - 2035 (USD Million)
- 9.1 Key trends
- 9.2 Android-based IFPDs
- 9.3 Windows-based IFPDs
- 9.4 Dual OS (Android + Windows)
- 9.5 Others
Chapter 10 Market Estimates and Forecast, By End-Use, 2022 - 2035 (USD Million)
- 10.1 Key trends
- 10.2 Education
- 10.3 Corporate
- 10.4 Healthcare
- 10.5 Retail
- 10.6 Hospitality
- 10.7 Others
Chapter 11 Market Estimates and Forecast, By Region, 2022 - 2035 (USD Million)
- 11.1 Key trends
- 11.2 North America
- 11.2.1 U.S.
- 11.2.2 Canada
- 11.3 Europe
- 11.3.1 Germany
- 11.3.2 UK
- 11.3.3 France
- 11.3.4 Spain
- 11.3.5 Italy
- 11.4 Asia Pacific
- 11.4.1 China
- 11.4.2 India
- 11.4.3 Japan
- 11.4.4 Australia
- 11.4.5 South Korea
- 11.5 Latin America
- 11.5.1 Brazil
- 11.5.2 Mexico
- 11.5.3 Argentina
- 11.6 Middle East and Africa
- 11.6.1 South Africa
- 11.6.2 Saudi Arabia
- 11.6.3 UAE
Chapter 12 Company Profiles
- 12.1 Global Key Players
- 12.1.1 Samsung Electronics
- 12.1.2 LG Electronics
- 12.1.3 Sharp Corporation
- 12.1.4 BenQ Corporation
- 12.1.5 Promethean
- 12.2 Regional key players
- 12.2.1 North America
- 12.2.1.1 ViewSonic Corporation
- 12.2.1.2 SMART Technologies
- 12.2.1.3 Newline Interactive
- 12.2.1.4 Boxlight Corporation
- 12.2.1.5 Egan Teamboard
- 12.2.2 Asia Pacific
- 12.2.2.1 Seewo (CVTE)
- 12.2.2.2 Hitevision
- 12.2.2.3 Huawei Technologies
- 12.2.2.4 Hikvision
- 12.2.2.5 Panasonic
- 12.2.2.6 Ricoh Company
- 12.2.2.7 Changhong Electric
- 12.2.2.8 MAXHUB (CVTE/Comm-Works)
- 12.2.2.9 Julong Educational Technology
- 12.2.2.10 IQBoard (Returnstar)
- 12.2.2.11 StarBoard
- 12.2.3 Europe
- 12.2.3.1 Avocor
- 12.2.3.2 CleverTouch Technologies
- 12.2.1 North America
- 12.3 Niche Players/Disruptors
- 12.3.1 iFlytek
- 12.3.2 Horion

 平板顯示器市場:按技術、應用和地區分類
 2026年平面顯示器離子布植設備全球市場報告
 平板顯示器市場報告:按技術、應用、行業和地區分類(2026-2034 年)
 平面顯示器市場:按面板技術、螢幕大小、解析度、觸控介面和應用分類-2026-2032年全球市場預測全球海洋水族箱展示設備市場(依設備類型、價格範圍、應用、最終用戶和銷售管道分類),2026-2032年預測
 平板顯示器市場分析及預測(至2035年):依類型、產品類型、技術、組件、應用、材料類型、設備、最終用戶、安裝類型分類2026年全球平板顯示器市場報告
 教育科技互動式平板顯示器市場規模、佔有率及成長分析(按螢幕大小、技術、解析度、面板類型、連接方式、互動式技術和地區分類):產業預測(2026-2033 年)
 平板顯示器市場規模、佔有率及成長分析(按技術、應用、產業及地區分類)-2026-2033年產業預測
 平板顯示器市場:全球產業分析、市場規模、佔有率、成長、趨勢與未來預測(2025-2032)