

 |
市場調查報告書
商品編碼
2101983
功率氮化鎵裝置市場:商業機會、成長要素、產業趨勢分析及2026-2035年預測Power GaN Devices Market Opportunity, Growth Drivers, Industry Trend Analysis, and Forecast 2026 - 2035 |
||||||

預計到 2025 年,全球功率 GaN 裝置市場規模將達到 5.205 億美元,到 2035 年將以 27.9% 的複合年成長率成長至 65 億美元。
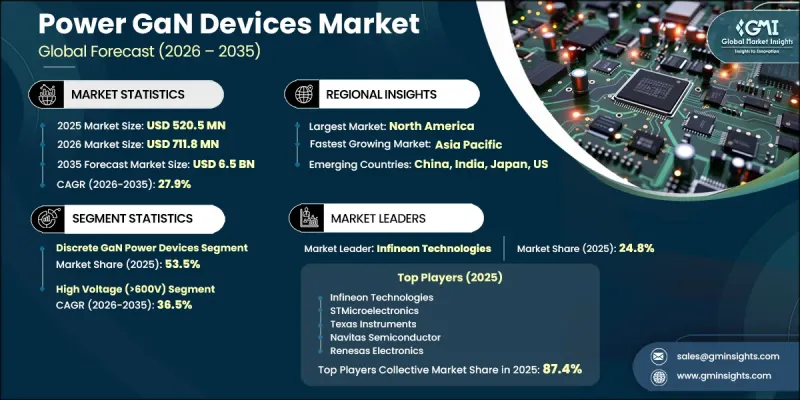
氮化鎵 (GaN) 相較於矽具有更優異的性能,這推動了該市場的成長。 GaN 的優點包括更高的電子遷移率、在相同晶片尺寸下更低的導通電阻以及更優異的高頻開關性能。這些優勢轉化為切實的系統級效益,例如更高的功率密度、更高的能源效率和更小的元件尺寸,從而推動了下一代緊湊型高性能電源系統的發展。基於 GaN 的裝置正在加速更高效的汽車充電器和更小的 DC-DC 轉換器系統的開發,支援汽車產業向更輕量化、更整合的電氣架構轉型。在家用電子電器領域,對超小型、高功率充電解決方案日益成長的需求進一步加速了 GaN 裝置的應用。儘管基於矽的解決方案難以同時滿足熱效率、功率密度和緊湊設計的綜合要求,但 GaN 裝置正成為許多行業的首選替代方案。在資料中心、可再生能源系統和工業電力電子領域的廣泛應用將推動長期需求,並加速全球功率半導體市場的技術更新換代。
| 市場範圍 | |
|---|---|
| 開始年份 | 2025 |
| 預測期 | 2026-2035 |
| 上市時的市場規模 | 5.205億美元 |
| 預測金額 | 65億美元 |
| 複合年成長率 | 27.9% |
預計到2025年,分離式功率GaN元件將佔53.5%的市場佔有率,展現其在多個應用領域的領先地位。該領域持續保持主導地位,主要得益於其在消費性充電設備、中低中功率工業系統以及早期電動車電源應用的廣泛應用。分離式GaN元件為工程師提供了更大的電路設計柔軟性,使其能夠在基板層級最佳化開關性能、散熱特性和功率效率。其適應性和易於整合的特性,使其成為從傳統矽基設計向GaN架構轉型企業的理想選擇。
預計到2025年,低壓(200V)和中壓(200V–600V)裝置將佔據40%的市場佔有率,市場規模將達到2億美元。這一市場分佈反映了氮化鎵(GaN)裝置在家用電子電器充電系統和工業電源應用的廣泛應用。低壓GaN裝置廣泛應用於小型充電系統和攜帶式電子產品,而中壓裝置在電源轉換、馬達驅動和汽車系統中的應用日益增加。隨著製造商在下一代電力電子產品中優先考慮更高的效率、更低的能量損耗和更緊湊的系統設計,這兩個類別的需求都在持續成長。
預計到2025年,北美功率氮化鎵(GaN)裝置市場規模將達到1.794億美元,並在2035年之前以25.5%的複合年成長率成長。這一成長主要得益於強大的半導體創新能力、電氣化基礎設施投資的不斷增加,以及汽車和工業領域對先進功率電子技術的日益普及。不斷擴大的化合物半導體製造能力和對下一代功率元件研發的持續投入,進一步推動了該地區的市場成長,並加速了終端用戶產業的應用。
目錄
第1章:調查方法和範圍
第2章執行摘要
第3章 行業洞察
- 產業生態系分析
- 影響產業的因素
- 促進因素
- 電動車(EV)的廣泛普及
- 支援快速充電的家用電器需求日益成長。
- 可再生能源系統的擴展
- 對節能型電力電子產品的需求日益成長
- 產業潛在風險與挑戰
- 高昂的製造和生產成本
- 供應鍊和原料限制
- 市場機遇
- 電動汽車電力電子技術的擴展
- 在資料中心和可再生能源領域中得到更廣泛的應用。
- 促進因素
- 成長潛力分析
- 監理情勢
- 技術展望
- 最新科技趨勢
- 新興技術
- 價格趨勢分析
- 未來市場趨勢
- 專利分析
- 波特的分析
- PESTLE分析
- 人工智慧和生成式人工智慧對市場的影響
- 價值鏈分析
- 投資與資金籌措分析
- 消費者洞察
第4章 競爭情勢
- 介紹
- 企業市佔率分析:按地區分類
- 北美洲
- 歐洲
- 亞太地區
- 中東和非洲
- 拉丁美洲
- 主要進展
- 重要合作夥伴關係和合作
- 主要併購活動
- 產品創新和新產品發布
- 市場擴大策略
- 競爭定位矩陣
第5章 市場規模及預測:依設備類型分類,2022-2035年
- 分離式功率氮化鎵裝置
- 氮化鎵整合功率積體電路
- 氮化鎵功率模組
第6章 市場規模與預測:依運行模式分類,2022-2035年
- 擴展模式
- 抑制模式(D 模式/常開)和級聯配置
第7章 市場規模及預測:依電壓範圍分類,2022-2035年
- 低電壓(低於200V)
- 中壓(200-650V)
- 高壓(超過650伏特)
第8章 市場規模及預測:依基板技術分類,2022-2035年
- GaN-on-Silicon(GaN-on-Si)
- 碳化矽基板上的氮化鎵(GaN-on-SiC)
- 原生氮化鎵(GaN-on-GaN)
- 其他
第9章 市場規模及預測:依應用領域分類,2022-2035年
- 電源轉接器、快速充電器
- 直流-直流轉換器
- 逆變器
- 馬達驅動裝置
- 無線電力傳輸(WPT)
- LiDAR和飛行時間系統
- 其他
第10章 市場規模及預測:依最終用途產業分類,2022-2035年
- 家用電子產品
- 汽車/電動車
- 資料中心和通訊基礎設施
- 工業自動化
- 航太/國防
- 醫療保健和醫療技術
第11章 市場規模及預測:依地區分類,2022-2035年
- 北美洲
- 美國
- 加拿大
- 歐洲
- 德國
- 法國
- 英國
- 荷蘭
- 西班牙
- 義大利
- 亞太地區
- 中國
- 日本
- 韓國
- 印度
- 澳洲
- 中東和非洲
- 沙烏地阿拉伯
- UAE
- 南非
- 拉丁美洲
- 巴西
- 阿根廷
- 墨西哥
第12章:公司簡介
- Infineon Technologies AG
- Navitas Semiconductor Corporation
- Efficient Power Conversion Corporation(EPC)
- Power Integrations, Inc.
- STMicroelectronics NV
- Texas Instruments Incorporated
- Renesas Electronics Corporation(incl. Transphorm)
- Innoscience Technology Co., Ltd.
- ROHM Co., Ltd.
- Mitsubishi Electric Corporation
- Panasonic Holdings Corporation
- Cambridge GaN Devices(CGD)
- NexGen Power Systems
- VisIC Technologies
- Odyssey Semiconductor Technologies
The Global Power GaN Devices Market was valued at USD 520.5 million in 2025 and is estimated to grow at a CAGR of 27.9% to reach USD 6.5 billion by 2035.
The market growth is driven by the superior performance characteristics of GaN compared to silicon, including higher electron mobility, reduced on-resistance at equivalent die sizes, and improved high-frequency switching capability. These advantages translate into measurable system-level benefits such as higher power density, improved energy efficiency, and reduced component size, enabling next-generation compact and high-performance power systems. GaN-based devices are increasingly enabling more efficient onboard chargers and smaller DC-DC conversion systems, supporting the automotive industry's shift toward lighter and more integrated electrical architectures. In consumer electronics, the growing demand for ultra-compact, high-wattage charging solutions is further accelerating adoption. As silicon-based solutions struggle to meet combined requirements for thermal efficiency, power density, and compact design, GaN devices are becoming a preferred alternative across multiple industries. Expanding use in data centers, renewable energy systems, and industrial power electronics is reinforcing long-term demand and accelerating technology substitution across the global power semiconductor landscape.
| Market Scope | |
|---|---|
| Start Year | 2025 |
| Forecast Year | 2026-2035 |
| Start Value | $520.5 Million |
| Forecast Value | $6.5 Billion |
| CAGR | 27.9% |
The discrete GaN power devices segment accounted for 53.5% share in 2025, highlighting its dominant position across multiple application areas. This segment continues to lead due to its widespread use in consumer charging devices, low to medium power industrial systems, and early-stage electric vehicle power applications. Discrete GaN components offer engineers greater flexibility in circuit design, enabling optimization of switching performance, thermal behavior, and power efficiency at the board level. Their adaptability and ease of integration make them a preferred choice for companies transitioning from traditional silicon-based designs to GaN-enabled architectures.
The low-voltage (200V) and medium-voltage (200V-600V) segment held 40% share in 2025 generating USD 200 million. This distribution reflects strong adoption across both consumer electronics charging systems and industrial power supply applications. Low-voltage GaN devices are widely used in compact charging systems and portable electronics, while medium-voltage devices are increasingly applied in power conversion, motor drives, and automotive systems. Demand across both categories continues to grow as manufacturers prioritize higher efficiency, reduced energy loss, and compact system design in next-generation power electronics.
North America Power GaN Devices Market was valued at USD 179.4 million in 2025 and is projected to grow at a CAGR of 25.5% through 2035. The region's growth is supported by strong semiconductor innovation capabilities, rising investments in electrification infrastructure, and increasing adoption of advanced power electronics across automotive and industrial sectors. Expanding manufacturing capacity for compound semiconductor technologies and continued investment in next-generation power device development are further strengthening regional market growth and accelerating adoption across end-use industries.
Key companies operating in the Global Power GaN Devices Market include Navitas Semiconductor Corporation, Infineon Technologies AG, Efficient Power Conversion Corporation (EPC), STMicroelectronics N.V., Power Integrations, Inc., ROHM Co., Ltd., Texas Instruments Incorporated, Mitsubishi Electric Corporation, Renesas Electronics Corporation (including Transphorm), Innoscience Technology Co., Ltd., Panasonic Holdings Corporation, Cambridge GaN Devices (CGD), VisIC Technologies, NexGen Power Systems, and Odyssey Semiconductor Technologies. Companies operating in the power GaN devices market are strengthening their market position by focusing on device efficiency improvements, scaling production capabilities, and advancing GaN integration across diverse end-use applications. Manufacturers are investing heavily in research and development to enhance switching performance, thermal stability, and voltage handling capacity while reducing manufacturing costs. Strategic collaborations with automotive, consumer electronics, and industrial system manufacturers are enabling faster commercialization and broader adoption of GaN-based solutions. Firms are also expanding fabrication capacity and improving supply chain resilience to meet rising global demand.
Table of Contents
Chapter 1 Methodology & Scope
- 1.1 Research approach
- 1.2 Quality commitments
- 1.2.1 GMI AI policy & data integrity commitment
- 1.2.1.1 Source consistency protocol
- 1.2.1 GMI AI policy & data integrity commitment
- 1.3 Research trail & confidence scoring
- 1.3.1 Research trail components
- 1.3.2 Scoring components
- 1.4 Data collection
- 1.4.1 Partial list of primary sources
- 1.5 Data mining sources
- 1.5.1 Paid sources
- 1.5.1.1 Sources, by region
- 1.5.1 Paid sources
- 1.6 Base estimates and calculations
- 1.6.1 Base year calculation for any one approach
- 1.7 Market estimates & forecasts parameters
- 1.8 Forecast model
- 1.8.1 Quantified market impact analysis
- 1.8.1.1 Mathematical impact of growth parameters on forecast
- 1.8.1 Quantified market impact analysis
- 1.9 Research transparency addendum
- 1.9.1 Source attribution framework
- 1.9.2 Quality assurance metrics
- 1.9.3 Our commitment to trust
- 1.10 Market definitions
Chapter 2 Executive Summary
- 2.1 Industry synopsis, 2022 - 2035
- 2.1.1 Device Type trends
- 2.1.2 Operation Mode trends
- 2.1.3 Substrate Technology trends
- 2.1.4 Voltage Range trends
- 2.1.5 Application trends
- 2.1.6 Regional trends
Chapter 3 Industry Insights
- 3.1 Industry ecosystem analysis
- 3.2 Industry impact forces
- 3.2.1 Growth drivers
- 3.2.1.1 Rising Adoption of Electric Vehicles (EVs)
- 3.2.1.2 Increasing Demand for Fast-Charging Consumer Electronics
- 3.2.1.3 Expansion of Renewable Energy Systems
- 3.2.1.4 Growing Need for Energy-Efficient Power Electronics
- 3.2.2 Industry pitfalls and challenges
- 3.2.2.1 High Manufacturing and Production Costs
- 3.2.2.2 Supply Chain and Raw Material Constraints
- 3.2.3 Market opportunities
- 3.2.3.1 Expansion in Electric Vehicle Power Electronics
- 3.2.3.2 Growing Penetration in Data Centers and Renewable Energy Applications
- 3.2.1 Growth drivers
- 3.3 Growth potential analysis
- 3.4 Regulatory landscape (Driven by primary research)
- 3.4.1 North America
- 3.4.2 Europe
- 3.4.3 Asia Pacific
- 3.4.4 Latin America
- 3.4.5 MEA
- 3.5 Technology landscape
- 3.5.1 Current technological trends
- 3.5.2 Emerging technologies
- 3.6 Pricing trend analysis (Driven by primary research)
- 3.7 Future market trends
- 3.8 Patent analysis
- 3.9 Porter's analysis
- 3.10 PESTEL analysis
- 3.11 Impact of AI and Generative AI on the market (Driven by primary research)
- 3.12 Value chain analysis (Driven by primary research)
- 3.13 Investment & funding analysis (Driven by primary research)
- 3.14 Consumer insights (Driven by primary research)
Chapter 4 Competitive Landscape, 2025
- 4.1 Introduction
- 4.2 Company market share analysis, by region, 2025
- 4.2.1 North America
- 4.2.2 Europe
- 4.2.3 Asia Pacific
- 4.2.4 Middle East & Africa
- 4.2.5 Latin America
- 4.3 Key developments
- 4.3.1 Key partnerships & collaborations
- 4.3.2 Major M&A activities
- 4.3.3 Product innovations & launches
- 4.3.4 Market expansion strategies
- 4.4 Competitive positioning matrix
Chapter 5 Market Size and Forecast, By Device Type, 2022 - 2035 (USD Million)
- 5.1 Key trends
- 5.2 Discrete GaN Power Devices
- 5.3 Integrated GaN Power ICs
- 5.4 GaN Power Modules
Chapter 6 Market Size and Forecast, By Operation Mode, 2022 - 2035 (USD Million)
- 6.1 Key trends
- 6.2 Enhancement Mode
- 6.3 Depletion Mode (D-mode / Normally-On) & Cascode Configurations
Chapter 7 Market Size and Forecast, By Voltage Range, 2022 - 2035 (USD Million)
- 7.1 Key trends
- 7.2 Low Voltage (<200V)
- 7.3 Mid Voltage (200-650V)
- 7.4 High Voltage (>650V)
Chapter 8 Market Size and Forecast, By Substrate Technology, 2022 - 2035 (USD Million)
- 8.1 Key trends
- 8.2 GaN-on-Silicon (GaN-on-Si)
- 8.3 GaN-on-Silicon Carbide (GaN-on-SiC)
- 8.4 Native GaN (GaN-on-GaN)
- 8.5 Others
Chapter 9 Market Size and Forecast, By Application, 2022 - 2035 (USD Million)
- 9.1 Power Supplies, Adapters & Fast Chargers
- 9.2 DC/DC Converters
- 9.3 Inverters
- 9.4 Motor Drives
- 9.5 Wireless Power Transfer (WPT)
- 9.6 LiDAR & ToF Systems
- 9.7 Others
Chapter 10 Market Size and Forecast, By End-Use Industry, 2022 - 2035 (USD Million)
- 10.1 Consumer Electronics
- 10.2 Automotive & Electric Vehicles
- 10.3 Data Centers & Telecom InfrastructureData Centers & Telecom Infrastructure
- 10.4 Industrial Automation
- 10.5 Aerospace & Defense
- 10.6 Healthcare & MedTech
Chapter 11 Market Size and Forecast, By Region, 2022 - 2035 (USD Million)
- 11.1 Key trends
- 11.2 North America
- 11.2.1 U.S.
- 11.2.2 Canada
- 11.3 Europe
- 11.3.1 Germany
- 11.3.2 France
- 11.3.3 UK
- 11.3.4 Netherlands
- 11.3.5 Spain
- 11.3.6 Italy
- 11.4 Asia Pacific
- 11.4.1 China
- 11.4.2 Japan
- 11.4.3 South Korea
- 11.4.4 India
- 11.4.5 Australia
- 11.5 Middle East & Africa
- 11.5.1 Saudi Arabia
- 11.5.2 UAE
- 11.5.3 South Africa
- 11.6 Latin America
- 11.6.1 Brazil
- 11.6.2 Argentina
- 11.6.3 Mexico
Chapter 12 Company Profiles
- 12.1 Infineon Technologies AG
- 12.2 Navitas Semiconductor Corporation
- 12.3 Efficient Power Conversion Corporation (EPC)
- 12.4 Power Integrations, Inc.
- 12.5 STMicroelectronics N.V.
- 12.6 Texas Instruments Incorporated
- 12.7 Renesas Electronics Corporation (incl. Transphorm)
- 12.8 Innoscience Technology Co., Ltd.
- 12.9 ROHM Co., Ltd.
- 12.10 Mitsubishi Electric Corporation
- 12.11 Panasonic Holdings Corporation
- 12.12 Cambridge GaN Devices (CGD)
- 12.13 NexGen Power Systems
- 12.14 VisIC Technologies
- 12.15 Odyssey Semiconductor Technologies

 2026年全球氮化鎵(GaN)功率元件市場報告
 2026-2030年全球氮化鎵(GAN)功率半導體市場
 全球氮化鎵功率半導體市場:按元件類型、電壓、應用和最終用戶分類-市場規模、產業動態、機會分析和預測(2026-2035 年)
 全球氮化鎵(GaN)電力應用市場(2027-2037 年)用於功率和射頻電子裝置的寬能隙材料(GaN、SiC、Ga₂O₃)的進展氮化鎵 (GaN) 功率元件市場:全球產業分析、市場規模及佔有率和預測(2026-2033 年),按元件類型、電壓範圍、應用、產業、國家和地區分類
 氮化鎵功率元件市場預測至2034年-按元件類型、晶圓尺寸、電壓範圍、製造方法、最終用戶和地區分類的全球分析
 氮化鎵功率元件市場:2026-2032年全球市場預測(依元件類型、額定電壓、材料類型、晶圓尺寸、功率範圍、應用和最終用戶分類)
 氮化鎵功率元件市場規模、佔有率和成長分析:按元件類型、晶圓技術、電壓範圍、元件類型、應用、終端用戶產業和地區分類-2026-2033年產業預測
 氮化鎵功率元件市場報告:按元件類型、電壓範圍、應用、終端用戶產業和地區分類(2026-2034 年)