

 |
市場調查報告書
商品編碼
2101975
霧計算市場機會、成長要素、產業趨勢分析及2026-2035年預測Fog Computing Market Opportunity, Growth Drivers, Industry Trend Analysis, and Forecast 2026 - 2035 |
||||||

全球霧運算市場預計到 2025 年將達到 4.053 億美元,到 2035 年將以 16.4% 的複合年成長率成長,達到 18 億美元。
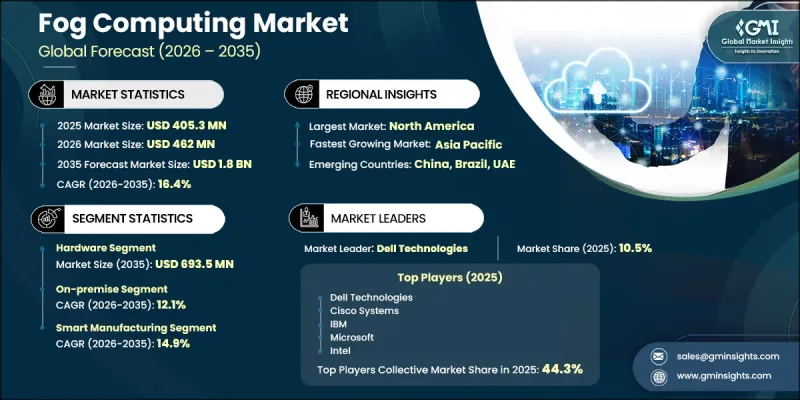
這種成長源於對超低延遲處理、更高頻寬效率以及更強大的本地資料管治的需求,尤其是在互聯環境中。隨著數位轉型加速,企業正擴大將運算工作負載遷移到更靠近資料來源的位置,以支援即時決策。工業自動化、自主系統、醫療監控和機器人等應用對反應時間的要求遠超集中式雲端模型所能持續提供。同時,5G 網路的擴展以及對超高可靠性、低延遲通訊 (URLC) 需求的不斷成長,進一步提升了邊緣運算層的重要性。此外,工業數位化正在將運算資源直接部署到工廠、公共產業和物流中心等營運環境。來自互聯感測器、機器視覺系統和智慧型裝置的資料激增,進一步增加了對本地處理的需求。透過減少向集中式雲端基礎設施的資料傳輸,企業可以降低延遲、最佳化成本並提高分散式網路的營運彈性。
| 市場範圍 | |
|---|---|
| 開始年份 | 2025 |
| 預測期 | 2026-2035 |
| 上市時的市場規模 | 4.053億美元 |
| 預測金額 | 18億美元 |
| 複合年成長率 | 16.4% |
預計到2025年,硬體業務的收入將達到1.883億美元。該業務包括邊緣伺服器、工業閘道器、嵌入式運算單元、網路基礎設施以及部署在資料來源附近的專用設備。這些元件構成了霧運算架構的基礎層,支援跨分散式環境的即時資料處理和本地決策。
本地部署市場規模達到 2.113 億美元,佔市場佔有率的 52.1%,預計到 2035 年將以 12.1% 的複合年成長率成長。這種部署模式在對資料管理和運作可靠性要求極高的產業中仍然廣泛應用,例如醫療保健、國防、金融服務和工業運作。尤其是在監管合規性、確定性效能和系統運作至關重要的環境中,這種模式更受青睞,因為它減少了對外部雲端基礎設施的依賴,並支援安全的本地處理。
預計到2035年,北美霧計算市場規模將達到7.787億美元,年複合成長率(CAGR)為16.8%,高於2025年的1.68億美元(佔全球市場的41.5%)。該地區的成長主要得益於對數位化基礎設施現代化建設的大力投資,以及一套系統化的網路安全和邊緣運算框架,該框架指導著各行業企業採用和部署霧運算技術的策略。
目錄
第1章:調查方法和範圍
第2章執行摘要
第3章 行業洞察
- 產業生態系分析
- 供應商情況
- 原物料供應商
- 零件供應商
- 製造商
- 服務供應商
- 分銷管道
- 最終用途
- 成本結構
- 利潤率
- 每個階段增加的價值
- 垂直整合趨勢
- 顛覆者
- 供應商情況
- 影響產業的因素
- 促進因素
- 物聯網設備和機器對機器通訊的快速擴展
- 對低延遲即時數據處理的需求日益成長
- 5G網路的快速部署將使邊緣分散式運算成為可能。
- 加速採用工業4.0和智慧製造技術
- 人們越來越關注資料隱私和本地處理。
- 市場限制因素
- 技術標準去中心化和互通性面臨的挑戰
- 實施和基礎設施成本高昂,尤其對於中小企業而言更是如此。
- 透過低成本、集中式雲端基礎設施展開競爭
- 市場機遇
- 霧運算與邊緣人工智慧/機器學習的融合
- 新興國家的智慧城市擴展計劃
- 自動駕駛汽車和V2X通訊網路的發展
- 霧運算即服務 (FaaS) 正在成為一種新的交付模式。
- 促進因素
- 成長潛力分析
- 價格分析
- 對過去價格趨勢的分析
- 依球員類型分類的定價策略(高級球員、超值球員、成本加成球員)
- 監理情勢
- 北美洲
- 美國-聯邦通訊委員會(FCC)、美國能源局(DOE)和美國國家標準與技術研究院(NIST)
- 加拿大 - 加拿大創新、科學和經濟發展部 (ISED) 和加拿大網路安全中心 (CCCS)
- 歐洲
- 英國—資訊專員辦公室 (ICO) 與科學、創新與技術部 (DSIT)
- 德國 - 聯邦資訊安全辦公室 (BSI)
- 法國 - 國家資訊處理與自由委員會 (CNIL)
- 歐盟(EU)-歐盟委員會(EC)和歐洲網路安全局(ENISA)
- 亞太地區
- 中國 - 中國國家網路資訊辦公室(網信辦)及工業及資訊化部(工信部)
- 印度 - 電子資訊技術部 (MeitY)
- 日本內務部
- 拉丁美洲
- 巴西 - 國家資料保護局 (ANPD)
- 中東和非洲
- 阿拉伯聯合大公國(阿拉伯聯合大公國)-通訊與數位政府監理局(TDRA)
- 北美洲
- 技術與創新展望
- 最新技術
- 新興技術
- 波特的分析
- PESTLE分析
- 專利分析
- 人工智慧和生成式人工智慧對市場的影響
- 利用人工智慧改造現有經營模式
- 設計自動化最佳化
- 用於需求預測的供應鏈人工智慧
- 按細分市場分類的生成式人工智慧用例和部署藍圖
- 風險、限制和監管考量
- 永續性和環境方面
- 永續計劃
- 減少廢棄物策略
- 生產中的能源效率
- 具有環保意識的舉措
- 考慮碳足跡
- 預測假設和情境分析
- 基本案例:驅動複合年成長率的關鍵宏觀經濟與產業變量
- 樂觀情境:宏觀經濟與產業的順風
- 悲觀情景:宏觀經濟放緩或產業逆風
第4章 競爭情勢
- 介紹
- 企業市佔率分析
- 北美洲
- 歐洲
- 亞太地區
- 拉丁美洲
- 中東和非洲
- 競爭定位矩陣
- 主要進展
- 併購
- 夥伴關係和聯盟
- 新產品發布
- 業務拓展計劃及資金籌措
- 按公司規模進行基準測試
- 排名分類標準與遴選標準
- 按銷售額、地區和創新能力分類的層級定位矩陣。
第5章 市場估計與預測:依組件分類,2022-2035年
- 硬體
- 邊緣閘道器
- 路由器和交換機
- 感測器和微型數據感測器
- IP視訊攝影機
- 工業用電腦和伺服器
- 軟體和平台
- 霧運算平台及中介軟體
- 編配與工作負載管理軟體
- 分析和人工智慧軟體
- 安全與合規軟體
- 服務
- 專業服務
- 託管服務
第6章 市場估算與預測:依部署模式分類,2022-2035年
- 現場
- 基於雲端的
- 混合
第7章 市場估計與預測:依應用領域分類,2022-2035年
- 智慧製造
- 智慧城市和建築自動化
- 互聯醫療
- 互聯車輛與交通
- 智慧型能源電網
- 安全和緊急應變系統
- 其他
第8章 市場估算與預測:依網路連結類型分類,2022-2035年
- 有線
- Ethernet
- 光纖
- 其他(同軸電纜、PLC、傳統工業協定)
- 無線的
- Wi-Fi(IEEE 802.11)
- 5G 和 4G LTE
- LPWAN(LoRa、Sigfox、NB-IoT)
- 短距離無線連線(藍牙、Zigbee)
- 其他
第9章 市場估計與預測:依產業分類,2022-2035年
- 製造業
- IT/通訊
- 醫療保健和生命科學
- BFSI
- 能源與公共產業
- 政府/國防
- 零售與電子商務
- 運輸/物流
- 其他
第10章 市場估價與預測:依地區分類,2022-2035年
- 北美洲
- 美國
- 加拿大
- 歐洲
- 英國
- 德國
- 法國
- 義大利
- 西班牙
- 比利時
- 荷蘭
- 瑞典
- 俄羅斯
- 亞太地區
- 中國
- 印度
- 日本
- 澳洲
- 新加坡
- 韓國
- 越南
- 印尼
- 泰國
- 拉丁美洲
- 巴西
- 墨西哥
- 阿根廷
- 中東和非洲
- 南非
- 沙烏地阿拉伯
- UAE
第11章:公司簡介
- 世界公司
- Cisco Systems
- Microsoft
- IBM
- Dell Technologies
- Intel
- Hewlett Packard Enterprise(HPE)
- Amazon Web Services(AWS)
- Siemens
- Schneider Electric
- Fujitsu
- 當地公司
- Advantech
- Nokia
- Ericsson
- NEC
- Kontron
- Moxa
- Eurotech
- Litmus Automation
- Wind River Systems
- ADLINK Technology
The Global Fog Computing Market was valued at USD 405.3 million in 2025 and is estimated to grow at a CAGR of 16.4% to reach USD 1.8 billion by 2035.
Growth is driven by the need for ultra-low latency processing, improved bandwidth efficiency, and stronger local data governance across connected environments. As digital transformation accelerates, enterprises are increasingly shifting compute workloads closer to data generation points to support real-time decision-making. Applications such as industrial automation, autonomous systems, healthcare monitoring, and robotics require response times that centralized cloud models cannot consistently deliver. At the same time, expanding 5G networks and ultra-reliable low-latency communication requirements are reinforcing the importance of edge-adjacent computing layers. Industrial digitalization initiatives are also pushing compute resources directly into operational environments such as factories, utilities, and logistics hubs. The rapid rise in data generated from connected sensors, machine vision systems, and smart devices is further increasing demand for localized processing. By reducing data transmission to centralized cloud infrastructure, organizations are lowering latency, optimizing costs, and improving operational resilience across distributed networks.
| Market Scope | |
|---|---|
| Start Year | 2025 |
| Forecast Year | 2026-2035 |
| Start Value | $405.3 Million |
| Forecast Value | $1.8 Billion |
| CAGR | 16.4% |
The hardware segment generated USD 188.3 million in 2025. This segment includes edge servers, industrial gateways, embedded computing units, networking infrastructure, and specialized appliances deployed close to data sources. These components form the foundational layer of fog architectures, enabling real-time data processing and localized decision-making across distributed environments.
The on-premise deployment segment reached USD 211.3 million, representing 52.1% share, and is projected to grow at a CAGR of 12.1% through 2035. This deployment model remains widely adopted in sectors requiring strict data control and high operational reliability, including healthcare, defense, financial services, and industrial operations. It is particularly favored in environments where regulatory compliance, deterministic performance, and system uptime are critical, as it reduces dependence on external cloud infrastructure and supports secure localized processing.
North America Fog Computing Market accounted for USD 168 million, representing 41.5% in 2025, and is projected to reach USD 778.7 million by 2035 at a CAGR of 16.8%. The region's growth is supported by strong investment in digital infrastructure modernization, along with structured cybersecurity and edge computing frameworks that guide enterprise adoption and deployment strategies across industries.
Major players operating in the global fog computing market include Microsoft, Amazon Web Services (AWS), Cisco Systems, Intel, IBM, Dell Technologies, Hewlett Packard Enterprise (HPE), Siemens, Schneider Electric, and Fujitsu. Companies in the fog computing market are focusing on strengthening edge-to-cloud integration capabilities to ensure seamless workload distribution across hybrid environments. Many vendors are investing in ruggedized and high-performance edge hardware designed for industrial-grade deployments. Strategic partnerships with telecom providers and cloud hyperscalers are helping expand ecosystem interoperability. Firms are also prioritizing development of unified orchestration platforms that simplify device management, security enforcement, and application deployment across distributed nodes. Increased investment in AI-enabled edge analytics is enhancing real-time decision-making capabilities.
Table of Contents
Chapter 1 Methodology & Scope
- 1.1 Research approach
- 1.2 Quality Commitments
- 1.2.1 GMI AI policy & data integrity commitment
- 1.2.1.1 Source consistency protocol
- 1.2.1 GMI AI policy & data integrity commitment
- 1.3 Research Trail & Confidence Scoring
- 1.3.1 Research Trail Components
- 1.3.2 Scoring Components
- 1.4 Data Collection
- 1.4.1 Partial list of primary sources
- 1.5 Data mining sources
- 1.5.1 Paid sources
- 1.5.1.1 Sources, by region
- 1.5.1 Paid sources
- 1.6 Base estimates and calculations
- 1.6.1 Base year calculation
- 1.7 Forecast
- 1.7.1 Quantified market impact analysis
- 1.7.1.1 Mathematical impact of growth parameters on forecast
- 1.7.1 Quantified market impact analysis
- 1.8 Research transparency addendum
- 1.8.1 Source attribution framework
- 1.8.2 Quality assurance metrics
- 1.8.3 Our commitment to trust
Chapter 2 Executive Summary
- 2.1 Industry 360° synopsis
- 2.2 Key market trends
- 2.2.1 Regional
- 2.2.2 Component
- 2.2.3 Deployment Model
- 2.2.4 Application
- 2.2.5 Industry Vertical
- 2.3 TAM Analysis, 2026-2035
- 2.4 CXO perspectives: Strategic imperatives
Chapter 3 Industry Insights
- 3.1 Industry ecosystem analysis
- 3.1.1 Supplier landscape
- 3.1.1.1 Raw material suppliers
- 3.1.1.2 Component suppliers
- 3.1.1.3 Manufacturers
- 3.1.1.4 Service providers
- 3.1.1.5 Distribution channel
- 3.1.1.6 End Use
- 3.1.2 Cost structure
- 3.1.3 Profit margin
- 3.1.4 Value addition at each stage
- 3.1.5 Vertical integration trends
- 3.1.6 Disruptors
- 3.1.1 Supplier landscape
- 3.2 Industry impact forces
- 3.2.1 Growth drivers
- 3.2.1.1 Exponential Growth of IoT Devices & M2M Communication
- 3.2.1.2 Rising Demand for Low-Latency Real-Time Data Processing
- 3.2.1.3 Rapid 5G Network Rollout Enabling Distributed Compute at the Edge
- 3.2.1.4 Accelerating Industry 4.0 & Smart Manufacturing Adoption
- 3.2.1.5 Increasing Focus on Data Privacy & Localized Processing
- 3.2.2 Market Restraints
- 3.2.2.1 Fragmented Technology Standards & Interoperability Challenges
- 3.2.2.2 High Implementation & Infrastructure Costs, Especially for SMEs
- 3.2.2.3 Competition from Low-Cost Centralized Cloud Infrastructure
- 3.2.3 Market Opportunities
- 3.2.3.1 Convergence of Fog Computing with Edge AI & ML
- 3.2.3.2 Smart City Expansion Programs in Emerging Economies
- 3.2.3.3 Growth of Autonomous Vehicles & V2X Communication Networks
- 3.2.3.4 Fog-as-a-Service (FaaS) Emergence as a New Delivery Model
- 3.2.1 Growth drivers
- 3.3 Growth potential analysis
- 3.4 Pricing Analysis (Driven by Primary Research)
- 3.4.1 Historical Price Trend Analysis
- 3.4.2 Pricing Strategy by Player Type (Premium / Value / Cost-plus)
- 3.5 Regulatory landscape
- 3.5.1 North America
- 3.5.1.1 United States - Federal Communications Commission (FCC), U.S. Department of Energy (DOE), and National Institute of Standards and Technology (NIST)
- 3.5.1.2 Canada - Innovation, Science and Economic Development Canada (ISED) and Canadian Centre for Cyber Security (CCCS)
- 3.5.2 Europe
- 3.5.2.1 United Kingdom - Information Commissioner's Office (ICO) and Department for Science, Innovation and Technology (DSIT)
- 3.5.2.2 Germany - Federal Office for Information Security (BSI)
- 3.5.2.3 France - National Commission on Informatics and Liberty (CNIL)
- 3.5.2.4 European Union - European Commission (EC) and European Union Agency for Cybersecurity (ENISA)
- 3.5.3 Asia-Pacific
- 3.5.3.1 China - Cyberspace Administration of China (CAC) and Ministry of Industry and Information Technology (MIIT)
- 3.5.3.2 India - Ministry of Electronics and Information Technology (MeitY)
- 3.5.3.3 Japan - Ministry of Internal Affairs and Communications (MIC)
- 3.5.4 Latin America
- 3.5.4.1 Brazil - National Data Protection Authority (ANPD)
- 3.5.5 Middle East & Africa
- 3.5.5.1 United Arab Emirates (UAE) - Telecommunications and Digital Government Regulatory Authority (TDRA)
- 3.5.1 North America
- 3.6 Technology and Innovation landscape
- 3.6.1 Current technologies
- 3.6.2 Emerging technologies
- 3.7 Porter's analysis
- 3.8 PESTEL analysis
- 3.9 Patent analysis (Driven by Primary Research)
- 3.10 Impact of AI & generative AI on the market
- 3.10.1 AI-Driven Disruption of Existing Business Models
- 3.10.2 Automated design optimization
- 3.10.3 Supply chain AI for demand forecasting
- 3.10.4 GenAI use cases & adoption roadmap by segment
- 3.10.5 Risks, Limitations & Regulatory Considerations
- 3.11 Sustainability and environmental aspects
- 3.11.1 Sustainable practices
- 3.11.2 Waste reduction strategies
- 3.11.3 Energy efficiency in production
- 3.11.4 Eco-friendly Initiatives
- 3.11.5 Carbon footprint considerations
- 3.12 Forecast assumptions & scenario analysis (Driven by Primary Research)
- 3.12.1 Base Case - key macro & industry variables driving CAGR
- 3.12.2 Optimistic Scenarios - Favorable Macro and Industry Tailwinds
- 3.12.3 Pessimistic Scenario - Macroeconomic slowdown or industry headwinds
Chapter 4 Competitive Landscape, 2025
- 4.1 Introduction
- 4.2 Company market share analysis
- 4.2.1 North America
- 4.2.2 Europe
- 4.2.3 Asia-Pacific
- 4.2.4 Latin America
- 4.2.5 Middle East & Africa
- 4.3 Competitive positioning matrix
- 4.4 Key developments
- 4.4.1 Mergers & acquisitions
- 4.4.2 Partnerships & collaborations
- 4.4.3 New product launches
- 4.4.4 Expansion plans and funding
- 4.5 Company tier benchmarking
- 4.5.1 Tier classification criteria & qualifying thresholds
- 4.5.2 Tier positioning matrix by revenue, geography & innovation
Chapter 5 Market Estimates & Forecast, By Component, 2022 - 2035 ($Mn)
- 5.1 Key trends
- 5.2 Hardware
- 5.2.1 Edge Gateways
- 5.2.2 Routers & Switches
- 5.2.3 Sensors & Micro Data Sensors
- 5.2.4 IP Video Cameras
- 5.2.5 Industrial PCs & Servers
- 5.3 Software & Platforms
- 5.3.1 Fog Computing Platforms & Middleware
- 5.3.2 Orchestration & Workload Management Software
- 5.3.3 Analytics & AI Software
- 5.3.4 Security & Compliance Software
- 5.4 Services
- 5.4.1 Professional Services
- 5.4.2 Managed Services
Chapter 6 Market Estimates & Forecast, By Deployment Model, 2022 - 2035 ($Mn)
- 6.1 Key trends
- 6.2 On-Premise
- 6.3 Cloud-Based
- 6.4 Hybrid
Chapter 7 Market Estimates & Forecast, By Application, 2022 - 2035 ($Mn)
- 7.1 Key trends
- 7.2 Smart Manufacturing
- 7.3 Smart Cities & Building Automation
- 7.4 Connected Healthcare
- 7.5 Connected Vehicles & Transportation
- 7.6 Smart Energy & Grids
- 7.7 Security & Emergency Systems
- 7.8 Others
Chapter 8 Market Estimates & Forecast, By Network Connectivity, 2022 - 2035 ($Mn)
- 8.1 Key trends
- 8.2 Wired
- 8.2.1 Ethernet
- 8.2.2 Fiber Optic
- 8.2.3 Others (Coaxial, PLC, Legacy Industrial Protocols)
- 8.3 Wireless
- 8.3.1 Wi-Fi (IEEE 802.11)
- 8.3.2 5G & 4G LTE
- 8.3.3 LPWAN (LoRa, Sigfox, NB-IoT)
- 8.3.4 Short-Range Wireless (Bluetooth, Zigbee)
- 8.3.5 Others
Chapter 9 Market Estimates & Forecast, By Industry Vertical, 2022 - 2035 ($Mn)
- 9.1 Key trends
- 9.2 Manufacturing
- 9.3 IT & Telecom
- 9.4 Healthcare & Life Sciences
- 9.5 BFSI
- 9.6 Energy & Utilities
- 9.7 Government & Defense
- 9.8 Retail & E-Commerce
- 9.9 Transportation & Logistics
- 9.10 Others
Chapter 10 Market Estimates & Forecast, By Region, 2022 - 2035 ($Mn)
- 10.1 North America
- 10.1.1 US
- 10.1.2 Canada
- 10.2 Europe
- 10.2.1 UK
- 10.2.2 Germany
- 10.2.3 France
- 10.2.4 Italy
- 10.2.5 Spain
- 10.2.6 Belgium
- 10.2.7 Netherlands
- 10.2.8 Sweden
- 10.2.9 Russia
- 10.3 Asia Pacific
- 10.3.1 China
- 10.3.2 India
- 10.3.3 Japan
- 10.3.4 Australia
- 10.3.5 Singapore
- 10.3.6 South Korea
- 10.3.7 Vietnam
- 10.3.8 Indonesia
- 10.3.9 Thailand
- 10.4 Latin America
- 10.4.1 Brazil
- 10.4.2 Mexico
- 10.4.3 Argentina
- 10.5 MEA
- 10.5.1 South Africa
- 10.5.2 Saudi Arabia
- 10.5.3 UAE
Chapter 11 Company Profiles
- 11.1 Global Players
- 11.1.1 Cisco Systems
- 11.1.2 Microsoft
- 11.1.3 IBM
- 11.1.4 Dell Technologies
- 11.1.5 Intel
- 11.1.6 Hewlett Packard Enterprise (HPE)
- 11.1.7 Amazon Web Services (AWS)
- 11.1.8 Siemens
- 11.1.9 Schneider Electric
- 11.1.10 Fujitsu
- 11.2 Regional Players
- 11.2.1 Advantech
- 11.2.2 Nokia
- 11.2.3 Ericsson
- 11.2.4 NEC
- 11.2.5 Kontron
- 11.2.6 Moxa
- 11.2.7 Eurotech
- 11.2.8 Litmus Automation
- 11.2.9 Wind River Systems
- 11.2.10 ADLINK Technology

 霧計算全球市場規模、佔有率、趨勢和成長分析報告(2026-2034)
 霧運算市場:全球市場預測,2026-2032年
 霧運算市場預測(2034 年)-按組件、部署模式、組織規模、應用、最終用戶和地區分類的全球分析
 霧運算市場規模、佔有率、趨勢和預測:按組件、部署模式、應用和地區分類,2026-2034 年
 2026年全球霧計算市場報告
 霧運算市場 - 全球產業規模、佔有率、趨勢、機會及預測(按組件、部署模式、應用、地區和競爭格局分類,2021-2031年)
 霧運算市場:2025-2029 年全球市場
 霧計算市場規模、佔有率、成長分析,按類型、應用、地區 - 產業預測,2024-2031 年