


 |
市場調查報告書
商品編碼
2101904
2026-2035 年低壓交流變頻器發電市場機會、成長要素、產業趨勢分析及預測。Power Generation Low Voltage AC Drives Market Opportunity, Growth Drivers, Industry Trend Analysis, and Forecast 2026 - 2035 |
||||||

全球低壓(LV)交流變頻器發電市場預計到 2025 年將達到 32 億美元,年複合成長率為 4.5%,到 2035 年將達到 50 億美元。
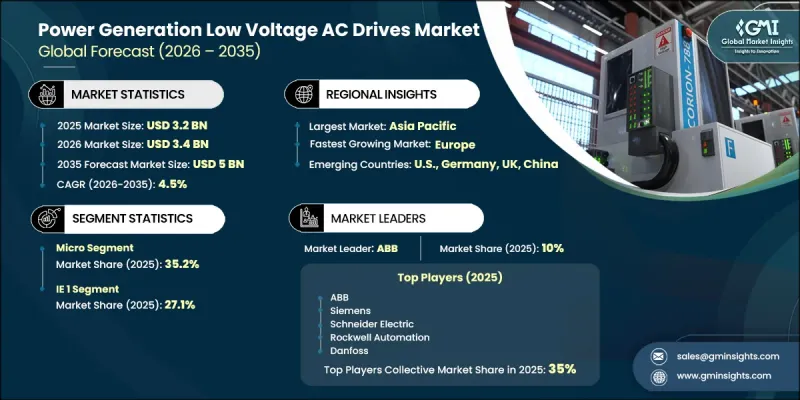
市場成長的驅動力來自公用事業公司、獨立發電企業和可再生能源開發商的持續投資,他們尋求改善馬達控制、提高運作效率並降低輔助能耗。全球發電能力的持續擴張,以及日益嚴格的能源效率標準,正在加速傳統和可再生能源發電發電廠對低壓交流變頻器的應用。變速馬達系統的日益普及有助於營運商減少能源損耗、提高設備性能並最佳化電廠可靠性。此外,對新建電廠投資的增加,也持續推動了對先進驅動系統的需求,以支援輔助設備的高效運作。電廠的數位轉型也推動了智慧低壓交流驅動器的應用,交流變頻器具備先進的通訊功能,能夠提升自動化、監控和預測性維護能力。隨著公用事業公司不斷對其發電資產進行現代化改造並擴展可再生能源基礎設施,預計在整個預測期內,對節能型低壓交流變頻器的需求將保持強勁。
| 市場範圍 | |
|---|---|
| 開始年份 | 2025 |
| 預測期 | 2026-2035 |
| 上市時的市場規模 | 32億美元 |
| 預計金額 | 50億美元 |
| 複合年成長率 | 4.5% |
預計到2025年,微型驅動器市佔率將達到35.2%,並在2035年之前以4.4%的複合年成長率成長。微型硬碟的額定輸出功率通常低於2.2千瓦,廣泛應用於緊湊型馬達應用中,為發電設施的輔助運作提供支援。由於低功率馬達系統在傳統和可再生能源發電發電廠的廣泛部署,該細分市場的需求保持穩定。在這些發電廠中,可靠的輔助設備在維持電廠的整體運作效率和可靠性方面發揮著至關重要的作用。
預計到2025年,IE1級馬達市佔率將達到27.1%。成長速度放緩反映出市場正逐步轉向高效率馬達技術,營運商正逐步用更節能的替代方案取代老舊系統。儘管IE1級馬達在對成本較為敏感的市場中仍能繼續運作,但更嚴格的能源效率法規和現代化改造正在穩步推動升級,從而導致對支援更高性能馬達技術的先進驅動解決方案的需求不斷成長。
預計到2025年,北美低壓交流交流變頻器市場將佔據21.3%的市場佔有率,並在2035年之前以4.2%的複合年成長率成長。該地區的成長主要得益於對發電基礎設施的持續投資、輸電網的現代化改造以及可再生能源發電裝置容量的不斷擴大。電力公司和發電企業正擴大採用節能驅動技術,以提高營運效率、最佳化輔助設備並降低能耗,這將支撐全部區域市場的長期成長。
目錄
第1章:調查方法和範圍
第2章執行摘要
第3章 行業洞察
- 產業生態系分析
- 零件可用性和採購分析
- 影響價值鏈的關鍵因素
- 中斷
- 影響產業的因素
- 促進因素
- 產業潛在風險與挑戰
- 成長潛力分析
- 監理情勢
- 波特的分析
- PESTLE分析
- 價格趨勢分析,2022-2035年
- 輸出範圍
- 按地區
- 新機會和趨勢
- 利用物聯網技術實現數位轉型
- 進入新興市場
- 投資分析及未來展望
- 人工智慧和生成式人工智慧對市場的影響
- 利用人工智慧最佳化生產
- 預測性維護和故障檢測
第4章 競爭情勢
- 介紹
- 企業市佔率分析
- 按地區
- 北美洲
- 歐洲
- 亞太地區
- 中東和非洲
- 拉丁美洲
- 市場集中度分析
- 按地區
- 主要市場公司的競爭分析
- 競爭定位矩陣
- 主要進展
- 併購
- 夥伴關係和聯盟
- 新產品發布
- 業務拓展計劃及資金籌措
- 按公司規模進行基準測試
- 排名分類標準與遴選標準
- 按銷售額、地區和創新能力分類的層級定位矩陣。
第5章 市場規模及預測:依產量範圍分類,2022-2035年
- 微輸出
- 低功率
第6章 市場規模及預測:依能源效率等級分類,2022-2035年
- IE1
- IE2
- IE3
- IE4
- 其他
第7章 市場規模及預測:依地區分類,2022-2035年
- 北美洲
- 美國
- 加拿大
- 墨西哥
- 歐洲
- 德國
- 英國
- 法國
- 義大利
- 西班牙
- 俄羅斯
- 丹麥
- 亞太地區
- 中國
- 日本
- 印度
- 澳洲
- 韓國
- 中東和非洲
- 沙烏地阿拉伯
- UAE
- 南非
- 拉丁美洲
- 巴西
- 阿根廷
第8章:公司簡介
- ABB
- Danfoss
- Delta Electronics
- Eaton
- Emotron
- FGI Science and Technology
- Fuji Electric
- GE Vernova
- Hitachi Hi-Rel Power Electronics
- Nidec
- OMRON
- PARKER HANNIFIN
- Rockwell Automation
- Schneider Electric
- Shanghai Nancal Electric
- Siemens
- TMEIC
- Toshiba International
- WEG
- Yaskawa Electric
The Global Power Generation Low Voltage (LV) AC Drives Market was valued at USD 3.2 billion in 2025 and is estimated to grow at a CAGR of 4.5% to reach USD 5 billion by 2035.
Market growth is driven by increasing investments from utilities, independent power producers, and renewable energy developers seeking improved motor control, enhanced operational efficiency, and lower auxiliary energy consumption. Continuous additions to global power generation capacity, combined with stricter energy efficiency standards, are accelerating the adoption of low voltage AC drives across both conventional and renewable power plants. The growing deployment of variable-speed motor systems is helping operators reduce energy losses, improve equipment performance, and optimize plant reliability. In addition, expanding investments in new power generation facilities are creating sustained demand for advanced drive systems that support efficient operation of auxiliary equipment. Digitalization across power generation facilities is also encouraging the integration of intelligent LV AC drives equipped with advanced communication capabilities that improve automation, monitoring, and predictive maintenance. As utilities continue modernizing generation assets and expanding renewable energy infrastructure, demand for energy-efficient low voltage AC drives is expected to remain strong throughout the forecast period.
| Market Scope | |
|---|---|
| Start Year | 2025 |
| Forecast Year | 2026-2035 |
| Start Value | $3.2 Billion |
| Forecast Value | $5 Billion |
| CAGR | 4.5% |
The micro drives segment accounted for 35.2% share in 2025 and is projected to grow at a CAGR of 4.4% through 2035. Micro drives, generally rated below 2.2 kW, are widely used in compact motor applications supporting auxiliary operations within power generation facilities. The segment maintains steady demand because of the extensive installed base of low-power motor systems across conventional and renewable energy plants, where dependable auxiliary equipment plays an essential role in maintaining overall operational efficiency and plant reliability.
The IE1 segment held a 27.1% share in 2025. The slower growth reflects the gradual transition toward higher-efficiency motor technologies as operators increasingly replace aging systems with more energy-efficient alternatives. While IE1 motors continue to remain in operation across cost-sensitive markets, tightening efficiency regulations and modernization initiatives are steadily encouraging upgrades, resulting in increasing demand for advanced drive solutions compatible with higher-performance motor technologies.
North America Power Generation Low Voltage (LV) AC Drives Market accounted for 21.3% share in 2025 and is projected to grow at a CAGR of 4.2% through 2035. Regional growth is supported by continuous investments in power generation infrastructure, grid modernization initiatives, and the ongoing expansion of renewable energy capacity. Utilities and power producers are increasingly deploying energy-efficient drive technologies to improve operational performance, optimize auxiliary equipment, and reduce energy consumption, supporting long-term market growth across the region.
Major companies operating in the global power generation low voltage (LV) AC drives market include Siemens, ABB, Schneider Electric, Danfoss, Rockwell Automation, Delta Electronics, and Nidec. Companies operating in the power generation low voltage (LV) AC drives market are strengthening their competitive position by investing in energy-efficient technologies, intelligent automation, and digitally connected drive solutions. Manufacturers are expanding their product portfolios with advanced drives featuring integrated diagnostics, predictive maintenance capabilities, and enhanced communication protocols to improve operational efficiency and system reliability. Strategic collaborations with utilities, engineering firms, and renewable energy developers are helping companies secure long-term infrastructure projects and broaden their market presence. Businesses are also increasing investments in research and development to enhance drive performance, simplify system integration, and support evolving industrial automation requirements.
Table of Contents
Chapter 1 Methodology & Scope
- 1.1 Research design
- 1.2 Quality commitment
- 1.2.1 GMI AI policy & data integrity commitment
- 1.2.1.1 Source consistency protocol
- 1.2.1 GMI AI policy & data integrity commitment
- 1.3 Research trail & confidence scoring
- 1.3.1 Research trail components
- 1.3.2 Scoring components
- 1.4 Data collection
- 1.4.1 Partial list of primary sources
- 1.5 Data mining sources
- 1.5.1 Paid sources
- 1.5.1.1 Sources, by region
- 1.5.1 Paid sources
- 1.6 Base estimates and calculations
- 1.6.1 Base year calculation for any one approach
- 1.7 Market estimates & forecasts parameters
- 1.8 Forecast model
- 1.8.1 Quantified market impact analysis
- 1.8.1.1 Mathematical impact of growth parameters on forecast
- 1.8.1 Quantified market impact analysis
- 1.9 Research transparency addendum
- 1.9.1 Source attribution framework
- 1.9.2 Quality assurance metrics
- 1.9.3 Our commitment to trust
- 1.10 Market definitions
Chapter 2 Executive Summary
- 2.1 Industry synopsis, 2022 - 2035
- 2.2 Business trends
- 2.3 Power range trends
- 2.4 Efficiency class trends
- 2.5 Regional trends
Chapter 3 Industry Insights
- 3.1 Industry ecosystem analysis
- 3.1.1 Component availability & sourcing analysis
- 3.1.2 Key factors affecting the value chain
- 3.1.3 Disruptions
- 3.2 Industry impact forces
- 3.2.1 Growth drivers
- 3.2.2 Industry pitfalls & challenges
- 3.3 Growth potential analysis
- 3.4 Regulatory landscape
- 3.5 Porter's analysis
- 3.5.1 Bargaining power of suppliers
- 3.5.2 Bargaining power of buyers
- 3.5.3 Threat of new entrants
- 3.5.4 Threat of substitutes
- 3.6 PESTEL analysis
- 3.6.1 Political factors
- 3.6.2 Economic factors
- 3.6.3 Social factors
- 3.6.4 Technological factors
- 3.6.5 Legal factors
- 3.6.6 Environmental factors
- 3.7 Price trend analysis, 2022-2035 (USD/Unit) (Driven by Primary Research)
- 3.7.1 By power range (Driven by Primary Research)
- 3.7.2 By region (Driven by Primary Research)
- 3.8 Emerging opportunities & trends
- 3.8.1 Digital transformation with IoT technologies
- 3.8.2 Emerging market penetration
- 3.9 Investment analysis & future outlook
- 3.10 Impact of AI & Generative AI on the market (Driven by Primary Research)
- 3.10.1 AI-Driven production optimization (Driven by Primary Research)
- 3.10.2 Predictive maintenance & fault detection (Driven by Primary Research)
Chapter 4 Competitive Landscape, 2026
- 4.1 Introduction
- 4.2 Company market share analysis, 2025
- 4.2.1 By region
- 4.2.1.1 North America
- 4.2.1.2 Europe
- 4.2.1.3 Asia Pacific
- 4.2.1.4 Middle East & Africa
- 4.2.1.5 Latin America
- 4.2.2 Market concentration analysis
- 4.2.1 By region
- 4.3 Competitive analysis of major market players
- 4.4 Competitive positioning matrix
- 4.5 Key developments
- 4.5.1 Mergers & acquisitions
- 4.5.2 Partnerships & collaborations
- 4.5.3 New product launches
- 4.5.4 Expansion plans & funding
- 4.6 Company tier benchmarking
- 4.6.1 Tier classification criteria & qualifying thresholds
- 4.6.2 Tier positioning matrix by revenue, geography & innovation
Chapter 5 Market Size and Forecast, By Power Range, 2022 - 2035 (USD Million, '000 Units)
- 5.1 Key trends
- 5.2 Micro
- 5.3 Low
Chapter 6 Market Size and Forecast, By Efficiency Class, 2022 - 2035 (USD Million, '000 Units)
- 6.1 Key trends
- 6.2 IE1
- 6.3 IE2
- 6.4 IE3
- 6.5 IE4
- 6.6 Others
Chapter 7 Market Size and Forecast, By Region, 2022 - 2035 (USD Million, '000 Units)
- 7.1 Key trends
- 7.2 North America
- 7.2.1 U.S.
- 7.2.2 Canada
- 7.2.3 Mexico
- 7.3 Europe
- 7.3.1 Germany
- 7.3.2 UK
- 7.3.3 France
- 7.3.4 Italy
- 7.3.5 Spain
- 7.3.6 Russia
- 7.3.7 Denmark
- 7.4 Asia Pacific
- 7.4.1 China
- 7.4.2 Japan
- 7.4.3 India
- 7.4.4 Australia
- 7.4.5 South Korea
- 7.5 Middle East & Africa
- 7.5.1 Saudi Arabia
- 7.5.2 UAE
- 7.5.3 South Africa
- 7.6 Latin America
- 7.6.1 Brazil
- 7.6.2 Argentina
Chapter 8 Company Profiles
- 8.1 ABB
- 8.2 Danfoss
- 8.3 Delta Electronics
- 8.4 Eaton
- 8.5 Emotron
- 8.6 FGI Science and Technology
- 8.7 Fuji Electric
- 8.8 GE Vernova
- 8.9 Hitachi Hi-Rel Power Electronics
- 8.10 Nidec
- 8.11 OMRON
- 8.12 PARKER HANNIFIN
- 8.13 Rockwell Automation
- 8.14 Schneider Electric
- 8.15 Shanghai Nancal Electric
- 8.16 Siemens
- 8.17 TMEIC
- 8.18 Toshiba International
- 8.19 WEG
- 8.20 Yaskawa Electric

 低壓馬達市場規模、佔有率和成長分析:按能源效率等級、馬達類型、應用、終端用戶產業和地區分類-2026-2033年產業預測
 低壓交流變頻器市場機會、成長要素、產業趨勢分析及2026-2035年預測
 低壓馬達市場:依馬達類型、類別、應用、終端用戶產業及通路分類-2026-2032年全球市場預測
 汽車低壓驅動裝置市場分析及預測(至2035年):按類型、產品類型、服務、技術、組件、應用、最終用戶、功能、安裝類型和模式分類
 2026年全球低壓馬達市場報告
 低壓交流驅動器市場規模、佔有率、成長及全球產業分析:依類型、應用和地區劃分的洞察與預測(2024-2032 年)
 全球汽車低壓驅動器市場
 全球汽車低壓驅動器市場:成長、未來展望與競爭分析(2024-2032 年)汽車低壓驅動市場機會、成長動力、產業趨勢分析與 2025 - 2034 年預測