


 |
市場調查報告書
商品編碼
2101902
智慧電梯市場機會、成長要素、產業趨勢分析及2026-2035年預測。Smart Elevator Market Opportunity, Growth Drivers, Industry Trend Analysis, and Forecast 2026 - 2035 |
||||||

全球智慧電梯市場預計到 2025 年將達到 268 億美元,年複合成長率為 8.4%,到 2035 年將達到 613 億美元。
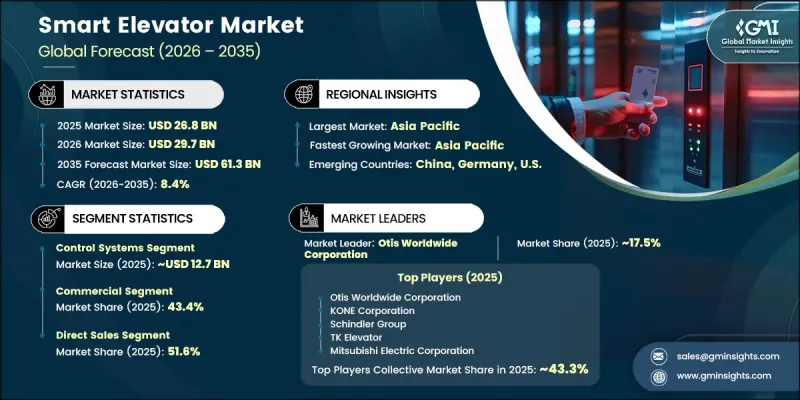
全球都市化加速和智慧城市基礎設施投資增加是推動市場成長的主要因素。新興國家和已開發大都會圈的人口成長以及高層建築的快速建設活動,持續推動智慧垂直交通系統的需求。開發商正日益將互聯電梯解決方案融入現代建築,作為更廣泛的智慧基礎設施生態系統的一部分。政府支持的大規模智慧城市計畫以及多邊組織的資金支持,進一步促進了住宅、商業和公共建築項目的長期部署。同時,物聯網框架、人工智慧和雲端分析技術的進步顯著提高了系統效率並降低了部署成本。現代智慧電梯擴大採用內建連接功能,從安裝之初即可實現即時監控、預測性維護和能源最佳化。這種轉變正在重塑電梯產業,使其從以硬體為中心的模式轉向以數據驅動、服務為導向的生態系統,從而在整個生命週期中支持長期營運效率和價值創造。
| 市場範圍 | |
|---|---|
| 開始年份 | 2025 |
| 預測期 | 2026-2035 |
| 上市時的市場規模 | 268億美元 |
| 預計金額 | 613億美元 |
| 複合年成長率 | 8.4% |
預計到2025年,控制系統市場規模將達到127億美元,並在2035年之前以7.8%的複合年成長率成長。該市場佔據主導地位,因為它在智慧電梯管理中發揮著至關重要的作用,包括最佳化乘客路線、客流管理、能源效率控制、預測維修系統以及雲端監控平台。這些技術能夠提高整體營運效率,同時減少多部電梯運作環境中的停機時間和能耗。
預計到2025年,商業領域將佔據43.4%的市場。這一主導地位得益於辦公大樓、零售中心、飯店、機場和交通樞紐等場所的高安裝密度。智慧電梯系統在商業基礎設施中廣泛應用,是因為它們能夠提升租戶體驗、降低營運成本,並支援符合現代永續性和性能標準的高效建築管理策略。
預計到2025年,北美智慧電梯市場規模將達到66億美元,並在2035年之前以8%的複合年成長率成長。該地區市場領先地位的促進因素包括商業房地產開發的活性化、舊電梯系統的大規模現代化改造,以及日益嚴格的監管要求(這些要求側重於能源效率、安全性和無障礙性)。美國仍然是該地區需求的主要驅動力,這得益於持續的基礎設施升級和智慧建築技術的廣泛應用。
目錄
第1章:調查方法和範圍
第2章執行摘要
第3章 行業洞察
- 產業生態系分析
- 供應商情況
- 影響價值鏈的因素
- 價值鏈各階段的利潤率分析
- 中斷
- 未來展望
- 影響產業的因素
- 促進因素
- 世界快速的都市化與高樓建設的增加
- 增加對智慧城市和智慧建築基礎設施的投資
- 擴大預測性維護的應用範圍,以減少運作。
- 潛在風險和挑戰
- 與傳統電梯相比,初始安裝和更換成本更高。
- 現有建築基礎設施面臨的複雜整合挑戰
- 機會
- 已開發國家老舊電梯設施的大規模現代化改造
- 智慧建築和建築管理系統生態系統的擴展,正在創造對整合解決方案的需求。
- 促進因素
- 成長潛力分析
- 未來市場趨勢
- 技術與創新展望
- 最新科技趨勢
- 新興技術
- 物聯網電梯系統
- 人工智慧與機器學習的融合
- 雲端運算和邊緣運算的採用
- 配送目的地規範技術的演變
- 再生驅動和能源回收系統
- 價格分析
- 對過去價格趨勢的分析
- 依球員類型分類的定價策略(高級球員、超值球員、成本加成球員)
- 監理情勢
- 建築安全標準與電梯標準(EN 81,ASME A17.1)
- 能源效率指示與綠建築認證(LEED、BREEAM)
- 互聯建築系統的網路安全法規
- 無障礙合規要求(ADA、歐洲無障礙法案)
- 貿易數據分析
- 主要貿易路線及關稅的影響
- 貿易政策與區域貿易協定的變化
- 供應鏈分析
- 原料和零件的採購
- 一級和二級供應商概覽
- 供應鏈風險評估與中斷情景
- 人工智慧和生成式人工智慧對市場的影響
- 利用人工智慧改造現有經營模式
- 按細分市場分類的生成式人工智慧用例和部署藍圖
- 風險、限制和監管考量
- 生產能力和生產情況
- 設備產能:按地區和主要生產商分類
- 運轉率和擴張計劃
- 波特五力分析
- PESTLE分析
第4章 競爭情勢
- 介紹
- 企業市佔率分析
- 按地區
- 企業矩陣分析
- 主要市場公司的競爭分析
- 競爭定位矩陣
- 主要進展
- 併購
- 夥伴關係和聯盟
- 新產品發布
- 業務拓展計劃
第5章 市場估計與預測:依組件分類,2022-2035年
- 控制系統
- 目的地調度系統
- 能源管理軟體
- 預測性維護演算法平台
- 驅動控制單元/變頻器(VFD)
- 維護系統
- 物聯網感測器和狀態監控模組
- 遠距離診斷平台
- 故障偵測和警報系統
- 通訊系統
- 物聯網連接模組(Wi-Fi、4G/5G、BLE)
- 基於雲端的資料傳輸基礎設施
- 建築管理系統(BMS)介面
- 遠端監控儀表板和分析門戶
第6章 市場估計與預測:依應用領域分類,2022-2035年
- 商業的
- 辦公大樓和企業園區
- 零售商場和購物中心
- 飯店及招待綜合體
- 機場和交通樞紐
- 住宅
- 多用戶住宅塔樓
- 豪華高層公寓
- 混合用途住宅綜合體
- 對機構而言
- 醫院和醫療設施
- 政府設施和公共基礎設施
- 教育機構和大學校園
- 產業
- 生產設施和倉庫
- 物流樞紐/配送中心
第7章 市場估價與預測:依通路分類,2022-2035年
- 直銷
- 間接銷售
第8章 市場估計與預測:依地區分類,2022-2035年
- 北美洲
- 美國
- 加拿大
- 歐洲
- 英國
- 德國
- 法國
- 義大利
- 西班牙
- 俄羅斯
- 亞太地區
- 中國
- 印度
- 日本
- 韓國
- 澳洲
- 拉丁美洲
- 巴西
- 墨西哥
- 中東和非洲
- 南非
- 沙烏地阿拉伯
- UAE
第9章:公司簡介
- 世界公司
- Otis Worldwide Corporation
- KONE Corporation
- Schindler Group
- TK Elevator
- Mitsubishi Electric Corporation
- 本地公司
- Fujitec Co., Ltd.
- Hyundai Elevator Co., Ltd.
- Hitachi, Ltd.
- Toshiba Elevator and Building Systems Corporation
- Savaria Corporation
- Motion Control Engineering, Inc.
- Liftinsight
- Sigma Elevator Company
- Robert Bosch GmbH(Smart Building Division)
- Honeywell International Inc.(Building Technologies)
- 新興企業
- Nidec Corporation(Elevator & Escalator Division)
- Wittur Group
- Yungtay Engineering Co., Ltd.
- Orona Group
- Stannah Group
- Kleemann Hellas SA
The Global Smart Elevator Market was valued at USD 26.8 billion in 2025 and is estimated to grow at a CAGR of 8.4% to reach USD 61.3 billion by 2035.
Market growth is driven by accelerating urbanization and increasing investments in smart city infrastructure worldwide. Expanding metropolitan populations and rapid high-rise construction activity across emerging and developed economies are creating sustained demand for intelligent vertical transportation systems. Developers are increasingly integrating connected elevator solutions into modern buildings as part of broader smart infrastructure ecosystems. Large-scale government-backed smart city initiatives, along with funding from multilateral institutions, are further reinforcing long-term deployment across residential, commercial, and institutional projects. At the same time, advancements in IoT frameworks, artificial intelligence, and cloud-based analytics are significantly improving system efficiency and reducing deployment costs. Modern smart elevators are increasingly designed with built-in connectivity, enabling real-time monitoring, predictive maintenance, and energy optimization from the point of installation. This transition is reshaping the elevator industry from a hardware-centric model to a data-driven, service-oriented ecosystem that supports long-term operational efficiency and lifecycle value creation.
| Market Scope | |
|---|---|
| Start Year | 2025 |
| Forecast Year | 2026-2035 |
| Start Value | $26.8 Billion |
| Forecast Value | $61.3 Billion |
| CAGR | 8.4% |
The control systems segment accounted for USD 12.7 billion in 2025 and is projected to grow at a CAGR of 7.8% through 2035. This segment leads due to its critical role in managing elevator intelligence, including optimized passenger routing, traffic flow management, energy efficiency controls, predictive maintenance systems, and cloud-enabled monitoring platforms. These technologies collectively enhance operational efficiency while reducing downtime and energy consumption across multi-elevator environments.
The commercial segment held a 43.4% share in 2025. This dominance is driven by high installation density in office complexes, retail centers, hospitality properties, airports, and transport hubs. Smart elevator systems are widely adopted in commercial infrastructure due to their ability to improve tenant experience, reduce operational costs, and support efficient building management strategies aligned with modern sustainability and performance standards.
North America Smart Elevator Market accounted for USD 6.6 billion in 2025 and is projected to grow at a CAGR of 8% through 2035. The region's leadership is supported by strong commercial real estate development, large-scale modernization of aging elevator systems, and increasingly strict regulatory requirements focused on energy efficiency, safety, and accessibility compliance. The United States remains the primary contributor to regional demand due to continuous infrastructure upgrades and widespread adoption of smart building technologies.
Major companies operating in the global smart elevator market include Otis Worldwide Corporation, KONE Corporation, Schindler Group, TK Elevator, Mitsubishi Electric Corporation, Fujitec Co., Ltd., Hyundai Elevator Co., Ltd., Hitachi Ltd., Toshiba Elevator and Building Systems Corporation, Savaria Corporation, Motion Control Engineering, Inc., Liftinsight, Sigma Elevator Company, Robert Bosch GmbH (Smart Building Division), Honeywell International Inc. (Building Technologies), Nidec Corporation (Elevator & Escalator Division), Wittur Group, Yungtay Engineering Co., Ltd., Orona Group, Stannah Group, and Kleemann Hellas S.A. Companies operating in the smart elevator market are focusing on strengthening their competitive position through integration of advanced IoT, AI, and cloud-based technologies that enable predictive maintenance and real-time system optimization. Manufacturers are increasingly shifting toward service-oriented business models that emphasize lifecycle management, remote diagnostics, and performance-based maintenance contracts. Strategic partnerships with real estate developers and smart city planners are helping expand deployment across large infrastructure projects. Firms are also investing in energy-efficient drive systems and regenerative braking technologies to align with sustainability goals and regulatory requirements.
Table of Contents
Chapter 1 Methodology and Scope
- 1.1 Market scope and definition
- 1.2 Research design
- 1.2.1 Research approach
- 1.2.2 Data collection methods
- 1.3 Data mining sources
- 1.3.1 Global
- 1.3.2 Regional/Country
- 1.4 Base estimates and calculations
- 1.4.1 Base year calculation
- 1.4.2 Key trends for market estimation
- 1.5 Primary research and validation
- 1.5.1 Primary sources
- 1.6 Forecast model
- 1.7 Research assumptions and limitations
Chapter 2 Executive Summary
- 2.1 Industry 360° synopsis
- 2.2 Key market trends
- 2.3 Regional
- 2.4 Component
- 2.5 Technology
- 2.6 Application
- 2.7 End user
- 2.8 Distribution channel
Chapter 3 Industry Insights
- 3.1 Industry Ecosystem Analysis
- 3.1.1 Supplier landscape
- 3.1.2 Factor affecting the value chain
- 3.1.3 Profit margin analysis by value chain stage
- 3.1.4 Disruptions
- 3.1.5 Future outlook
- 3.2 Industry impact forces
- 3.2.1 Growth drivers
- 3.2.1.1 Rapid urbanization and growth in high-rise construction activity globally
- 3.2.1.2 Rising investment in smart city and smart building infrastructure
- 3.2.1.3 Increasing adoption of predictive maintenance to reduce operational downtime
- 3.2.2 Pitfalls & Challenges
- 3.2.2.1 High initial installation and modernization costs vs. conventional elevator
- 3.2.2.2 Complex integration challenges with legacy building infrastructure
- 3.2.3 Opportunities
- 3.2.3.1 Large-scale modernization of aging elevator fleets in developed economies
- 3.2.3.2 Smart building and BMS ecosystem expansion creating bundled solution demand
- 3.2.1 Growth drivers
- 3.3 Growth potential analysis
- 3.4 Future market trends
- 3.5 Technology and innovation landscape
- 3.5.1 Current technological trends
- 3.5.2 Emerging technologies
- 3.5.3 IoT-enabled elevator systems
- 3.5.4 AI & machine learning integration
- 3.5.5 Cloud computing & edge computing deployment
- 3.5.6 Destination dispatch technology evolution
- 3.5.7 Regenerative drive & energy recovery systems
- 3.6 Pricing analysis (driven by primary research)
- 3.6.1 Historical price trend analysis
- 3.6.2 Pricing strategy by player type (premium / value / cost-plus)
- 3.7 Regulatory landscape
- 3.7.1 Building safety codes & elevator standards (EN 81, ASME A17.1)
- 3.7.2 Energy efficiency directives & green building certifications (LEED, BREEAM)
- 3.7.3 Cybersecurity regulations for connected building systems
- 3.7.4 Accessibility compliance requirements (ADA, European Accessibility Act)
- 3.8 Trade data analysis (driven by paid database) (HS Code- 8428)
- 3.8.1 Key trade corridors & tariff impact
- 3.8.2 Trade policy changes & regional trade agreements
- 3.9 Supply Chain Analysis
- 3.9.1 Raw material & component sourcing
- 3.9.2 Tier 1 & tier 2 supplier landscape
- 3.9.3 Supply chain risk assessment & disruption scenarios
- 3.10 Impact of AI & generative AI on the market
- 3.10.1 AI-driven disruption of existing business models
- 3.10.2 GenAI use cases & adoption roadmap by segment
- 3.10.3 Risks, limitations & regulatory considerations
- 3.11 Capacity & production landscape (driven by primary research)
- 3.11.1 Installed capacity by region & key producer
- 3.11.2 Capacity utilization rates & expansion pipelines
- 3.12 Porter's five forces analysis
- 3.13 PESTEL analysis
Chapter 4 Competitive Landscape, 2025
- 4.1 Introduction
- 4.2 Company market share analysis
- 4.2.1 By region
- 4.2.1.1 North America
- 4.2.1.2 Europe
- 4.2.1.3 Asia Pacific
- 4.2.1.4 Latin America
- 4.2.1.5 Middle East and Africa
- 4.2.1 By region
- 4.3 Company matrix analysis
- 4.4 Competitive analysis of major market players
- 4.5 Competitive positioning matrix
- 4.6 Key developments
- 4.6.1 Mergers & acquisitions
- 4.6.2 Partnerships & collaborations
- 4.6.3 New product launches
- 4.6.4 Expansion plans
Chapter 5 Market Estimates & Forecast, By Component, 2022-2035 (USD Billion) (Thousand Units)
- 5.1 Key trends
- 5.2 Control systems
- 5.2.1 Destination dispatch systems
- 5.2.2 Energy management software
- 5.2.3 Predictive maintenance algorithms & platforms
- 5.2.4 Drive control units & variable frequency drives (VFDs)
- 5.3 Maintenance systems
- 5.3.1 IoT sensors & condition monitoring modules
- 5.3.2 Remote diagnostics platforms
- 5.3.3 Fault detection & alerting systems
- 5.4 Communication systems
- 5.4.1 IoT connectivity modules (Wi-Fi, 4G/5G, BLE)
- 5.4.2 Cloud-based data transfer infrastructure
- 5.4.3 Building management system (BMS) interfaces
- 5.4.4 Remote monitoring dashboards & analytics portals
Chapter 6 Market Estimates & Forecast, By Application, 2022-2035 (USD Billion) (Thousand Units)
- 6.1 Key trends
- 6.2 Commercial
- 6.2.1 Office buildings & corporate campuses
- 6.2.2 Retail malls & shopping centers
- 6.2.3 Hotels & hospitality complexes
- 6.2.4 Airports & transportation hubs
- 6.3 Residential
- 6.3.1 Multi-family apartment towers
- 6.3.2 Luxury high-rise condominiums
- 6.3.3 Mixed-use residential complexes
- 6.4 Institutional
- 6.4.1 Hospitals & healthcare facilities
- 6.4.2 Government buildings & public infrastructure
- 6.4.3 Educational campuses & universities
- 6.5 Industrial
- 6.5.1 Manufacturing facilities & warehouses
- 6.5.2 Logistics hubs & distribution centers
Chapter 7 Market Estimates & Forecast, By Distribution Channel, 2022-2035 (USD Billion) (Thousand Units)
- 7.1 Key trends
- 7.2 Direct sales
- 7.3 Indirect sales
Chapter 8 Market Estimates & Forecast, By Region, 2022-2035 (USD Billion) (Thousand Units)
- 8.1 Key trends
- 8.2 North America
- 8.2.1 U.S.
- 8.2.2 Canada
- 8.3 Europe
- 8.3.1 UK
- 8.3.2 Germany
- 8.3.3 France
- 8.3.4 Italy
- 8.3.5 Spain
- 8.3.6 Russia
- 8.4 Asia Pacific
- 8.4.1 China
- 8.4.2 India
- 8.4.3 Japan
- 8.4.4 South Korea
- 8.4.5 Australia
- 8.5 Latin America
- 8.5.1 Brazil
- 8.5.2 Mexico
- 8.6 MEA
- 8.6.1 South Africa
- 8.6.2 Saudi Arabia
- 8.6.3 UAE
Chapter 9 Company Profiles
- 9.1 Global Players
- 9.1.1 Otis Worldwide Corporation
- 9.1.2 KONE Corporation
- 9.1.3 Schindler Group
- 9.1.4 TK Elevator
- 9.1.5 Mitsubishi Electric Corporation
- 9.2 Regional players
- 9.2.1 Fujitec Co., Ltd.
- 9.2.2 Hyundai Elevator Co., Ltd.
- 9.2.3 Hitachi, Ltd.
- 9.2.4 Toshiba Elevator and Building Systems Corporation
- 9.2.5 Savaria Corporation
- 9.2.6 Motion Control Engineering, Inc.
- 9.2.7 Liftinsight
- 9.2.8 Sigma Elevator Company
- 9.2.9 Robert Bosch GmbH (Smart Building Division)
- 9.2.10 Honeywell International Inc. (Building Technologies)
- 9.3 Emerging players
- 9.3.1 Nidec Corporation (Elevator & Escalator Division)
- 9.3.2 Wittur Group
- 9.3.3 Yungtay Engineering Co., Ltd.
- 9.3.4 Orona Group
- 9.3.5 Stannah Group
- 9.3.6 Kleemann Hellas S.A.

 全球智慧電梯市場規模、佔有率、趨勢和成長分析報告(2026-2034)
 智慧電梯市場:按電梯類型、技術、服務類型、建築高度、控制系統和應用分類-全球市場預測(2026-2032 年)
 智慧電梯市場-全球產業規模、佔有率、趨勢、機會、預測:按組件、安裝、應用、服務、地區和競爭格局分類,2021-2031年
 智慧電梯自動化系統市場:按服務、組件、最終用戶和地區分類
 智慧電梯市場報告:按解決方案、應用和地區分類(2026-2034 年)
 2026年全球智慧自適應電梯演算法市場報告
 智慧電梯市場:依組件、服務、技術、終端用戶產業、應用和地區劃分 - 至2036年的全球預測
 智慧電梯自動化系統市場分析及預測(至2035年):按類型、產品類型、服務、技術、組件、應用、部署類型、最終用戶、安裝類型和解決方案分類日本智慧電梯市場報告(按解決方案(控制系統、門禁系統、服務)、應用(住宅、商業、工業、機構及其他)和地區分類,2026-2034年)2025年全球智慧電梯市場報告