


 |
市場調查報告書
商品編碼
2101688
用於降低鹽含量的配料的市場機會、成長要素、行業趨勢和 2026-2035 年預測。Salt Reduction Ingredients Market Opportunity, Growth Drivers, Industry Trend Analysis, and Forecast 2026 - 2035 |
||||||

全球低鈉配料市場預計到 2025 年將達到 38 億美元,年複合成長率為 5.5%,到 2035 年將達到 65 億美元。
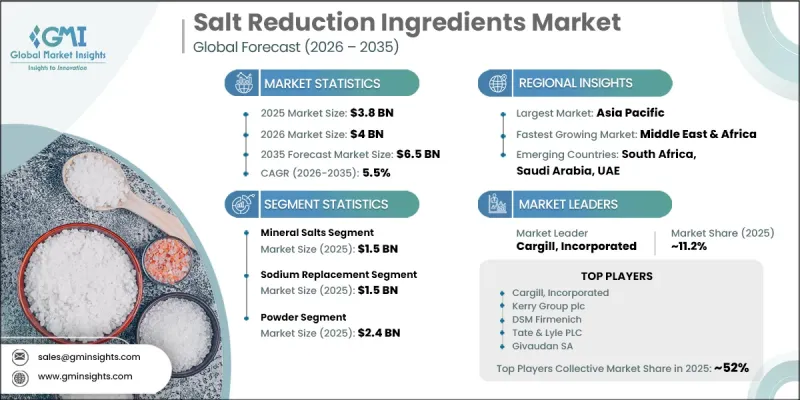
隨著食品飲料生產商不斷開發低鈉產品,同時保持口感、質地、保存期限和整體產品質量,低鈉配料市場正在不斷擴大。這些配料旨在幫助降低鈉含量,同時又不顯著影響消費者的接受度,從而使生產商能夠滿足消費者對健康食品日益成長的需求。該市場涵蓋了各種配料解決方案,有助於平衡風味並改善產品在眾多食品應用中的表現。人們對過量攝取鈉帶來的健康風險的認知不斷提高,促使生產商重新評估現有產品配方,並推出符合消費者不斷變化的偏好的低鈉替代品。已開發國家和開發中國家對營養標示和健康飲食習慣的日益關注,進一步加速了市場需求。隨著消費者越來越重視配料的品質和營養價值,食品生產商持續投資於創新的低鈉技術,以支持公共衛生目標並維持產品的吸引力。配料開發和配方技術的持續進步預計將維持全球低鈉配料市場的長期成長。
| 市場範圍 | |
|---|---|
| 開始年份 | 2025 |
| 預測期 | 2026-2035 |
| 上市時的市場規模 | 38億美元 |
| 預計金額 | 65億美元 |
| 複合年成長率 | 5.5% |
預計到2025年,礦物鹽市場銷售額將達到15億美元。由於礦物鹽的功能與傳統食鹽非常相似,同時又能有效降低鈉含量,因此該市場需求持續強勁。同時,隨著製造商尋求在保持產品品質的同時改善口感的解決方案,風味增強型替代配料也越來越受歡迎。配料配方的不斷創新使食品製造商能夠在不影響整體感官特性的前提下,降低各種加工食品中的鈉含量。
到2025年,食品飲料市場規模將達到25億美元。食品製造商仍然是這些原料的主要消費者,因為他們需要不斷重新設計產品以滿足不斷變化的營養需求。消費者對更健康食品的需求日益成長,推動了相關技術的應用,這些技術能夠在保持風味、口感、加工性和保存期限的同時降低鈉含量。持續的產品重新設計以及消費者對均衡營養日益成長的偏好,正在推動整個食品飲料行業的需求持續成長。
預計到2025年,北美低鈉配料市場規模將達到11億美元。該地區的需求成長主要得益於消費者對更健康加工食品日益成長的偏好,以及製造商為降低多種食品類別中的鈉含量而做出的更多努力。對先進風味最佳化技術和產品改進的持續投資,使食品製造商能夠在保持口味、質地和整體產品品質的同時,提供低鈉產品。這些因素預計將推動北美市場的持續擴張。
目錄
第1章:調查方法和範圍
第2章執行摘要
第3章 行業洞察
- 產業生態系分析
- 供應商情況
- 利潤率
- 每個階段增加的價值
- 影響價值鏈的因素
- 中斷
- 影響產業的因素
- 促進因素
- 低鈉食品需求日益成長
- 在全球範圍內,消費者越來越注重健康。
- 擴大監管措施以降低鈉含量
- 產業潛在風險與挑戰
- 配方改良產品在口味上所面臨的挑戰
- 配方和原料成本上漲
- 市場機遇
- 在加工食品領域不斷拓展應用
- 先進風味技術的發展
- 促進因素
- 成長潛力分析
- 監理情勢
- 波特的分析
- PESTLE分析
- 價格趨勢
- 按地區
- 依產品類型
- 未來市場趨勢
- 技術與創新展望
- 最新科技趨勢
- 新興技術
- 專利趨勢
- 貿易統計資料(註:貿易統計僅涵蓋主要國家)
- 主要進口國
- 主要出口國
- 永續性和環境方面
- 永續計劃
- 減少廢棄物策略
- 生產中的能源效率
- 具有環保意識的舉措
- 考慮碳足跡
第4章 競爭情勢
- 介紹
- 企業市佔率分析
- 按地區
- 北美洲
- 歐洲
- 亞太地區
- 中美洲和南美洲
- 中東和非洲
- 按地區
- 企業矩陣分析
- 主要市場公司的競爭分析
- 競爭定位矩陣
- 主要進展
- 併購
- 夥伴關係和聯盟
- 新產品發布
- 業務拓展計劃
第5章 市場估算與預測:依原料類型分類,2022-2035年
- 礦物鹽
- 氯化鉀(KCl)
- 硫酸鎂
- 氯化鈣
- 硫酸鉀(K2SO4)
- 其他
- 酵母萃取物
- 標準酵母萃取物
- 高麩胺酸酵母萃取物
- 自消化酵母萃取物
- 胺基酸
- 麩胺酸
- 甘胺酸
- 離胺酸
- 其他
- 麩胺酸
- 谷氨酸麩胺酸(味精)
- 麩胺酸二鉀(DSG)
- 其他
- 高核苷酸含量原料
- 肌苷酸二鈉(IMP)
- 鳥苷酸二鈉(GMP)
- 肌苷酸鈣
- 其他
- 水解植物蛋白(HVP)
- 大豆蛋白水解物
- 小麥蛋白水解物
- 玉米蛋白水解物
第6章 市場估計與預測:依功能分類,2022-2035年
- 鈉替代品
- 口味改善
- 掩蓋苦味和異味
- 改善質地和保存期限
- 其他
第7章 市場估計與預測:依類型分類,2022-2035年
- 粉末
- 液體
- 顆粒狀
第8章 市場估計與預測:依應用領域分類,2022-2035年
- 麵包糖果甜點
- 麵包捲
- 餅乾、薄脆餅乾和鹹味零食
- 蛋糕、糕點、糖果甜點
- 肉類、家禽和水產品加工
- 生肉/加工肉品
- 家禽產品
- 源自水產品和魚貝類的製品
- 乳製品和冷凍食品
- 起司和起司替代品
- 奶油和乳製品塗抹醬
- 冷凍預製食品和即食乳製品
- 醬汁、調味料、沙拉醬
- 餐桌醬料和調味品
- 乾燥調味料混合物之愛
- 沙拉醬和醃料
- 零食和鹹味食品
- 膨化造型零食
- 薯片/薯脆
- 用作調味料的堅果和種子
- 飲料
- 運動飲料和機能飲料
- 植物來源的營養強化飲料
- 湯和調理食品
- 罐裝常溫保存湯
- 調理食品食材自煮包
- 其他
第9章 市場估價與預測:依最終用戶分類,2022-2035年
- 食品製造商
- 大型食品加工企業
- 中小食品企業
- 餐廳經營者
- 速食店(QSR)、休閒快餐
- 提供全方位服務的餐廳、飯店、餐飲
- 零售/自有品牌
- 其他
第10章 市場估價與預測:依地區分類,2022-2035年
- 北美洲
- 美國
- 加拿大
- 歐洲
- 德國
- 英國
- 法國
- 西班牙
- 義大利
- 其他歐洲國家
- 亞太地區
- 中國
- 印度
- 日本
- 澳洲
- 韓國
- 其他亞太國家
- 拉丁美洲
- 巴西
- 墨西哥
- 阿根廷
- 其他拉丁美洲國家
- 中東和非洲
- 沙烏地阿拉伯
- 南非
- UAE
- 其他中東和非洲國家
第11章:公司簡介
- Cargill, Incorporated
- Kerry Group plc
- DSM Firmenich
- Tate & Lyle PLC
- Givaudan SA
- Ajinomoto Co., Inc.
- Archer Daniels Midland(ADM)
- Jungbunzlauer Suisse AG
- Angel Yeast Co., Ltd.
- Corbion NV
- Biospringer(Lesaffre Group)
- Innophos Holdings, Inc.
The Global Salt Reduction Ingredients Market was valued at USD 3.8 billion in 2025 and is estimated to grow at a CAGR of 5.5% to reach USD 6.5 billion by 2035.
The salt reduction ingredients market is expanding as food and beverage manufacturers increasingly develop products with lower sodium content while maintaining taste, texture, preservation properties, and overall product quality. These ingredients are designed to support sodium reduction without significantly affecting consumer acceptance, allowing manufacturers to respond to growing demand for healthier food options. The market includes a broad range of ingredient solutions that help improve flavor balance and product performance across numerous food applications. Rising awareness of the health risks associated with excessive sodium intake is encouraging manufacturers to reformulate existing products and introduce reduced-sodium alternatives that align with changing consumer preferences. Increasing attention to nutritional labeling and healthier dietary choices across both developed and developing economies is further accelerating demand. As consumers become more conscious of ingredient quality and nutritional value, food producers continue investing in innovative sodium reduction technologies that maintain product appeal while supporting public health objectives. Continuous advancements in ingredient development and formulation technologies are expected to sustain long-term growth across the global salt reduction ingredients market.
| Market Scope | |
|---|---|
| Start Year | 2025 |
| Forecast Year | 2026-2035 |
| Start Value | $3.8 Billion |
| Forecast Value | $6.5 Billion |
| CAGR | 5.5% |
The mineral salts segment generated USD 1.5 billion in 2025. The segment continues to maintain strong demand because these ingredients provide functionality that closely resembles conventional salt while supporting effective sodium reduction. At the same time, alternative flavor-enhancing ingredient categories are gaining wider acceptance as manufacturers seek solutions that improve taste profiles while maintaining product quality. Continued innovation in ingredient formulations is enabling food manufacturers to reduce sodium levels without compromising overall sensory performance across a broad range of processed food products.
The food & beverages segment accounted for USD 2.5 billion in 2025. Food manufacturers continue to represent the primary consumers of these ingredients as they reformulate products to meet evolving nutritional expectations. Increasing demand for healthier food choices is encouraging greater adoption of sodium reduction technologies that preserve flavor, texture, processing performance, and shelf stability. Ongoing product reformulation initiatives and expanding consumer preference for balanced nutrition continue to strengthen demand across the food and beverage industry.
North America Salt Reduction Ingredients Market reached USD 1.1 billion in 2025. Regional demand is being supported by rising consumer preference for healthier packaged food products and increasing efforts by manufacturers to reduce sodium content across multiple food categories. Continued investment in advanced flavor optimization technologies and product reformulation initiatives is helping food manufacturers deliver reduced-sodium products while maintaining taste, texture, and overall product quality. These factors are expected to support continued market expansion across North America.
Major companies operating in the global salt reduction ingredients market include Cargill, Incorporated, Kerry Group plc, DSM Firmenich, Tate & Lyle PLC, Givaudan SA, Ajinomoto Co., Inc., Archer Daniels Midland (ADM), Jungbunzlauer Suisse AG, Angel Yeast Co., Ltd., Corbion N.V., Biospringer (Lesaffre Group), and Innophos Holdings, Inc. Companies operating in the salt reduction ingredients market are strengthening their competitive position by investing in research and development to create advanced ingredient solutions that improve flavor while supporting sodium reduction. Manufacturers are expanding product portfolios with innovative formulations that help food producers meet changing nutritional preferences without compromising product quality. Strategic collaborations, acquisitions, and partnerships are enabling businesses to broaden their technological capabilities and expand their global presence. Companies are also increasing production capacity, improving supply chain efficiency, and emphasizing sustainable manufacturing practices to enhance operational performance.
Table of Contents
Chapter 1 Methodology & Scope
- 1.1 Market scope and definition
- 1.2 Research design
- 1.2.1 Research approach
- 1.2.2 Data collection methods
- 1.3 Data mining sources
- 1.3.1 Global
- 1.3.2 Regional/Country
- 1.4 Base estimates and calculations
- 1.4.1 Base year calculation
- 1.4.2 Key trends for market estimation
- 1.5 Primary research and validation
- 1.5.1 Primary sources
- 1.6 Forecast model
- 1.7 Research assumptions and limitations
Chapter 2 Executive Summary
- 2.1 Industry 360° synopsis
- 2.2 Key market trends
- 2.2.1 Regional
- 2.2.2 Ingredient Type
- 2.2.3 Functionality
- 2.2.4 Form
- 2.2.5 Application
- 2.2.6 End-User
- 2.3 TAM Analysis, 2026-2035
- 2.4 CXO perspectives: Strategic imperatives
- 2.4.1 Executive decision points
- 2.4.2 Critical success factors
- 2.5 Future Outlook and Strategic Recommendations
Chapter 3 Industry Insights
- 3.1 Industry ecosystem analysis
- 3.1.1 Supplier Landscape
- 3.1.2 Profit Margin
- 3.1.3 Value addition at each stage
- 3.1.4 Factor affecting the value chain
- 3.1.5 Disruptions
- 3.2 Industry impact forces
- 3.2.1 Growth drivers
- 3.2.1.1 Rising demand for low-sodium foods
- 3.2.1.2 Increasing consumer health consciousness globally
- 3.2.1.3 Sodium reduction regulatory initiatives expanding
- 3.2.2 Industry pitfalls and challenges
- 3.2.2.1 Taste challenges in reformulated products
- 3.2.2.2 Higher formulation and ingredient costs
- 3.2.3 Market opportunities
- 3.2.3.1 Expansion in processed food applications
- 3.2.3.2 Development of advanced flavor technologies
- 3.2.1 Growth drivers
- 3.3 Growth potential analysis
- 3.4 Regulatory landscape
- 3.4.1 North America
- 3.4.2 Europe
- 3.4.3 Asia Pacific
- 3.4.4 Latin America
- 3.4.5 Middle East & Africa
- 3.5 Porter's analysis
- 3.6 PESTEL analysis
- 3.6.1 Technology and innovation landscape
- 3.6.2 Current technological trends
- 3.6.3 Emerging technologies
- 3.7 Price trends
- 3.7.1 By region
- 3.7.2 By product type
- 3.8 Future market trends
- 3.9 Technology and Innovation Landscape
- 3.9.1 Current technological trends
- 3.9.2 Emerging technologies
- 3.10 Patent Landscape
- 3.11 Trade statistics (HS code) (Note: the trade statistics will be provided for key countries only)
- 3.11.1 Major importing countries
- 3.11.2 Major exporting countries
- 3.12 Sustainability and environmental aspects
- 3.12.1 Sustainable practices
- 3.12.2 Waste reduction strategies
- 3.12.3 Energy efficiency in production
- 3.12.4 Eco-friendly initiatives
- 3.13 Carbon Footprint Considerations
Chapter 4 Competitive Landscape, 2025
- 4.1 Introduction
- 4.2 Company market share analysis
- 4.2.1 By region
- 4.2.1.1 North America
- 4.2.1.2 Europe
- 4.2.1.3 Asia Pacific
- 4.2.1.4 LATAM
- 4.2.1.5 MEA
- 4.2.1 By region
- 4.3 Company matrix analysis
- 4.4 Competitive analysis of major market players
- 4.5 Competitive positioning matrix
- 4.6 Key developments
- 4.6.1 Mergers & acquisitions
- 4.6.2 Partnerships & collaborations
- 4.6.3 New product launches
- 4.6.4 Expansion plans
Chapter 5 Market Estimates and Forecast, By Ingredient Type, 2022 – 2035 (USD Million) (Kilo Tons)
- 5.1 Key trends
- 5.2 Mineral Salts
- 5.2.1 Potassium Chloride (KCl)
- 5.2.2 Magnesium Sulfate
- 5.2.3 Calcium Chloride
- 5.2.4 Potassium Sulfate (K2SO4)
- 5.2.5 Others
- 5.3 Yeast Extracts
- 5.3.1 Standard Yeast Extracts
- 5.3.2 High-Glutamate Yeast Extracts
- 5.3.3 Autolyzed Yeast Extracts
- 5.4 Amino Acids
- 5.4.1 Glutamic Acid
- 5.4.2 Glycine
- 5.4.3 Lysine
- 5.4.4 Others
- 5.5 Glutamates
- 5.5.1 Monosodium Glutamate (MSG)
- 5.5.2 Dipotassium Glutamate (DSG)
- 5.5.3 Others
- 5.6 High Nucleotide Ingredients
- 5.6.1 Disodium Inosinate (IMP)
- 5.6.2 Disodium Guanylate (GMP)
- 5.6.3 Calcium Inosinate
- 5.6.4 Others
- 5.7 Hydrolyzed Vegetable Protein (HVP)
- 5.7.1 Soy Protein Hydrolysates
- 5.7.2 Wheat Protein Hydrolysates
- 5.7.3 Corn Protein Hydrolysates
Chapter 6 Market Estimates and Forecast, By Functionality, 2022 – 2035 (USD Million)(Kilo Tons)
- 6.1 Key trends
- 6.2 Sodium Replacement
- 6.3 Flavor Enhancement
- 6.4 Bitterness & Off-Note Masking
- 6.5 Texture & Preservation Enhancement
- 6.6 Others
Chapter 7 Market Estimates and Forecast, By Form, 2022 – 2035 (USD Million)(Kilo Tons)
- 7.1 Key trends
- 7.2 Powder
- 7.3 Liquid
- 7.4 Granular
Chapter 8 Market Estimates and Forecast, By Application, 2022 – 2035 (USD Million)(Kilo Tons)
- 8.1 Key trends
- 8.2 Bakery & Confectionery
- 8.2.1 Bread & Rolls
- 8.2.2 Biscuits, Crackers & Savory Snack Bakery
- 8.2.3 Cakes, Pastries & Sweet Confectionery
- 8.3 Meat, Poultry & Seafood Processing
- 8.3.1 Fresh & Processed Meat Products
- 8.3.2 Poultry Products
- 8.3.3 Seafood & Fish Derivatives
- 8.4 Dairy & Frozen Foods
- 8.4.1 Cheese & Cheese Analogs
- 8.4.2 Butter & Dairy Spreads
- 8.4.3 Frozen Meals & Ready-to-Eat Dairy Products
- 8.5 Sauces, Seasonings & Dressings
- 8.5.1 Table Sauces & Condiments
- 8.5.2 Dry Seasoning Blends & Rubs
- 8.5.3 Salad Dressings & Marinades
- 8.6 Snacks & Savory
- 8.6.1 Extruded Snacks
- 8.6.2 Potato Chips & Crisps
- 8.6.3 Nuts & Seeds Seasoning Applications
- 8.7 Beverages
- 8.7.1 Sports & Functional Beverages
- 8.7.2 Plant-Based & Fortified Drinks
- 8.8 Soups & Ready Meals
- 8.8.1 Canned & Ambient Soups
- 8.8.2 Ready Meals & Meal Kits
- 8.9 Others
Chapter 9 Market Estimates and Forecast, By End-User, 2022 – 2035 (USD Million)(Kilo Tons)
- 9.1 Key trends
- 9.2 Food Manufacturers
- 9.2.1 Large-Scale Industrial Food Processors
- 9.2.2 Small & Medium Food Enterprises (SMEs)
- 9.3 Foodservice Operators
- 9.3.1 Quick Service Restaurants (QSR) & Fast Casual
- 9.3.2 Full-Service Restaurants, Hotels & Catering
- 9.4 Retail / Private Label
- 9.5 Others
Chapter 10 Market Estimates and Forecast, By Region, 2022 – 2035 (USD Million) (Kilo Tons)
- 10.1 Key trends
- 10.2 North America
- 10.2.1 U.S.
- 10.2.2 Canada
- 10.3 Europe
- 10.3.1 Germany
- 10.3.2 UK
- 10.3.3 France
- 10.3.4 Spain
- 10.3.5 Italy
- 10.3.6 Rest of Europe
- 10.4 Asia Pacific
- 10.4.1 China
- 10.4.2 India
- 10.4.3 Japan
- 10.4.4 Australia
- 10.4.5 South Korea
- 10.4.6 Rest of Asia Pacific
- 10.5 Latin America
- 10.5.1 Brazil
- 10.5.2 Mexico
- 10.5.3 Argentina
- 10.5.4 Rest of Latin America
- 10.6 Middle East and Africa
- 10.6.1 Saudi Arabia
- 10.6.2 South Africa
- 10.6.3 UAE
- 10.6.4 Rest of Middle East and Africa
Chapter 11 Company Profiles
- 11.1 Cargill, Incorporated
- 11.2 Kerry Group plc
- 11.3 DSM Firmenich
- 11.4 Tate & Lyle PLC
- 11.5 Givaudan SA
- 11.6 Ajinomoto Co., Inc.
- 11.7 Archer Daniels Midland (ADM)
- 11.8 Jungbunzlauer Suisse AG
- 11.9 Angel Yeast Co., Ltd.
- 11.10 Corbion N.V.
- 11.11 Biospringer (Lesaffre Group)
- 11.12 Innophos Holdings, Inc.


