


 |
市場調查報告書
商品編碼
2101666
公司債市場機會、成長動力、產業趨勢分析及2026-2035年預測。Corporate Bond Market Opportunity, Growth Drivers, Industry Trend Analysis, and Forecast 2026 - 2035 |
||||||

全球公司債市場預計到 2025 年將達到 48.7 兆美元,年複合成長率為 4.2%,到 2035 年將達到 73 兆美元。
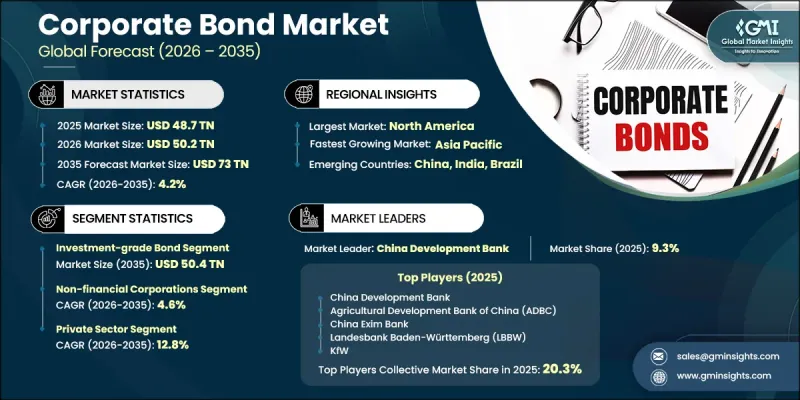
這一成長主要源自於企業對長期債務證券的依賴日益加深,以滿足基礎建設、能源轉型計畫和營運資金融資的需求。透過交易所交易基金(ETF)和其他結構化固定收益投資產品,企業能夠進一步吸引機構投資者參與,並拓展市場准入。企業資金籌措決策中持續納入環境、社會和管治(ESG)因素,也正在改變市場趨勢,吸引更多不同類型的投資人。此外,亞太和中東地區資本市場的自由化正在擴大債券發行機會,並吸引新型發行人。能源、交通、基礎設施和電信等資本密集產業的企業正不斷延長債務期限,以支持與數位轉型和永續性目標相契合的多年投資策略。全球機構資產管理的擴張和國際信貸市場互聯互通的加強,正在推動全球對公司債的結構性需求。
| 市場範圍 | |
|---|---|
| 開始年份 | 2025 |
| 預測年份 | 2026-2035 |
| 起始金額 | 48.7兆美元 |
| 預測金額 | 73兆美元 |
| 複合年成長率 | 4.2% |
預計到2025年,投資合格公司債市場規模將達到35.1兆美元,累計市場佔有率的72.1%,到2035年將達到50.4兆美元,年複合成長率為3.8%。該板塊仍是全球公司債市場的基石,受到退休基金、保險公司、中央銀行和大型資產管理公司等機構投資者的強力支持。嚴格的信用評級要求進一步鞏固了其主導地位,評級BBB-/Baa3或以上的證券被監管機構和內部投資指南廣泛接受,從而確保了整個市場週期內的穩定需求。
預計到2025年,非金融企業發行人債券規模將達到27.6兆美元。該板塊涵蓋工業、科技、醫療保健、消費品、能源和基礎設施等行業的公司,這些公司積極利用債券市場為資本支出、收購、業務擴張和股東回報提供資金籌措。隨著監理股本要求收緊銀行貸款,企業越來越依賴債券發行,非金融企業發行人債券規模的成長反映了企業融資方式向資本市場資金籌措的更廣泛轉變。
預計到2025年,北美公司債市場規模將達到23.4兆美元。北美的主導地位得益於高度發展的資本市場、強勁的二級市場流動性、完善的信用評級體係以及廣泛的機構投資者基礎,其中包括退休基金、共同基金、保險公司和全球外匯儲備管理機構。
目錄
第1章:調查方法和範圍
第2章執行摘要
第3章 行業洞察
- 產業生態系分析
- 供應商情況
- 原物料供應商
- 零件供應商
- 製造商
- 服務供應商
- 分銷管道
- 最終用途
- 成本結構
- 利潤率
- 每個階段增加的價值
- 垂直整合趨勢
- 顛覆者
- 供應商情況
- 影響產業的因素
- 成長促進因素
- 企業對長期資金籌措的需求日益成長。
- 全球資本市場擴張與機構投資擴張
- 有利於企業發行債券的法律規範。
- 與基礎設施擴建、ESG(環境、社會和治理)以及再融資相關的投資需求不斷成長。
- 市場限制因素
- 由於利率波動,借貸成本增加,發行量減少。
- 在不確定的經濟環境下,信用違約風險和信用利差擴大。
- 市場機遇
- 永續債券和綠色債券的發行量正在擴大。
- 在利率上升的背景下,浮動利率債券的發行量正在增加。
- 透過ETF,機構投資者和個人投資者的參與度提高
- 利用金融科技解決方案實現債券發行、交易和結算的數位化
- 成長促進因素
- 成長潛力分析
- 價格分析
- 對過去價格趨勢的分析
- 依球員類型分類的定價策略(高級球員、超值球員、成本加成球員)
- 監理情勢
- 國際的
- 巴塞爾協議III資本法規結構
- 按地區
- 北美洲
- 1933 年美國證券法與美國證券交易委員會第 144A 號規則
- 歐洲
- 歐盟招股說明書條例和MiFID II
- 亞太地區
- 中國銀行間債券市場(CIBM)監管
- 拉丁美洲
- 巴西證券交易委員會(CVM)關於公開發行證券的架構(CVM第160號決議)
- 中東和非洲
- 沙烏地阿拉伯資本市場管理局(CMA)的債務證券規則
- 北美洲
- 國際的
- 技術與創新展望
- 最新技術
- 新興技術
- 波特的分析
- PESTLE分析
- 專利分析
- 人工智慧和生成式人工智慧對市場的影響
- 利用人工智慧改造現有經營模式
- 設計自動化最佳化
- 用於需求預測的供應鏈人工智慧
- 按細分市場分類的生成式人工智慧用例和部署藍圖
- 風險、限制和監管考量
- 永續性和環境方面
- 永續計劃
- 減少廢棄物策略
- 生產中的能源效率
- 具有環保意識的舉措
- 考慮碳足跡
- 預測假設和情境分析
- 基本案例:驅動複合年成長率的關鍵宏觀經濟與產業變量
- 樂觀情境:宏觀經濟與產業的順風
- 悲觀情景:宏觀經濟放緩或產業逆風
第4章 競爭情勢
- 介紹
- 企業市佔率分析
- 北美洲
- 歐洲
- 亞太地區
- 拉丁美洲
- 中東和非洲
- 競爭定位矩陣
- 主要進展
- 併購
- 夥伴關係和聯盟
- 新產品發布
- 業務拓展計劃及資金籌措
- 按公司規模進行基準測試
- 排名分類標準與遴選標準
- 層級定位矩陣:依收入、地區和創新能力分類
第5章 市場估計與預測:依債券類型分類,2022-2035年
- 投資合格債券
- 高收益(垃圾)債券
- 可轉換債券
- 零息債券
- 浮動利率債券(FRN)
- 永久債券
第6章 市場估價與預測:依發行人分類,2022-2035年
- 金融機構
- 銀行
- 保險公司
- 資產管理公司
- 其他
- 非金融公司
- 製造業
- 科技
- 衛生保健
- 能源公用事業
- 消費品
- 電訊
- 其他
第7章 市場估計與預測:依成熟度分類,2022-2035年
- 短期(少於3年)
- 中期(3-10年)
- 長期(超過10年)
第8章 市場估算與預測:依通路分類,2022-2035年
- 發行市場
- 二級市場
- 持續時間(10 年或以上)
第9章 市場估價與預測:依票息結構分類,2022-2035年
- 固定利率債券
- 浮動利率債券
- 零息債券
- 其他
第10章 市場估價與預測:依地區分類,2022-2035年
- 北美洲
- 美國
- 加拿大
- 歐洲
- 英國
- 德國
- 法國
- 義大利
- 西班牙
- 比利時
- 荷蘭
- 瑞典
- 俄羅斯
- 亞太地區
- 中國
- 印度
- 日本
- 澳洲
- 新加坡
- 韓國
- 越南
- 印尼
- 泰國
- 拉丁美洲
- 巴西
- 墨西哥
- 阿根廷
- 中東和非洲
- 南非
- 沙烏地阿拉伯
- UAE
第11章:公司簡介
- 世界公司
- JPMorgan Chase
- Bank of America
- Citigroup
- Goldman Sachs
- Morgan Stanley
- HSBC
- BlackRock
- BNP Paribas
- Barclays
- Wells Fargo
- 本地公司
- China Development Bank
- Agricultural Development Bank of China
- China Exim Bank
- Landesbank Baden-Wurttemberg
- KfW
- Agricultural Bank of China
- European Investment Bank
- State Grid Corporation of China
- PIMCO
The Global Corporate Bond Market was valued at USD 48.7 trillion in 2025 and is estimated to grow at a CAGR of 4.2% to reach USD 73 trillion by 2035.
Growth is driven by increasing corporate reliance on long-term debt instruments to finance infrastructure development, energy transition initiatives, and operational capital requirements. Institutional participation continues to deepen through exchange-traded funds (ETFs) and other structured fixed-income investment vehicles, further broadening market accessibility. The ongoing integration of environmental, social, and governance (ESG) considerations into corporate financing decisions is also reshaping issuance trends and attracting a more diversified investor base. In addition, capital market liberalization across Asia Pacific and the Middle East is expanding issuance opportunities and introducing new classes of issuers. Corporations in capital-intensive industries such as energy, transportation, infrastructure, and telecommunications are increasingly extending debt maturities to support multi-year investment strategies linked to digital transformation and sustainability goals. Expansion in global institutional assets under management and the growing interconnectedness of international credit markets are reinforcing structural demand for corporate debt instruments worldwide.
| Market Scope | |
|---|---|
| Start Year | 2025 |
| Forecast Year | 2026-2035 |
| Start Value | $48.7 Trillion |
| Forecast Value | $73 Trillion |
| CAGR | 4.2% |
The investment-grade corporate bond segment generated USD 35.1 trillion, holding 72.1% share in 2025, and is projected to reach USD 50.4 trillion by 2035, growing at a CAGR of 3.8%. This segment remains the backbone of global corporate debt markets due to its strong appeal among institutional investors, including pension funds, insurance companies, central banks, and large asset managers. Its dominance is reinforced by strict credit quality requirements, where securities rated BBB-/Baa3 or higher are widely accepted under regulatory and internal investment mandates, ensuring stable demand across market cycles.
The non-financial corporate issuer segment captured USD 27.6 trillion in 2025. This segment includes companies operating across industrial, technology, healthcare, consumer, energy, and infrastructure sectors that actively use bond markets to fund capital investments, acquisitions, operational expansion, and shareholder returns. Growth in this segment reflects a broader shift toward capital market financing as corporations increasingly rely on bond issuance due to tighter bank lending conditions influenced by regulatory capital requirements.
North America Corporate Bond Market reached USD 23.4 trillion in 2025. Market leadership in North America is supported by highly developed capital markets, strong secondary market liquidity, a well-established credit rating ecosystem, and a broad institutional investor base that includes pension funds, mutual funds, insurance companies, and global reserve managers.
Major companies operating in the global corporate bond market include JPMorgan Chase, Morgan Stanley, Goldman Sachs, China Development Bank, Agricultural Development Bank of China, China Exim Bank, Landesbank Baden-Wurttemberg, KfW, Agricultural Bank of China, and the European Investment Bank (EIB). Companies operating in the corporate bond market are strengthening their competitive positioning through diversification of issuance strategies, expansion of investor outreach programs, and integration of ESG-linked financing frameworks. Financial institutions are increasingly structuring bonds with sustainability-linked features to attract environmentally focused investors and meet evolving regulatory expectations. Firms are also enhancing digital issuance platforms to improve transaction efficiency and broaden market access for global investors. Strategic advisory services, underwriting innovation, and risk management capabilities are being strengthened to support large-scale and cross-border bond issuances.
Table of Contents
Chapter 1 Methodology & Scope
- 1.1 Research approach
- 1.2 Quality Commitments
- 1.2.1 GMI AI policy & data integrity commitment
- 1.2.1.1 Source consistency protocol
- 1.2.1 GMI AI policy & data integrity commitment
- 1.3 Research Trail & Confidence Scoring
- 1.3.1 Research Trail Components
- 1.3.2 Scoring Components
- 1.4 Data Collection
- 1.4.1 Partial list of primary sources
- 1.5 Data mining sources
- 1.5.1 Paid sources
- 1.5.1.1 Sources, by region
- 1.5.1 Paid sources
- 1.6 Base estimates and calculations
- 1.6.1 Base year calculation
- 1.7 Forecast
- 1.7.1 Quantified market impact analysis
- 1.7.1.1 Mathematical impact of growth parameters on forecast
- 1.7.1 Quantified market impact analysis
- 1.8 Research transparency addendum
- 1.8.1 Source attribution framework
- 1.8.2 Quality assurance metrics
- 1.8.3 Our commitment to trust
Chapter 2 Executive Summary
- 2.1 Industry 360° synopsis
- 2.2 Key market trends
- 2.2.1 Regional
- 2.2.2 Bond Type
- 2.2.3 Issuer Type
- 2.2.4 Maturity
- 2.2.5 Distribution Channel
- 2.2.6 Coupon Structure
- 2.3 TAM Analysis, 2026-2035
- 2.4 CXO perspectives: Strategic imperatives
Chapter 3 Industry Insights
- 3.1 Industry ecosystem analysis
- 3.1.1 Supplier landscape
- 3.1.1.1 Raw material suppliers
- 3.1.1.2 Component suppliers
- 3.1.1.3 Manufacturers
- 3.1.1.4 Service providers
- 3.1.1.5 Distribution channel
- 3.1.1.6 End Use
- 3.1.2 Cost structure
- 3.1.3 Profit margin
- 3.1.4 Value addition at each stage
- 3.1.5 Vertical integration trends
- 3.1.6 Disruptors
- 3.1.1 Supplier landscape
- 3.2 Industry impact forces
- 3.2.1 Growth drivers
- 3.2.1.1 Increasing corporate demand for long-term financing.
- 3.2.1.2 Expansion of global capital markets and institutional investment.
- 3.2.1.3 Favorable regulatory frameworks supporting corporate debt issuance.
- 3.2.1.4 Growing infrastructure, ESG, and refinancing investment needs.
- 3.2.2 Market Restraints
- 3.2.2.1 Interest rate volatility increasing borrowing costs and reducing issuance.
- 3.2.2.2 Credit default risk and widening credit spreads during economic uncertainty.
- 3.2.3 Market Opportunities
- 3.2.3.1 Growing adoption of sustainable and green corporate bonds.
- 3.2.3.2 Rising issuance of floating-rate notes amid higher interest rates.
- 3.2.3.3 Increasing participation of institutional and retail investors through ETFs.
- 3.2.3.4 Digitalization of bond issuance, trading, and settlement using fintech solutions.
- 3.2.1 Growth drivers
- 3.3 Growth potential analysis
- 3.4 Pricing Analysis (Driven by Primary Research)
- 3.4.1 Historical Price Trend Analysis
- 3.4.2 Pricing Strategy by Player Type (Premium / Value / Cost-plus)
- 3.5 Regulatory landscape
- 3.5.1 International
- 3.5.1.1 Basel III Capital Framework
- 3.5.2 Regional
- 3.5.2.1 North America
- 3.5.2.1.1 U.S. Securities Act of 1933 & SEC Rule 144A
- 3.5.2.2 Europe
- 3.5.2.2.1 EU Prospectus Regulation & MiFID II
- 3.5.2.3 Asia-Pacific
- 3.5.2.3.1 China Interbank Bond Market (CIBM) Regulations
- 3.5.2.4 Latin America
- 3.5.2.4.1 Brazil CVM Public Securities Offering Framework (CVM Resolution 160)
- 3.5.2.5 Middle East & Africa
- 3.5.2.5.1 Saudi Capital Market Authority (CMA) Debt Instruments Rules
- 3.5.2.1 North America
- 3.5.1 International
- 3.6 Technology and Innovation landscape
- 3.6.1 Current technologies
- 3.6.2 Emerging technologies
- 3.7 Porter’s analysis
- 3.8 PESTEL analysis
- 3.9 Patent analysis (Driven by Primary Research)
- 3.10 Impact of AI & generative AI on the market
- 3.10.1 AI-Driven Disruption of Existing Business Models
- 3.10.2 Automated design optimization
- 3.10.3 Supply chain AI for demand forecasting
- 3.10.4 GenAI use cases & adoption roadmap by segment
- 3.10.5 Risks, Limitations & Regulatory Considerations
- 3.11 Sustainability and environmental aspects
- 3.11.1 Sustainable practices
- 3.11.2 Waste reduction strategies
- 3.11.3 Energy efficiency in production
- 3.11.4 Eco-friendly Initiatives
- 3.11.5 Carbon footprint considerations
- 3.12 Forecast assumptions & scenario analysis (Driven by Primary Research)
- 3.12.1 Base Case - key macro & industry variables driving CAGR
- 3.12.2 Optimistic Scenarios - Favorable Macro and Industry Tailwinds
- 3.12.3 Pessimistic Scenario - Macroeconomic slowdown or industry headwinds
Chapter 4 Competitive Landscape, 2025
- 4.1 Introduction
- 4.2 Company market share analysis
- 4.2.1 North America
- 4.2.2 Europe
- 4.2.3 Asia-Pacific
- 4.2.4 Latin America
- 4.2.5 Middle East & Africa
- 4.3 Competitive positioning matrix
- 4.4 Key developments
- 4.4.1 Mergers & acquisitions
- 4.4.2 Partnerships & collaborations
- 4.4.3 New product launches
- 4.4.4 Expansion plans and funding
- 4.5 Company tier benchmarking
- 4.5.1 Tier classification criteria & qualifying thresholds
- 4.5.2 Tier positioning matrix by revenue, geography & innovation
Chapter 5 Market Estimates & Forecast, By Bond Type, 2022 - 2035 ($Mn)
- 5.1 Key trends
- 5.2 Investment-Grade Bonds
- 5.3 High-Yield (Junk) Bonds
- 5.4 Convertible Bonds
- 5.5 Zero-Coupon Bonds
- 5.6 Floating-Rate Notes (FRNs)
- 5.7 Perpetual Bonds
Chapter 6 Market Estimates & Forecast, By Issuer, 2022 - 2035 ($Mn)
- 6.1 Key trends
- 6.2 Financial Corporations
- 6.2.1 Banks
- 6.2.2 Insurance Companies
- 6.2.3 Asset Managers
- 6.2.4 Other
- 6.3 Non-Financial Corporations
- 6.3.1 Manufacturing
- 6.3.2 Technology
- 6.3.3 Healthcare
- 6.3.4 Energy & Utilities
- 6.3.5 Consumer Goods
- 6.3.6 Telecommunications
- 6.3.7 Others
Chapter 7 Market Estimates & Forecast, By Maturity, 2022 - 2035 ($Mn)
- 7.1 Key trends
- 7.2 Short-Term (< 3 Years)
- 7.3 Medium-Term (3–10 Years)
- 7.4 Long-Term (> 10 Years)
Chapter 8 Market Estimates & Forecast, By Distribution Channel, 2022 - 2035 ($Mn)
- 8.1 Key trends
- 8.2 Primary Market
- 8.3 Secondary Market
- 8.4 Term (> 10 Years)
Chapter 9 Market Estimates & Forecast, By Coupon Structure, 2022 - 2035 ($Mn)
- 9.1 Key trends
- 9.2 Fixed-Rate Bonds
- 9.3 Floating-Rate Bonds
- 9.4 Zero-Coupon Bonds
- 9.5 Other
Chapter 10 Market Estimates & Forecast, By Region, 2022 - 2035 ($Mn)
- 10.1 North America
- 10.1.1 US
- 10.1.2 Canada
- 10.2 Europe
- 10.2.1 UK
- 10.2.2 Germany
- 10.2.3 France
- 10.2.4 Italy
- 10.2.5 Spain
- 10.2.6 Belgium
- 10.2.7 Netherlands
- 10.2.8 Sweden
- 10.2.9 Russia
- 10.3 Asia Pacific
- 10.3.1 China
- 10.3.2 India
- 10.3.3 Japan
- 10.3.4 Australia
- 10.3.5 Singapore
- 10.3.6 South Korea
- 10.3.7 Vietnam
- 10.3.8 Indonesia
- 10.3.9 Thailand
- 10.4 Latin America
- 10.4.1 Brazil
- 10.4.2 Mexico
- 10.4.3 Argentina
- 10.5 MEA
- 10.5.1 South Africa
- 10.5.2 Saudi Arabia
- 10.5.3 UAE
Chapter 11 Company Profiles
- 11.1 Global Players
- 11.1.1 JPMorgan Chase
- 11.1.2 Bank of America
- 11.1.3 Citigroup
- 11.1.4 Goldman Sachs
- 11.1.5 Morgan Stanley
- 11.1.6 HSBC
- 11.1.7 BlackRock
- 11.1.8 BNP Paribas
- 11.1.9 Barclays
- 11.1.10 Wells Fargo
- 11.2 Regional Players
- 11.2.1 China Development Bank
- 11.2.2 Agricultural Development Bank of China
- 11.2.3 China Exim Bank
- 11.2.4 Landesbank Baden-Wurttemberg
- 11.2.5 KfW
- 11.2.6 Agricultural Bank of China
- 11.2.7 European Investment Bank
- 11.2.8 State Grid Corporation of China
- 11.2.9 PIMCO


