


 |
市場調查報告書
商品編碼
2101649
咖啡及可可溯源市場機會、成長要素、產業趨勢分析及2026-2035年預測Coffee and Cocoa Traceability Market Opportunity, Growth Drivers, Industry Trend Analysis, and Forecast 2026 - 2035 |
||||||

全球咖啡和可可追溯性市場預計到 2025 年將達到 4.885 億美元,並以 15.6% 的複合年成長率成長,到 2035 年達到 23 億美元。
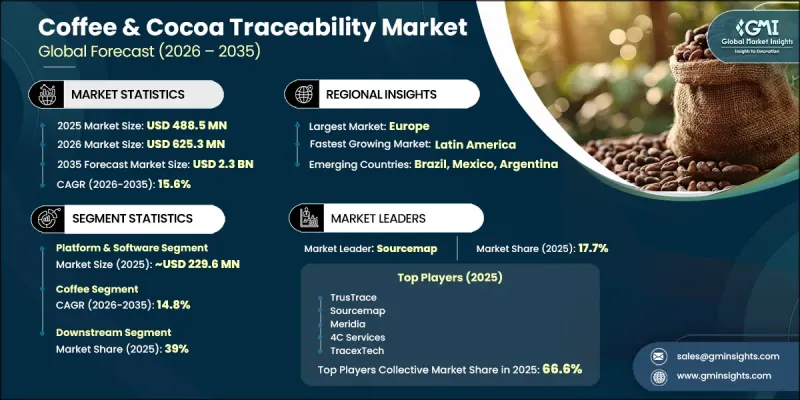
咖啡和可可溯源是指一個由數位平台、檢驗系統和服務框架組成的生態系統,它將西非和拉丁美洲等地區的小規模生產者與全球的烘焙商、貿易業者和零售商連接起來。這些系統利用各種工具,從基於行動裝置的定位到企業級SaaS平台和基於區塊鏈的認證系統,來記錄和檢驗價值鏈中每個環節產品的產地、所有權轉移和合規狀態。市場擴張主要受監管執法力度和高階市場定位的共同推動。主要進口地區引入嚴格的森林砍伐預防合規要求,使得農場層級的溯源成為進入市場的必要條件。同時,對專門食品咖啡和優質可可產品日益成長的需求,也使產地透明度從單純的合規要求提升為商業性差異化因素,並加速了其在自願性市場的普及。因此,合作社、出口商、加工商和全球買家擴大採用溯源解決方案,以確保符合監管要求並履行品牌層面的永續性承諾。
| 市場範圍 | |
|---|---|
| 開始年份 | 2025 |
| 預測期 | 2026-2035 |
| 上市時的市場規模 | 4.885億美元 |
| 預測金額 | 23億美元 |
| 複合年成長率 | 15.6% |
平台軟體市場預計在2025年達到2.296億美元,並在2026年至2035年間以17.8%的複合年成長率成長。該市場構成可追溯性生態系統的核心數位層,整合來自田間資料收集工具、認證資料庫和物流系統的數據,從而建立統一的報告架構。這些平台可為企業用戶和監管機構產生合規相關文件、ESG報告和風險分析。該市場受益於基於訂閱的循環收入模式和可擴展的雲端基礎設施,能夠在一個統一的數位框架內為跨國公司和小規模農戶網路提供服務。
預計到2025年,咖啡市佔率將達到51%,並將在2035年之前以14.8%的複合年成長率成長。咖啡可追溯性的需求涵蓋阿拉比卡咖啡、羅布斯塔咖啡以及專門食品和單一產地咖啡等類別。在阿拉比卡咖啡供應鏈中,尤其是在拉丁美洲和東非,可追溯性系統已廣泛應用於認證和高階出口管道,因為文件標準與市場進入要求密切相關。在羅布斯塔咖啡產區,由於合規義務的不斷增加,可追溯性系統的採用速度正在加快。尤其是在越南和印尼等主要出口國,大規模生產越來越受到與歐洲進口標準相關的森林砍伐和盡職調查要求的限制。
預計到2035年,北美咖啡和可可可追溯性市場規模將達到5.308億美元,這主要得益於企業永續發展舉措的加強以及對供應鏈透明度日益成長的期望。該地區的需求主要由零售和餐飲網路中的食品飲料公司驅動,這些公司正在實施追溯系統,以支援無毀林採購政策、供應商合規性以及更廣泛的ESG(環境、社會和治理)報告要求。雖然與其它地區相比,監管壓力相對較小,但相關人員嚴格的審查和品牌課責的增強正在加速整個價值鏈的採用。
目錄
第1章:調查方法和範圍
第2章執行摘要
第3章 行業洞察
- 產業生態系分析
- 供應商情況
- 利潤率
- 每個階段增加的價值
- 影響價值鏈的因素
- 中斷
- 影響產業的因素
- 促進因素
- 產業潛在風險與挑戰
- 市場機遇
- 成長潛力分析
- 監理情勢
- 波特的分析
- PESTLE分析
- 技術與創新展望
- 最新科技趨勢
- 新興技術
- 價格趨勢
- 按地區
- Tag 的技術
- 未來市場趨勢
- 專利趨勢
- 貿易統計
- 主要進口國
- 主要出口國
- 永續性和環境方面
- 永續計劃
- 減少廢棄物策略
- 生產中的能源效率
- 具有環保意識的舉措
- 考慮碳足跡
第4章 競爭情勢
- 介紹
- 企業市佔率分析
- 按地區
- 北美洲
- 歐洲
- 亞太地區
- LATAM
- 中東和非洲
- 按地區
- 企業矩陣分析
- 主要市場公司的競爭分析
- 競爭定位矩陣
- 主要進展
- 併購
- 夥伴關係和聯盟
- 新產品發布
- 業務拓展計劃
第5章 市場估算與預測:以交付方式分類,2022-2035年
- 平台和軟體
- 硬體和感測設備
- 專業服務
第6章 市場估算與預測:依產品分類,2022-2035年
- 咖啡
- 阿拉比卡
- 羅布斯塔
- 專門食品咖啡和單一產地咖啡
- 可可
- 散裝可可
- 風味上乘,單一產地
- 有機認證
第7章 市場估計與預測:依最終用戶分類,2022-2035年
- 上游部門
- 小規模農戶
- 合作社和農民組織
- 濕磨機/發酵中心
- 中游
- 原產國的出口商和加工商
- 國際商品貿易商
- 下游產業
- 烘焙機和攪拌機
- 巧克力和糖果甜點製造商
- 消費品牌與自有品牌
- 食品服務業及專業零售商
- 認證機構和監管機構
第8章 市場估計與預測:依地區分類,2022-2035年
- 北美洲
- 美國
- 加拿大
- 歐洲
- 德國
- 英國
- 法國
- 西班牙
- 義大利
- 其他歐洲國家
- 亞太地區
- 中國
- 印度
- 日本
- 澳洲
- 韓國
- 其他亞太國家
- 拉丁美洲
- 巴西
- 墨西哥
- 阿根廷
- 其他拉丁美洲國家
- 中東和非洲
- 沙烏地阿拉伯
- 南非
- UAE
- 其他中東和非洲國家
第9章:公司簡介
- 4c services
- Agrolinking(agtrail)
- Bunachain
- Coolx
- Corgo
- Geocertify
- Ice cot(iba)
- Meridia(meridia verify)
- Monitys
- Open food chain
- Palmyra ecosystem
- Sourcemap
- Tracextech
- Trustrace
The Global Coffee & Cocoa Traceability Market was valued at USD 488.5 million in 2025 and is estimated to grow at a CAGR of 15.6% to reach USD 2.3 billion by 2035.
Coffee and cocoa traceability refers to the ecosystem of digital platforms, verification systems, and service frameworks that connect smallholder producers in regions such as West Africa and Latin America with global roasters, traders, and retail buyers. These systems document and validate product origin, custody transitions, and compliance status at each stage of the value chain, using tools that range from mobile-based geolocation mapping to enterprise-grade SaaS platforms and blockchain-enabled certification systems. Market expansion is being strongly influenced by the convergence of regulatory enforcement and premium market positioning. The implementation of strict deforestation compliance requirements in major importing regions has made farm-level traceability a mandatory component of market access. At the same time, rising demand for specialty coffee and fine cocoa products has elevated origin transparency from a compliance requirement to a commercial differentiator, reinforcing adoption even in voluntary markets. As a result, traceability solutions are increasingly integrated across cooperatives, exporters, processors, and global buyers to ensure both regulatory alignment and brand-level sustainability commitments.
| Market Scope | |
|---|---|
| Start Year | 2025 |
| Forecast Year | 2026-2035 |
| Start Value | $488.5 Million |
| Forecast Value | $2.3 Billion |
| CAGR | 15.6% |
The platform & software segment was valued at USD 229.6 million in 2025 and is projected to grow at a CAGR of 17.8% from 2026 to 2035. This segment represents the central digital layer of the traceability ecosystem, integrating data from field-level collection tools, certification databases, and logistics systems into unified reporting structures. These platforms generate compliance documentation, ESG reports, and risk analytics for both corporate users and regulatory bodies. The segment benefits from recurring subscription-based revenue models and scalable cloud infrastructure that enables service delivery across multinational enterprises and smallholder farming networks within a single digital framework.
The coffee segment held a 51% share in 2025 and is projected to grow at a CAGR of 14.8% through 2035. Demand for traceability in coffee spans Arabica, Robusta, and specialty or single-origin categories. In Arabica supply chains, traceability systems are widely used in certified and premium export channels, particularly across Latin America and East Africa, where documentation standards are closely tied to market access requirements. In Robusta-producing regions, adoption is accelerating as compliance obligations expand, especially in major exporting countries such as Vietnam and Indonesia, where large-scale production is increasingly subject to deforestation and due diligence requirements tied to European import standards.
North America Coffee & Cocoa Traceability Market is expected to reach USD 530.8 million by 2035, supported by growing corporate sustainability commitments and evolving supply chain transparency expectations. Demand in the region is primarily driven by food and beverage companies operating across retail and food service networks, which are adopting traceability systems to support deforestation-free sourcing policies, supplier compliance frameworks, and broader ESG reporting requirements. Although regulatory pressure is less direct compared to other regions, increasing stakeholder scrutiny and brand accountability are accelerating adoption across the value chain.
Major players operating in the global coffee & cocoa traceability industry include 4C Services, Agrolinking (AgTrail), Bunachain, Coolx, Corgo, GeoCertify, ICE CoT (IBA), Meridia (Meridia Verify), Monitys, Open Food Chain, Palmyra Ecosystem, Sourcemap, TracexTech, and TrusTrace. Companies in the coffee & cocoa traceability market are focusing on expanding digital platform capabilities that integrate geolocation, certification, and logistics data into unified systems. Many players are investing in blockchain-enabled verification tools to enhance data integrity and strengthen trust across complex supply chains. Strategic partnerships with cooperatives, exporters, and global food brands are being prioritized to expand platform adoption at origin. Firms are also emphasizing SaaS-based subscription models to ensure recurring revenue and scalable deployment across multiple regions. Mobile-first data collection tools are being developed to improve accessibility for smallholder farmers with limited infrastructure. In addition, companies are aligning their solutions with regulatory frameworks and ESG reporting standards to support compliance-driven demand while also targeting premium market segments that require verified origin and sustainability documentation for product differentiation.
Table of Contents
Chapter 1 Methodology & Scope
- 1.1 Market scope and definition
- 1.2 Research design
- 1.2.1 Research approach
- 1.2.2 Data collection methods
- 1.3 Data mining sources
- 1.3.1 Global
- 1.3.2 Regional/Country
- 1.4 Base estimates and calculations
- 1.4.1 Base year calculation
- 1.4.2 Key trends for market estimation
- 1.5 Primary research and validation
- 1.5.1 Primary sources
- 1.6 Forecast model
- 1.7 Research assumptions and limitations
Chapter 2 Executive Summary
- 2.1 Industry 360° synopsis
- 2.2 Key market trends
- 2.2.1 Offering type
- 2.2.2 Commodity
- 2.2.3 End User
- 2.2.4 Regional
- 2.3 TAM Analysis, 2026-2035
- 2.4 CXO perspectives: Strategic imperatives
- 2.5 Future outlook and strategic recommendations
Chapter 3 Industry Insights
- 3.1 Industry ecosystem analysis
- 3.1.1 Supplier landscape
- 3.1.2 Profit margin
- 3.1.3 Value addition at each stage
- 3.1.4 Factor affecting the value chain
- 3.1.5 Disruptions
- 3.2 Industry impact forces
- 3.2.1 Growth drivers
- 3.2.2 Industry pitfalls and challenges
- 3.2.3 Market opportunities
- 3.3 Growth potential analysis
- 3.4 Regulatory landscape
- 3.4.1 North America
- 3.4.2 Europe
- 3.4.3 Asia Pacific
- 3.4.4 Latin America
- 3.4.5 Middle East & Africa
- 3.5 Porter’s analysis
- 3.6 PESTEL analysis
- 3.7 Technology and innovation landscape
- 3.7.1 Current technological trends
- 3.7.2 Emerging technologies
- 3.8 Price trends
- 3.8.1 By region
- 3.8.2 By tag technology
- 3.9 Future market trends
- 3.10 Patent landscape
- 3.11 Trade statistics (HS code)
- 3.11.1 Major importing countries
- 3.11.2 Major exporting countries
- 3.12 Sustainability and environmental aspects
- 3.12.1 Sustainable practices
- 3.12.2 Waste reduction strategies
- 3.12.3 Energy efficiency in production
- 3.12.4 Eco-friendly initiatives
- 3.13 Carbon footprint consideration
Chapter 4 Competitive Landscape, 2025
- 4.1 Introduction
- 4.2 Company market share analysis
- 4.2.1 By region
- 4.2.1.1 North America
- 4.2.1.2 Europe
- 4.2.1.3 Asia Pacific
- 4.2.1.4 LATAM
- 4.2.1.5 MEA
- 4.2.1 By region
- 4.3 Company matrix analysis
- 4.4 Competitive analysis of major market players
- 4.5 Competitive positioning matrix
- 4.6 Key developments
- 4.6.1 Mergers & acquisitions
- 4.6.2 Partnerships & collaborations
- 4.6.3 New product launches
- 4.6.4 Expansion plans
Chapter 5 Market Estimates and Forecast, By Offering Type, 2022–2035 (USD Million)
- 5.1 Key trends
- 5.2 Platform & software
- 5.3 Hardware & sensing devices
- 5.4 Professional services
Chapter 6 Market Estimates and Forecast, By Commodity, 2022–2035 (USD Million)
- 6.1 Key trends
- 6.2 Coffee
- 6.2.1 Arabica
- 6.2.2 Robusta
- 6.2.3 Specialty & single-origin
- 6.3 Cocoa
- 6.3.1 Bulk cocoa
- 6.3.2 Fine flavor & single-origin
- 6.3.3 Certified organic
Chapter 7 Market Estimates and Forecast, By End User, 2022–2035 (USD Million)
- 7.1 Key trends
- 7.2 Upstream
- 7.2.1 Smallholder farmers
- 7.2.2 Cooperatives & farmer groups
- 7.2.3 Wet mills / fermentation centers
- 7.3 Midstream
- 7.3.1 Origin exporters & processors
- 7.3.2 Intl commodity traders
- 7.4 Downstream
- 7.4.1 Roasters & blenders
- 7.4.2 Chocolate & confectionery manufacturers
- 7.4.3 Consumer brands & private label
- 7.4.4 Food service & specialty retailers
- 7.5 Certifiers & regulatory bodies
Chapter 8 Market Estimates and Forecast, By Region, 2022–2035 (USD Million) (Kilo Tons)
- 8.1 Key trends
- 8.2 North America
- 8.2.1 U.S.
- 8.2.2 Canada
- 8.3 Europe
- 8.3.1 Germany
- 8.3.2 UK
- 8.3.3 France
- 8.3.4 Spain
- 8.3.5 Italy
- 8.3.6 Rest of Europe
- 8.4 Asia Pacific
- 8.4.1 China
- 8.4.2 India
- 8.4.3 Japan
- 8.4.4 Australia
- 8.4.5 South Korea
- 8.4.6 Rest of Asia Pacific
- 8.5 Latin America
- 8.5.1 Brazil
- 8.5.2 Mexico
- 8.5.3 Argentina
- 8.5.4 Rest of Latin America
- 8.6 Middle East and Africa
- 8.6.1 Saudi Arabia
- 8.6.2 South Africa
- 8.6.3 UAE
- 8.6.4 Rest of Middle East and Africa
Chapter 9 Company Profiles
- 9.1 4c services
- 9.2 Agrolinking (agtrail)
- 9.3 Bunachain
- 9.4 Coolx
- 9.5 Corgo
- 9.6 Geocertify
- 9.7 Ice cot (iba)
- 9.8 Meridia (meridia verify)
- 9.9 Monitys
- 9.10 Open food chain
- 9.11 Palmyra ecosystem
- 9.12 Sourcemap
- 9.13 Tracextech
- 9.14 Trustrace


