


 |
市場調查報告書
商品編碼
2101599
2026 年至 2035 年小型模組化核子反應爐的市場機會、成長要素、產業趨勢分析與預測。Small Modular Reactor Market Opportunity, Growth Drivers, Industry Trend Analysis, and Forecast 2026 - 2035 |
||||||

全球小型模組化反應器(SMR)市場預計到 2025 年將達到 36 億美元,年複合成長率為 12.7%,到 2035 年將達到 156 億美元。
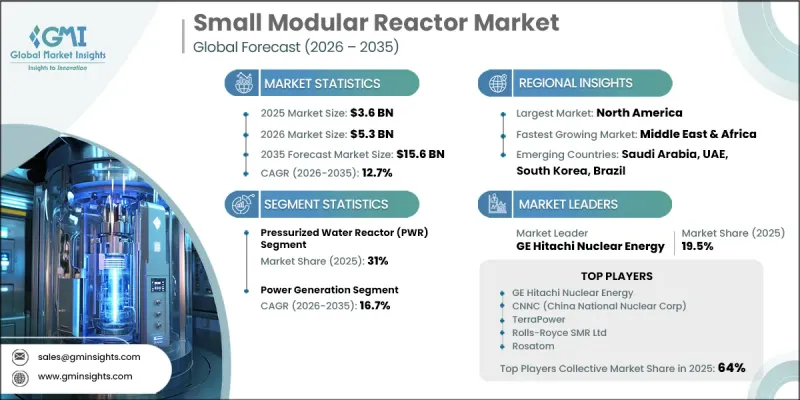
隨著各國加大對綠能生產、能源安全和長期脫碳目標的投入,小型模組化反應器(SMO)市場正蓬勃發展。數位基礎設施的擴張、交通運輸的電氣化以及工業的現代化推動了電力消耗量的成長,從而對可靠的低碳發電技術產生了持續的需求。 SMO 因其可靠的發電能力、靈活的部署方式以及更小的面積而日益受到認可,成為一種極具吸引力的解決方案。與傳統的大規模核能發電不同,這些核子反應爐可以部署在容量小規模的機組中,以更好地滿足當地的能源需求,同時最大限度地減少對輸電基礎設施進行大規模升級的需求。先進核子反應爐研發的持續進展、有利的法律規範以及政府支持的不斷增加,進一步改善了全球商業化的前景。老舊傳統核電廠的退役進一步加速了對可靠基本負載電力的需求,鞏固了 SMO 作為未來能源系統關鍵組成部分的地位。這些結構性市場促進因素將繼續支持長期投資,並增強全球 SMO 市場的成長機會。
| 市場範圍 | |
|---|---|
| 開始年份 | 2025 |
| 預測期 | 2026-2035 |
| 上市時的市場規模 | 36億美元 |
| 預測金額 | 156億美元 |
| 複合年成長率 | 12.7% |
預計到2025年,壓水式反應爐(PWR)市佔率將達到31%,到2035年將維持16.3%的複合年成長率。該領域之所以能保持主導地位,是因為壓水式反應爐技術擁有許多優勢,例如豐富的運作經驗、成熟的燃料管理方法、經過驗證的安全系統以及成熟的工程能力。這項強大的技術基礎使開發人員能夠將其現有專業知識應用於小型核子反應爐的設計,從而獲得監管機構的信任並加速商業化進程。
預計到2025年,發電領域將佔80%的市場佔有率,並預計在2026年至2035年間以16.7%的複合年成長率成長。發電仍然是大多數新興小型模組化反應器設計的主要應用領域,這反映了市場對穩定、可調、低碳電力的日益成長的需求。能源密集產業對確保可靠電力供應的日益重視也推動了對小型模組化反應器技術的投資增加,從而增強了對整個發電領域的長期需求。
預計到2025年,北美小規模模組化核子反應爐市場佔有率將達到47%,並在2035年之前以15.1%的複合年成長率成長。該地區憑藉其先進的核能法規環境、強力的政府資金支持、不斷成長的私營部門參與以及支持核子反應爐開發和部署的成熟商業性夥伴關係,持續引領市場。對清潔能源基礎設施的持續投資和有利的政策支持預計將使北美在整個預測期內保持主導地位。
目錄
第1章:調查方法和範圍
第2章執行摘要
第3章 行業洞察
- 產業生態系統
- 原物料供應及採購分析
- 生產能力評估
- 供應鏈韌性與風險因素
- 配電網路分析
- 監理情勢
- 北美洲
- 歐洲
- 亞太地區
- 中東和非洲
- 拉丁美洲
- 影響產業的因素
- 促進因素
- 產業潛在風險與挑戰
- 成長潛力分析
- 波特的分析
- PESTLE分析
- 成本結構分析:小型模組化核子反應爐
- 價格趨勢分析
- 美元/兆瓦(按容量計)
- 依球員類型分類的定價策略(高級球員、超值球員、成本加成球員)
- 生產能力和運轉率
- 各地區的生產能力
- 運轉率
- 人工智慧和生成式人工智慧對市場的影響
- 預測性維護和故障檢測
- 電網最佳化和負載預測
- 利用數位孿生進行模擬和測試
- 風險、限制和監管考量
- 新機會與趨勢
- 數位化和物聯網整合
- 進入新興市場
- 整體投資情勢與未來展望
第4章 競爭情勢
- 介紹
- 企業市佔率分析:按地區分類
- 北美洲
- 歐洲
- 亞太地區
- 中東和非洲
- 拉丁美洲
- 主要市場公司的競爭分析
- 競爭定位矩陣
- 主要進展
- 併購
- 夥伴關係和聯盟
- 新產品發布
- 業務拓展計劃及資金籌措
- 按公司規模進行基準測試
- 排名分類標準與遴選標準
- 按銷售額、地區和創新能力分類的層級定位矩陣。
第5章 市場規模及預測:依反應器類型分類,2022-2035年
- PWR
- BWR
- 快中子
- HTGR
- 熔鹽/FHR
- 其他
第6章 市場規模與預測:依應用領域分類,2022-2035年
- 發電
- 工業和工藝熱
- 氫氣生產
- 海水淡化和水處理
- 調查/核實
第7章 市場規模及預測:依性別分類的互聯互通情況,2022-2035年
- 並網型
- 離網/遠程
第8章 市場規模及預測:依地區分類,2022-2035年
- 陸基
- 海上/浮體式
第9章 市場規模及預測:依產能分類,2022-2035年
- 小於50兆瓦
- 50~100 MW
- 101~300 MW
- 超過300兆瓦
第10章 市場規模及預測:依最終用途分類,2022-2035年
- 公用事業
- 政府/國家企業
- 工業企業
- 資料中心
- 其他
第11章 市場規模及預測:依地區分類,2022-2035年
- 北美洲
- 美國
- 加拿大
- 歐洲
- 英國
- 波蘭
- 羅馬尼亞
- 俄羅斯
- 法國
- 亞太地區
- 中國
- 韓國
- 日本
- 印度
- 中東和非洲
- 沙烏地阿拉伯
- UAE
- 南非
- 拉丁美洲
- 阿根廷
- 巴西
第12章:公司簡介
- ARC Clean Technology
- CNNC
- EDF
- GE Hitachi Nuclear Energy
- General Atomics
- Holtec International
- Huaneng Group
- Kairos Power
- Moltex Energy
- NuScale Power
- Oklo Inc.
- Rolls-Royce SMR Ltd
- Rosatom
- Seaborg Technologies
- TerraPower
- Terrestrial Energy
- ThorCon Power
- Ultra Safe Nuclear Corporation
- Westinghouse Electric Company
- X-energy
The Global Small Modular Reactor Market was valued at USD 3.6 billion in 2025 and is estimated to grow at a CAGR of 12.7% to reach USD 15.6 billion by 2035.
The small modular reactor market is gaining significant momentum as countries strengthen their focus on clean electricity generation, energy security, and long-term decarbonization goals. Growing electricity consumption, driven by expanding digital infrastructure, transportation electrification, and industrial modernization, is creating sustained demand for reliable, low-carbon power generation technologies. Small modular reactors are increasingly recognized as an attractive solution because they combine dependable electricity generation with flexible deployment and reduced land requirements. Unlike conventional large-scale nuclear facilities, these reactors can be deployed in smaller capacity increments that better align with regional energy demand while minimizing the need for extensive transmission infrastructure upgrades. Ongoing progress in advanced reactor development, favorable regulatory frameworks, and increasing government support continue to improve commercialization prospects worldwide. The retirement of aging conventional power generation facilities is further accelerating demand for dependable baseload electricity, positioning small modular reactors as an important component of future energy systems. These structural market drivers continue to support long-term investment and strengthen growth opportunities across the global small modular reactor market.
| Market Scope | |
|---|---|
| Start Year | 2025 |
| Forecast Year | 2026-2035 |
| Start Value | $3.6 Billion |
| Forecast Value | $15.6 Billion |
| CAGR | 12.7% |
The pressurized water reactor (PWR) segment accounted for 31% share in 2025 and is projected to register a CAGR of 16.3% through 2035. The segment maintains its leading position because pressurized water reactor technology benefits from extensive operational experience, well-established fuel management practices, proven safety frameworks, and mature engineering capabilities. This strong technological foundation allows developers to adapt existing expertise to compact reactor designs while supporting regulatory confidence and accelerating commercial deployment.
The power generation segment held 80% share in 2025 and is anticipated to grow at a CAGR of 16.7% during 2026-2035. Electricity production continues to be the primary application for most emerging small modular reactor designs, reflecting growing demand for stable and dispatchable low-carbon power. Increasing interest from energy-intensive industries in securing reliable electricity supplies is also supporting stronger investment in small modular reactor technologies, reinforcing long-term demand across the power generation segment.
North America Small Modular Reactor Market held a 47% share in 2025 and is expected to grow at a CAGR of 15.1% through 2035. The region continues to lead the market due to its advanced nuclear regulatory environment, strong government funding initiatives, expanding private-sector participation, and well-established commercial partnerships supporting reactor development and deployment. Continued investment in clean energy infrastructure and favorable policy support are expected to sustain North America's leadership throughout the forecast period.
Major companies operating in the global small modular reactor market include NuScale Power, TerraPower, Westinghouse Electric Company, GE Hitachi Nuclear Energy, Rolls-Royce SMR Ltd, X-energy, Holtec International, Kairos Power, ARC Clean Technology, Terrestrial Energy, Moltex Energy, Oklo Inc., ThorCon Power, Seaborg Technologies, Ultra Safe Nuclear Corporation, General Atomics, EDF, Rosatom (NIKIET), CNNC (China National Nuclear Corp), and Huaneng Group. Companies operating in the small modular reactor market are strengthening their competitive position by investing heavily in advanced reactor research, technology development, and commercialization initiatives. Manufacturers continue to focus on improving reactor safety, operational efficiency, and modular construction methods to reduce project costs and accelerate deployment timelines. Strategic collaborations with governments, utilities, engineering firms, and technology partners are supporting project development and expanding commercial opportunities.
Table of Contents
Chapter 1 Methodology & Scope
- 1.1 Research design
- 1.2 Quality commitment
- 1.2.1 GMI AI policy & data integrity commitment
- 1.2.1.1 Source consistency protocol
- 1.2.1 GMI AI policy & data integrity commitment
- 1.3 Research Trail & Confidence Scoring
- 1.3.1 Research Trail Components
- 1.3.2 Scoring Components
- 1.4 Data Collection
- 1.4.1 Partial list of primary sources
- 1.5 Data mining sources
- 1.5.1 Paid sources
- 1.5.1.1 Sources, by region
- 1.5.1 Paid sources
- 1.6 Base estimates and calculations
- 1.6.1 Base year calculation for any one approach
- 1.7 Forecast model
- 1.8 Research transparency addendum
- 1.8.1 Source attribution framework
- 1.8.2 Quality assurance metrics
- 1.8.3 Our commitment to trust
- 1.9 Market definitions
Chapter 2 Executive Summary
- 2.1 Industry synopsis, 2022 - 2035
- 2.2 Business trends
- 2.3 Reactor type trends
- 2.4 Application trends
- 2.5 Connectivity trends
- 2.6 Location trends
- 2.7 Capacity trends
- 2.8 End use trends
- 2.9 Regional trends
Chapter 3 Industry Insights
- 3.1 Industry ecosystem
- 3.1.1 Raw material availability & sourcing analysis
- 3.1.2 Manufacturing capacity assessment
- 3.1.3 Supply chain resilience & risk factors
- 3.1.4 Distribution network analysis
- 3.2 Regulatory landscape
- 3.2.1 North America
- 3.2.2 Europe
- 3.2.3 Asia Pacific
- 3.2.4 Middle East & Africa
- 3.2.5 Latin America
- 3.3 Industry impact forces
- 3.3.1 Growth drivers
- 3.3.2 Industry pitfalls & challenges
- 3.4 Growth potential analysis
- 3.5 Porter's analysis
- 3.5.1 Bargaining power of suppliers
- 3.5.2 Bargaining power of buyers
- 3.5.3 Threat of new entrants
- 3.5.4 Threat of substitutes
- 3.6 PESTEL analysis
- 3.6.1 Political factors
- 3.6.2 Economic factors
- 3.6.3 Social factors
- 3.6.4 Technological factors
- 3.6.5 Legal factors
- 3.6.6 Environmental factors
- 3.7 Cost structure analysis of small modular reactor
- 3.8 Price trend analysis (Driven by Primary Research)
- 3.8.1 By capacity USD/MW (Driven by Primary Research)
- 3.8.2 Pricing strategy by player type (Premium / Value / Cost-plus) (Driven by Primary Research)
- 3.9 Production capacity & utilization (Driven by Primary Research)
- 3.9.1 Production capacity by region (Driven by Primary Research)
- 3.9.2 Utilization rates (Driven by Primary Research)
- 3.10 Impact of AI & generative AI on the market
- 3.10.1 Predictive maintenance & fault detection
- 3.10.2 Grid optimization & load forecasting
- 3.10.3 Digital twin simulation & testing
- 3.10.4 Risks, limitations & regulatory considerations
- 3.11 Emerging opportunities & trends
- 3.11.1 Digitalization & IoT integration
- 3.11.2 Emerging market penetration
- 3.12 Overall investment scenario and future outlook
Chapter 4 Competitive landscape, 2026
- 4.1 Introduction
- 4.2 Company market share analysis, by region, 2025
- 4.2.1 North America
- 4.2.2 Europe
- 4.2.3 Asia Pacific
- 4.2.4 Middle East & Africa
- 4.2.5 Latin America
- 4.3 Competitive analysis of major market players
- 4.4 Competitive positioning matrix
- 4.5 Key developments
- 4.5.1 Mergers & acquisitions
- 4.5.2 Partnerships & collaborations
- 4.5.3 New product launches
- 4.5.4 Expansion plans & funding
- 4.6 Company tier benchmarking
- 4.6.1 Tier classification criteria & qualifying thresholds
- 4.6.2 Tier positioning matrix by revenue, geography & innovation
Chapter 5 Market Size and Forecast, By Reactor type, 2022 - 2035 (USD Billion & MW)
- 5.1 Key trends
- 5.2 PWR
- 5.3 BWR
- 5.4 Fast neutron
- 5.5 HTGR
- 5.6 Molten salt / FHR
- 5.7 Others
Chapter 6 Market Size and Forecast, By Application, 2022 - 2035 (USD Billion & MW)
- 6.1 Key trends
- 6.2 Power generation
- 6.3 Industrial & process heat
- 6.4 Hydrogen production
- 6.5 Desalination & water treatment
- 6.6 Research / demonstration
Chapter 7 Market Size and Forecast, By Connectivity, 2022 - 2035 (USD Billion & MW)
- 7.1 Key trends
- 7.2 Grid-connected
- 7.3 Off-grid / remote
Chapter 8 Market Size and Forecast, By Location, 2022 - 2035 (USD Billion & MW)
- 8.1 Key trends
- 8.2 Land-based
- 8.3 Marine-based / floating
Chapter 9 Market Size and Forecast, By Capacity, 2022 - 2035 (USD Billion & MW)
- 9.1 Key trends
- 9.2 Below 50 MW
- 9.3 50-100 MW
- 9.4 101-300 MW
- 9.5 Above 300 MW
Chapter 10 Market Size and Forecast, By End use, 2022 - 2035 (USD Billion & MW)
- 10.1 Key trends
- 10.2 Utilities
- 10.3 Government / state enterprises
- 10.4 Industrial operators
- 10.5 Data centers
- 10.6 Others
Chapter 11 Market Size and Forecast, By Region, 2022 - 2035 (USD Billion & MW)
- 11.1 Key trends
- 11.2 North America
- 11.2.1 U.S.
- 11.2.2 Canada
- 11.3 Europe
- 11.3.1 UK
- 11.3.2 Poland
- 11.3.3 Romania
- 11.3.4 Russia
- 11.3.5 France
- 11.4 Asia Pacific
- 11.4.1 China
- 11.4.2 South Korea
- 11.4.3 Japan
- 11.4.4 India
- 11.5 Middle East & Africa
- 11.5.1 Saudi Arabia
- 11.5.2 UAE
- 11.5.3 South Africa
- 11.6 Latin America
- 11.6.1 Argentina
- 11.6.2 Brazil
Chapter 12 Company Profiles
- 12.1 ARC Clean Technology
- 12.2 CNNC
- 12.3 EDF
- 12.4 GE Hitachi Nuclear Energy
- 12.5 General Atomics
- 12.6 Holtec International
- 12.7 Huaneng Group
- 12.8 Kairos Power
- 12.9 Moltex Energy
- 12.10 NuScale Power
- 12.11 Oklo Inc.
- 12.12 Rolls-Royce SMR Ltd
- 12.13 Rosatom
- 12.14 Seaborg Technologies
- 12.15 TerraPower
- 12.16 Terrestrial Energy
- 12.17 ThorCon Power
- 12.18 Ultra Safe Nuclear Corporation
- 12.19 Westinghouse Electric Company
- 12.20 X-energy

 2026年小型模組化反應器全球市場報告
 小型模組化反應器市場預測(2034 年)—全球分析(按反應器類型、冷卻劑類型、功率輸出、部署模式、應用、最終用戶、建造方法、燃料類型、模組製造方法和地區分類)
 小型模組化反應器市場-2026-2032年全球市場預測
 小型模組化爐市場:按爐型、連接類型、應用和地區分類
 2026-2034年全球小型模組化反應器(SMR)市場規模、佔有率、趨勢和成長分析報告全球小型模組化反應器市場:市場規模、佔有率、成長率、產業分析、依類型、應用和地區劃分的考量、未來預測(2026-2034)
 小型模組化反應器 (SMR):技術、應用和用例
 小型模組化反應器的全球市場
 小型模組化反應器市場規模、佔有率和成長分析(按核子反應爐類型、部署、容量、應用和地區)- 2025-2032 年產業預測
 小型模組化反應器的全球市場,2025-2029