


 |
市場調查報告書
商品編碼
2101562
工業設施拆除拆卸市場機會、成長要素、產業趨勢分析及2026-2035年預測Industrial Decommissioning Market Opportunity, Growth Drivers, Industry Trend Analysis, and Forecast 2026 - 2035 |
||||||

全球工業設施拆除和拆卸市場預計到 2025 年將達到 161 億美元,並以 7.2% 的複合年成長率成長,到 2035 年將達到 324 億美元。
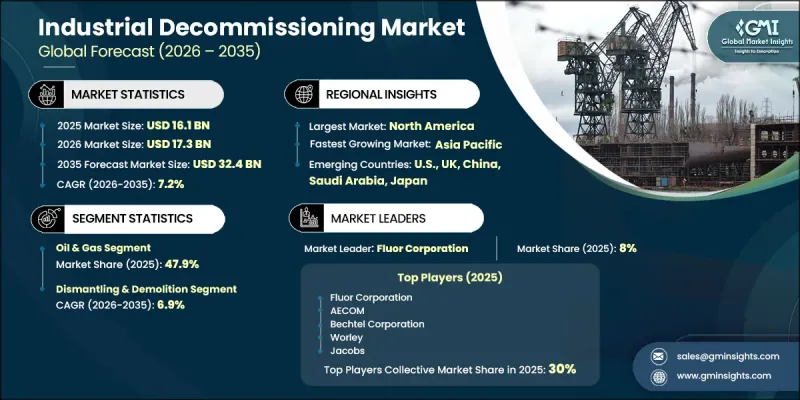
市場成長的驅動力來自石油天然氣、發電和化學產業老舊工業基礎設施的退役,這些設施正接近其運作的終點。日益嚴格的環境合規要求和法律規範促使營運商實施系統性的退役,同時最大限度地減少長期環境責任。能源轉型舉措投資的增加也為場地修復和再開發創造了機遇,從而提升了對綜合退役解決方案的需求。同時,現有工業設施的再利用正成為最佳化土地利用和支持未來基礎設施發展的關鍵策略。不斷上漲的維護成本、保險費以及更嚴格的資產健康評估迫使企業加快資產處置決策。此外,企業擴大將退役納入長期資產生命週期規劃,而不是將其視為一次性營運支出。這種向計劃性退役方案的轉變,正在為已開發國家和開發中國家的工程、諮詢、拆除、環境修復和專案管理服務供應商拓展商機。
| 市場範圍 | |
|---|---|
| 開始年份 | 2025 |
| 預測期 | 2026-2035 |
| 初始市場規模 | 161億美元 |
| 預測金額 | 324億美元 |
| 複合年成長率 | 7.2% |
預計到2025年,石油和天然氣行業將佔據47.9%的市場佔有率,並在2035年之前以6.8%的複合年成長率成長。該行業持續主導地位,主要得益於其在老舊上游、中游和下游基礎設施建設方面積累的豐富經驗,這些基礎設施需要進行系統的退役和場地修復。監管設施關閉和資產健康狀況的相關義務仍然是退役活動的主要驅動力,因此,儘管大宗商品價格波動,但需求仍然相對穩定。隨著工業營運商在滿足環境和營運合規標準的前提下繼續退役老舊設施,預計在整個預測期內,石油和天然氣行業對專業退役服務的需求將保持強勁。
預計到2025年,拆除和清理業務將佔據27.5%的市場佔有率,並在2026年至2035年間以6.9%的複合年成長率成長。該業務板塊作為工業設施拆除和清理專案的基礎階段,持續發揮至關重要的作用,因為它涉及安全拆除各個工業領域的工業建築、生產設備、加工單元和配套基礎設施。拆除承包商需要先進的重型機械、經驗豐富的多學科人員以及嚴格的安全規程,才能在兼顧環境保護和遵守相關行業法規的前提下,管理複雜的拆除工作。拆除工作的技術複雜性不斷提升,也使得專業服務供應商在工業設施拆除和清理市場的重要性日益凸顯。
至2025年,北美工業設施拆除和退役市佔率將達到34.9%。該地區保持主導地位的原因在於,多個終端用戶行業中存在大量需要退役的老舊工業資產。美國仍是區域需求的主要驅動力,這得益於各主要產業部門持續進行的退役活動,以及在遵守環境法規、基礎設施現代化和工業用地改造方面的持續投資。
目錄
第1章:調查方法和範圍
第2章執行摘要
第3章 行業洞察
- 產業生態系分析
- 原物料供應及採購分析
- 生產能力評估
- 供應鏈韌性與風險因素
- 配電網路分析
- 影響產業的因素
- 促進因素
- 產業潛在風險與挑戰
- 監理情勢
- 成長潛力分析
- 波特的分析
- PESTLE分析
- 成本結構分析:工業設施的拆除與退役
- 新的退役機會與產業轉型
- 智慧退役技術、自動化與數位資產管理
- 老化的工業基礎設施和高成長地區的商業擴張機會
- 資本投資、策略發展與長期市場展望
- 人工智慧和生成式人工智慧對市場的影響
- 利用人工智慧最佳化生產
- 預測性維護和故障檢測
第4章 競爭情勢
- 介紹
- 企業市佔率分析:按地區分類
- 北美洲
- 歐洲
- 亞太地區
- 中東和非洲
- 拉丁美洲
- 主要市場公司的競爭分析
- 競爭定位矩陣
- 主要進展
- 併購
- 夥伴關係和聯盟
- 新產品發布
- 業務拓展計劃及資金籌措
- 按公司規模進行基準測試
- 排名分類標準與遴選標準
- 按銷售額、地區和創新能力分類的層級定位矩陣。
第5章 市場規模及預測:依最終用途分類,2022-2035年
- 石油和天然氣
- 發電
- 化工/石油化工
- 採礦和金屬
- 製造業
- 海洋/造船
- 航太/國防
- 其他
第6章 市場規模及預測:依服務類型分類,2022-2035年
- 專案規劃與監理合規
- 工程和諮詢服務
- 資產退役和營運終止管理
- 消毒服務
- 拆除/移除
- 廢棄物管理和處置
- 場地清理與環境修復
- 資源回收再利用
第7章 市場規模及預測:依方法論分類,2022-2035年
- 完全移除
- 部分移除
- 暫時停用/維護/維護管理
- 資產再利用和再開發
- 該場地的退役措施
第8章 市場規模及預測:依資產類型分類,2022-2035年
- 建築物和構築物
- 製程設備
- 管道和儲存槽
- 鍋爐和壓力容器
- 電氣和控制系統
- 公共產業基礎設施
- 海洋平台
- 重型工業機械
第9章 市場規模及預測:依專案規模分類,2022-2035年
- 小規模
- 中號
- 大規模
- 超大規模
第10章 市場規模及預測:依地區分類,2022-2035年
- 北美洲
- 美國
- 加拿大
- 墨西哥
- 歐洲
- 英國
- 德國
- 法國
- 義大利
- 西班牙
- 荷蘭
- 挪威
- 丹麥
- 波蘭
- 瑞典
- 亞太地區
- 中國
- 日本
- 印度
- 韓國
- 澳洲
- 紐西蘭
- 印尼
- 馬來西亞
- 泰國
- 中東和非洲
- 沙烏地阿拉伯
- UAE
- 卡達
- 科威特
- 阿曼
- 拉丁美洲
- 巴西
- 阿根廷
- 智利
第11章:公司簡介
- AECOM
- AF Gruppen
- Aker Solutions
- Amentum Services
- AtkinsRealis
- Babcock International Group
- Baker Hughes Company
- Bechtel Corporation
- CLEAN HARBORS
- Enviri Corporation
- Fluor Corporation
- Halliburton
- Jacobs
- KBR
- Ramboll
- REMONDIS
- SLB
- Stantec
- TechnipFMC
- Tetra Tech
- Tradebe Environmental Services
- Veolia
- Wood
- Worley
The Global Industrial Decommissioning Market was valued at USD 16.1 billion in 2025 and is estimated to grow at a CAGR of 7.2% to reach USD 32.4 billion by 2035.
Market growth is supported by the increasing retirement of aging industrial infrastructure across the oil & gas, power generation, and chemical processing industries, where facilities are approaching the end of their operational lifespan. Rising environmental compliance requirements and stricter regulatory oversight are encouraging operators to undertake structured decommissioning activities while minimizing long-term environmental liabilities. Growing investments in energy transition initiatives are also creating opportunities for site restoration and redevelopment, increasing demand for comprehensive decommissioning solutions. At the same time, the repurposing of existing industrial facilities is becoming an important strategy for optimizing land utilization and supporting future infrastructure development. Higher maintenance costs, rising insurance expenses, and more rigorous asset integrity evaluations are prompting organizations to accelerate decisions regarding asset retirement. In addition, businesses are increasingly incorporating decommissioning into long-term asset lifecycle planning rather than treating it as a one-time operational expense. This shift toward planned decommissioning programs is expanding opportunities for engineering, consulting, dismantling, environmental remediation, and project management service providers across developed and developing economies.
| Market Scope | |
|---|---|
| Start Year | 2025 |
| Forecast Year | 2026-2035 |
| Start Value | $16.1 Billion |
| Forecast Value | $32.4 Billion |
| CAGR | 7.2% |
The oil & gas segment accounted for 47.9% share in 2025 and is projected to grow at a CAGR of 6.8% through 2035. The continued dominance of this segment is supported by the large installed base of aging upstream, midstream, and downstream infrastructure requiring systematic retirement and site restoration. Regulatory obligations governing facility closure and asset integrity remain the primary drivers of decommissioning activity, allowing demand to remain comparatively stable regardless of fluctuations in commodity prices. As industrial operators continue to retire aging facilities while meeting environmental and operational compliance standards, demand for specialized decommissioning services within the oil & gas sector is expected to remain strong throughout the forecast period.
The dismantling and demolition segment 27.5% share in 2025 and is expected to grow at a CAGR of 6.9% from 2026 to 2035. This segment continues to serve as a fundamental stage of industrial decommissioning projects because it involves the safe removal of industrial structures, production equipment, processing units, and supporting infrastructure across multiple industries. Decommissioning contractors require advanced heavy equipment, experienced multidisciplinary workforces, and strict safety protocols to manage complex demolition activities while addressing environmental considerations and maintaining compliance with applicable industry regulations. The technical complexity associated with dismantling operations continues to reinforce the importance of specialized service providers within the industrial decommissioning market.
North America Industrial Decommissioning Market held a 34.9% share in 2025. The region maintains its leadership due to the substantial number of aging industrial assets requiring retirement across multiple end-use industries. The United States remains the primary contributor to regional demand, supported by ongoing decommissioning activities across major industrial sectors and continued investments in environmental compliance, infrastructure modernization, and industrial site redevelopment.
Key companies operating in the global industrial decommissioning market include AECOM, AF Gruppen, Aker Solutions, Amentum Services, AtkinsRealis, Babcock International Group, Baker Hughes Company, Bechtel Corporation, CLEAN HARBORS, Enviri Corporation, Fluor Corporation, Halliburton, Jacobs, KBR, Ramboll, REMONDIS, SLB, Stantec, TechnipFMC, Tetra Tech, Tradebe Environmental Services, Veolia, Wood, and Worley. Companies operating in the industrial decommissioning market are strengthening their market position by expanding their end-to-end service capabilities and investing in advanced engineering expertise. Many providers focus on delivering integrated solutions that combine project planning, dismantling, waste management, environmental remediation, and site restoration to improve operational efficiency for clients.
Table of Contents
Chapter 1 Methodology & Scope
- 1.1 Research approach
- 1.2 Quality commitments
- 1.2.1 GMI AI policy & data integrity commitment
- 1.2.1.1 Source consistency protocol
- 1.2.1 GMI AI policy & data integrity commitment
- 1.3 Research trail & confidence scoring
- 1.3.1 Research trail components
- 1.3.2 Scoring components
- 1.4 Data collection
- 1.4.1 Partial list of primary sources
- 1.5 Data mining sources
- 1.5.1 Paid sources
- 1.5.1.1 Sources, by region
- 1.5.1 Paid sources
- 1.6 Base estimates and calculations
- 1.6.1 Base year calculation for any one approach
- 1.7 Market estimates & forecasts parameters
- 1.8 Forecast model
- 1.8.1 Quantified market impact analysis
- 1.8.1.1 Mathematical impact of growth parameters on forecast
- 1.8.1 Quantified market impact analysis
- 1.9 Research transparency addendum
- 1.9.1 Source attribution framework
- 1.9.2 Quality assurance metrics
- 1.9.3 Our commitment to trust
- 1.10 Market definitions
Chapter 2 Executive Summary
- 2.1 Industry synopsis, 2022 - 2035
- 2.1.1 Business trends
- 2.1.2 End use trends
- 2.1.3 Service trends
- 2.1.4 Method trends
- 2.1.5 Asset type trends
- 2.1.6 Project size trends
- 2.1.7 Regional trends
Chapter 3 Industry Insights
- 3.1 Industry ecosystem analysis
- 3.1.1 Raw material availability & sourcing analysis
- 3.1.2 Manufacturing capacity assessment
- 3.1.3 Supply chain resilience & risk factors
- 3.1.4 Distribution network analysis
- 3.2 Industry impact forces
- 3.2.1 Growth drivers
- 3.2.2 Industry pitfalls & challenges
- 3.3 Regulatory landscape
- 3.4 Growth potential analysis
- 3.5 Porter's analysis
- 3.5.1 Bargaining power of suppliers
- 3.5.2 Bargaining power of buyers
- 3.5.3 Threat of new entrants
- 3.5.4 Threat of substitutes
- 3.6 PESTEL analysis
- 3.6.1 Political factors
- 3.6.2 Economic factors
- 3.6.3 Social factors
- 3.6.4 Technological factors
- 3.6.5 Legal factors
- 3.6.6 Environmental factors
- 3.7 Cost structure analysis of industrial decommissioning
- 3.8 Emerging decommissioning opportunities & industry transformation
- 3.9 Smart decommissioning technologies, automation & digital asset management
- 3.10 Expansion opportunities across aging industrial infrastructure & high-growth regions
- 3.11 Capital investments, strategic developments & long-term market outlook
- 3.12 Impact of AI & Generative AI on the market (Driven by Primary Research)
- 3.12.1 AI-Driven production optimization (Driven by Primary Research)
- 3.12.2 Predictive maintenance & fault detection (Driven by Primary Research)
Chapter 4 Competitive Landscape, 2026
- 4.1 Introduction
- 4.2 Company market share analysis, by region, 2025
- 4.2.1 North America
- 4.2.2 Europe
- 4.2.3 Asia Pacific
- 4.2.4 Middle East & Africa
- 4.2.5 Latin America
- 4.3 Competitive analysis of major market players
- 4.4 Competitive positioning matrix
- 4.5 Key developments
- 4.5.1 Mergers & acquisitions
- 4.5.2 Partnerships & collaborations
- 4.5.3 New product launches
- 4.5.4 Expansion plans & funding
- 4.6 Company tier benchmarking
- 4.6.1 Tier classification criteria & qualifying thresholds
- 4.6.2 Tier positioning matrix by revenue, geography & innovation
Chapter 5 Market Size and Forecast, By End Use, 2022 - 2035 (USD Million)
- 5.1 Key trends
- 5.2 Oil & gas
- 5.3 Power generation
- 5.4 Chemical & petrochemical
- 5.5 Mining & metals
- 5.6 Manufacturing
- 5.7 Marine & shipbuilding
- 5.8 Aerospace & defense
- 5.9 Others
Chapter 6 Market Size and Forecast, By Service, 2022 - 2035 (USD Million)
- 6.1 Key trends
- 6.2 Project planning & regulatory compliance
- 6.3 Engineering & consulting services
- 6.4 Asset retirement & shutdown management
- 6.5 Decontamination services
- 6.6 Dismantling & demolition
- 6.7 Waste management & disposal
- 6.8 Site remediation & environmental restoration
- 6.9 Material recovery & recycling
Chapter 7 Market Size and Forecast, By Method, 2022 - 2035 (USD Million)
- 7.1 Key trends
- 7.2 Full removal
- 7.3 Partial removal
- 7.4 Mothballing/ care & maintenance
- 7.5 Asset repurpose & redevelopment
- 7.6 In-situ decommissioning
Chapter 8 Market Size and Forecast, By Asset Type, 2022 - 2035 (USD Million)
- 8.1 Key trends
- 8.2 Buildings & structures
- 8.3 Process equipment
- 8.4 Pipelines & storage tanks
- 8.5 Boilers & pressure vessels
- 8.6 Electrical & control systems
- 8.7 Utility infrastructure
- 8.8 Offshore platforms
- 8.9 Heavy industrial machinery
Chapter 9 Market Size and Forecast, By Project Size, 2022 - 2035 (USD Million)
- 9.1 Key trends
- 9.2 Small-scale
- 9.3 Medium-scale
- 9.4 Large-scale
- 9.5 Mega-scale
Chapter 10 Market Size and Forecast, By Region, 2022 - 2035 (USD Million)
- 10.1 Key trends
- 10.2 North America
- 10.2.1 U.S.
- 10.2.2 Canada
- 10.2.3 Mexico
- 10.3 Europe
- 10.3.1 UK
- 10.3.2 Germany
- 10.3.3 France
- 10.3.4 Italy
- 10.3.5 Spain
- 10.3.6 Netherlands
- 10.3.7 Norway
- 10.3.8 Denmark
- 10.3.9 Poland
- 10.3.10 Sweden
- 10.4 Asia Pacific
- 10.4.1 China
- 10.4.2 Japan
- 10.4.3 India
- 10.4.4 South Korea
- 10.4.5 Australia
- 10.4.6 New Zealand
- 10.4.7 Indonesia
- 10.4.8 Malaysia
- 10.4.9 Thailand
- 10.5 Middle East & Africa
- 10.5.1 Saudi Arabia
- 10.5.2 UAE
- 10.5.3 Qatar
- 10.5.4 Kuwait
- 10.5.5 Oman
- 10.6 Latin America
- 10.6.1 Brazil
- 10.6.2 Argentina
- 10.6.3 Chile
Chapter 11 Company Profiles
- 11.1 AECOM
- 11.2 AF Gruppen
- 11.3 Aker Solutions
- 11.4 Amentum Services
- 11.5 AtkinsRealis
- 11.6 Babcock International Group
- 11.7 Baker Hughes Company
- 11.8 Bechtel Corporation
- 11.9 CLEAN HARBORS
- 11.10 Enviri Corporation
- 11.11 Fluor Corporation
- 11.12 Halliburton
- 11.13 Jacobs
- 11.14 KBR
- 11.15 Ramboll
- 11.16 REMONDIS
- 11.17 SLB
- 11.18 Stantec
- 11.19 TechnipFMC
- 11.20 Tetra Tech
- 11.21 Tradebe Environmental Services
- 11.22 Veolia
- 11.23 Wood
- 11.24 Worley

 2026年全球核能除役服務市場報告
 全球核能發電廠退役服務市場規模、佔有率、趨勢及成長分析報告(2026-2034年)
 除役核能發電廠市場-2026-2032年全球市場預測
 核能設施退役服務市場:市場機會、成長要素、產業趨勢分析及2026-2035年預測
 核能工業無損檢測市場規模、佔有率和趨勢分析報告:按類型、應用、最終用途、地區和細分市場預測(2026-2033 年)
 核能除役服務市場-全球產業規模、佔有率、趨勢、機會、預測:依反應器類型、容量、應用、地區和競爭格局分類,2021-2031年
 全球核能發電廠數位雙胞胎銷售市場報告、競爭分析及區域機會(2026-2032年)2026年全球核能發電退役市場報告2026年全球核能除役數位雙胞胎市場報告核能拆除和除役市場(按設施類型、核子反應爐類型、計劃階段、服務類型、組件類型和最終用戶分類),全球預測,2026-2032年