

 |
市場調查報告書
商品編碼
2083387
授權玩具市場機會、成長要素、產業趨勢分析及2026-2035年預測Licensed Toy Market Opportunity, Growth Drivers, Industry Trend Analysis, and Forecast 2026 - 2035 |
||||||

據估計,到 2025 年,全球授權玩具市場價值將達到 485 億美元,年複合成長率為 5.5%,到 2035 年將達到 828 億美元。
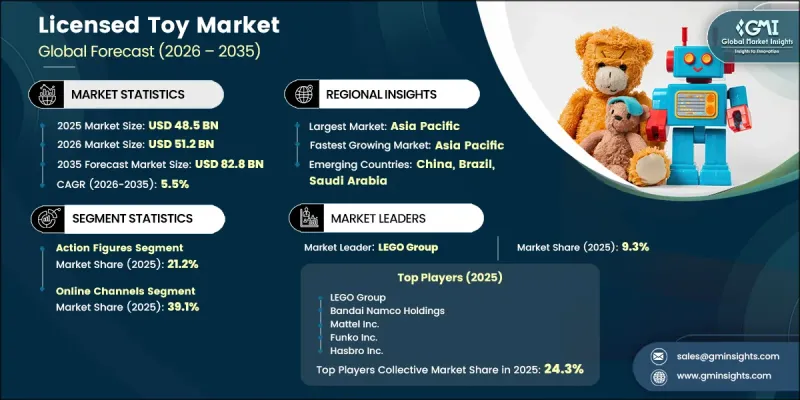
這一成長是由消費者群體結構性轉變所驅動的,成年收藏家如今已成為需求成長的主要驅動力,尤其是在高階收藏品和授權娛樂產品方面。智慧財產權(IP)與產品開發流程的日益整合也推動了市場的長期擴張,娛樂工作室和遊戲公司擴大將內容發布與實體產品的銷售聯繫起來。這種協調的生態系統確保了電影、串流平台和遊戲的新作品都能得到零售玩具專案的直接支援。強大的授權生態系統在北美和亞太地區尤為顯著,娛樂特許經營權和遊戲IP持續吸引著從兒童到成人的廣泛人群。數位優先的IP向實體玩具形式的商業化進一步強化了授權管道。此外,IP擁有者和製造商之間不斷擴大的合作網路正在創建一個涵蓋玩具、收藏品和體驗產品的大型多品類產品生態系統。
| 市場範圍 | |
|---|---|
| 開始年份 | 2025 |
| 預測期 | 2026-2035 |
| 上市時的市場規模 | 485億美元 |
| 預測金額 | 828億美元 |
| 複合年成長率 | 5.5% |
預計2025年,可動人偶市佔率將達到21.2%,年複合成長率(CAGR)為5.7%,主要得益於消費者對角色扮演收藏品的強勁需求。玩偶扮演玩偶的持續流行以及收藏級毛絨玩具的快速成長,也推動了市場擴張,這些產品持續吸引著從年輕人到成年人的廣泛消費者群體。
預計到2025年,線上零售市佔率將達到39.1%,複合年成長率為8.6%。這一趨勢反映出消費者購買行為向數位化平台的明顯結構性轉變,顯示隨著消費者購買行為的不斷演變,線上零售在整個預測期內正穩步縮小與傳統實體銷售管道的差距。
預計到2025年,北美授權玩具市佔率將達到27.8%,複合年成長率(CAGR)為4.6%。該地區的領先地位得益於高度發展的授權生態系統、較高的零售市場滲透率以及娛樂特許經營權與產品開發之間的深度整合。美國仍是需求中心,而加拿大的授權玩具消費族群也持續擴大。
目錄
第1章:調查方法和範圍
第2章執行摘要
第3章 行業洞察
- 產業生態系分析
- 供應商情況
- 利潤率
- 每個階段增加的價值
- 影響價值鏈的因素
- 影響產業的因素
- 促進因素
- 特許經營和角色智慧財產權(IP)的主導地位正在推動消費者需求。
- “兒童成人”和“成人收藏家”細分市場快速成長。
- 「數位優先」與跨平台IP擴展
- 授權品牌對STEM和教育玩具的需求不斷成長
- 產業潛在風險與挑戰
- 仿冒品與無證產品之間的競爭
- 中國關稅波動與供應鏈集中度風險
- 機會
- 亞太和拉丁美洲尚未開發的市場需求
- 將實體玩具(結合AR/VR和實體產品)整合為新的收入來源
- 促進因素
- 成長潛力分析
- 監理框架
- 標準和合規要求
- 區域監理框架
- 認證標準
- 關鍵市場趨勢與顛覆性因素
- 技術與創新展望
- 當前趨勢
- 新進展
- 價格分析
- 對過去價格趨勢的分析
- 按業務類型分類的定價策略(溢價/價值/成本加成)
- 未來市場趨勢
- 貿易數據分析
- 進出口量及進口額趨勢
- 主要貿易路線及關稅的影響
- 人工智慧和生成式人工智慧對市場的影響
- 利用人工智慧改造現有經營模式
- 針對特定領域的生成式人工智慧應用案例和實施藍圖
- 風險、限制和監管考量
- 波特的分析
- PESTLE分析
- 目前分銷基礎設施和通路滲透情況
- 按國家與業務類型(現代零售與傳統零售)分類的通路涵蓋範圍
- 最後一公里基礎設施和不斷變化的管道方面的差異
- 消費行為分析
- 購買模式
- 偏好分析
- 不同地區的消費行為差異
- 電子商務對購買決策的影響
第4章 競爭情勢
- 介紹
- 企業市佔率分析
- 按地區
- 北美洲
- 歐洲
- 亞太地區
- 中東和非洲
- 拉丁美洲
- 按地區
- 企業矩陣分析
- 主要市場公司的競爭分析
- 競爭定位矩陣
- 主要進展
- 併購
- 夥伴關係和聯盟
- 新產品發布
- 業務拓展計劃
第5章 市場估算與預測:依產品類型分類,2022-2035年
- 可動人偶
- 超級英雄人偶
- 電影和電視角色人偶
- 動畫和漫畫人物模型
- 收藏人偶
- 玩偶和毛絨玩具
- 時尚娃娃
- 卡通絨毛玩具
- 互動玩偶
- 絨毛玩具
- 藝術與手工藝
- 繪畫套裝
- 橡皮泥和雕塑套裝
- 手作活動套組
- 遊戲和謎題
- 圖板遊戲
- 卡牌遊戲
- 拼圖
- 策略遊戲
- 戶外和運動玩具
- 授權體育器材和球類
- 戶外遊戲套裝和活動玩具
- 組裝套件
- 積木和模組化積木
- 工程和機械套件
- 教育玩具
- 學習遊戲和STEM套件
- 技能培養與益智學習玩具
- 其他
- 車輛和壓鑄模型
- 角色扮演玩具
- 音樂玩具
- 新奇物品
第6章 市場估算與預測:依授權類型分類,2022-2035年
- 娛樂媒體智慧財產權
- 運動和運動員相關智慧財產權
- 遊戲和電競IP
- 時尚和生活風格品牌的智慧財產權
- 其他
第7章 市場估計與預測:依價格區間分類,2022-2035年
- 低的
- 中等的
- 高的
第8章 市場估計與預測:依年齡層別分類,2022-2035年
- 1歲以下
- 1-3歲
- 3-5歲
- 5-12歲
- 12歲以上(兒童及成人收藏家)
- 青少年(12-17歲)
- 成年收藏家(18歲以上)
第9章 市場估計與預測:依最終用途分類,2022-2035年
- 個人
- 個人遊戲
- 收藏/嗜好
- 商業的
- 教育機構
- 商業和休閒設施
- 企業禮品和促銷用途
第10章 市場估價與預測:依通路分類,2022-2035年
- 線上
- 電子商務
- 公司網站
- 離線
- 超級市場/大賣場
- 專業零售店
- 其他(例如獨立經營零售商店)
第11章 市場估價與預測:按地區分類,2022-2035年
- 北美洲
- 美國
- 加拿大
- 歐洲
- 英國
- 德國
- 法國
- 義大利
- 西班牙
- 亞太地區
- 中國
- 印度
- 日本
- 韓國
- 澳洲
- 拉丁美洲
- 巴西
- 墨西哥
- 阿根廷
- 中東和非洲
- 南非
- 沙烏地阿拉伯
- UAE
第12章:公司簡介
- 世界公司
- Bandai Namco Holdings
- Business Overview
- Financial Data
- Product Landscape
- Strategic Outlook
- SWOT Analysis
- Funko Inc.
- Hasbro Inc.
- LEGO Group
- Mattel Inc.
- Spin Master Corp.
- VTech Holdings Ltd.
- Bandai Namco Holdings
- 本地公司
- Basic Fun!
- Clementoni SpA
- JAKKS Pacific Inc.
- Playmobil
- Ravensburger AG
- Schleich GmbH
- Tomy Company Ltd.
- 新興企業
- Goliath Games BV
- Jazwares LLC
- Just Play LLC
- MGA Entertainment, Inc.
- Moose Toys
- WowWee Group
- ZURU Ltd.
The Global Licensed Toy Market was valued at USD 48.5 billion in 2025 and is estimated to grow at a CAGR of 5.5% to reach USD 82.8 billion by 2035.
Growth is shaped by a structural shift in consumer demographics, where adult collectors now represent a major incremental demand contributor, particularly within premium collectibles and licensed entertainment merchandise. The increasing integration of intellectual property into product development pipelines is reinforcing long-term market expansion, as entertainment studios and gaming companies increasingly synchronize content launches with physical merchandise rollouts. This coordinated ecosystem ensures that new releases across films, streaming platforms, and gaming titles are directly supported by retail toy programs. Strong licensing ecosystems are especially visible in North America and Asia Pacific, where entertainment franchises and gaming IP continue to drive sustained engagement across both children and adult audiences. The growing commercialization of digital-first IP transitioning into physical toy formats is further strengthening the licensing pipeline. In addition, expanding collaboration networks between IP holders and manufacturers are enabling large-scale, multi-category product ecosystems that extend across toys, collectibles, and experiential merchandise.
| Market Scope | |
|---|---|
| Start Year | 2025 |
| Forecast Year | 2026-2035 |
| Start Value | $48.5 Billion |
| Forecast Value | $82.8 Billion |
| CAGR | 5.5% |
The action figures segment accounted for 21.2% share in 2025 and is expected to grow at a CAGR of 5.7%, supported by strong demand for character-driven collectibles. Market growth is also driven by sustained popularity of character-based dolls and rapidly growing collectible plush formats that continue to attract both younger and adult consumers.
The online distribution segment held 39.1% share in 2025 and is projected to grow at a CAGR of 8.6%. The trend reflects a clear structural shift toward digital purchasing platforms, with online retail steadily narrowing the gap with traditional brick-and-mortar sales channels over the forecast period as consumer purchasing behavior continues to evolve.
North America Licensed Toy Market held 27.8% share in 2025, growing at a CAGR of 4.6%. The region's dominance is supported by a highly developed licensing ecosystem, strong retail penetration, and deep integration between entertainment franchises and merchandise development. The United States remains the central hub of demand, while Canada continues to expand its licensed toy consumption base.
Key industry participants include Bandai Namco Holdings, Basic Fun!, Clementoni S.p.A., Funko Inc., Goliath Games B.V., Hasbro Inc., JAKKS Pacific Inc., Jazwares LLC, Just Play LLC, LEGO Group, Mattel Inc., MGA Entertainment Inc., Moose Toys, Playmobil, Ravensburger AG, Schleich GmbH, Spin Master Corp., Tomy Company Ltd., VTech Holdings Ltd., WowWee Group, and ZURU Ltd. Companies operating in the licensed toy market are strengthening their position by deepening collaborations with entertainment studios, gaming developers, and digital content creators to secure long-term intellectual property access. Many players are focusing on rapid product commercialization cycles that align toy launches with film, streaming, and game releases to maximize demand momentum. Firms are also expanding into premium collectible categories targeting adult consumers, which has become a high-margin growth segment. Digital transformation strategies, including e-commerce expansion and direct-to-consumer platforms, are being prioritized to improve brand control and customer engagement.
Table of Contents
Chapter 1 Methodology & Scope
- 1.1 Research approach
- 1.2 Quality Commitments
- 1.2.1 GMI AI policy & data integrity commitment
- 1.2.1.1 Source consistency protocol
- 1.2.1 GMI AI policy & data integrity commitment
- 1.3 Research Trail & Confidence Scoring
- 1.3.1 Research Trail Components
- 1.3.2 Scoring Components
- 1.4 Data Collection
- 1.4.1 Partial list of primary sources
- 1.5 Data mining sources
- 1.5.1 Paid sources
- 1.5.1.1 Sources, by region
- 1.5.1 Paid sources
- 1.6 Base estimates and calculations
- 1.6.1 Base year calculation for any one approach
- 1.7 Forecast model
- 1.7.1 Quantified market impact analysis
- 1.7.1.1 Mathematical impact of growth parameters on forecast
- 1.7.1 Quantified market impact analysis
- 1.8 Research transparency addendum
- 1.8.1 Source attribution framework
- 1.8.2 Quality assurance metrics
- 1.8.3 Our commitment to trust
Chapter 2 Executive Summary
- 2.1 Industry 360° synopsis, 2022 - 2035
- 2.2 Key market trends
- 2.2.1 Regional
Chapter 3 Industry Insights
- 3.1 Industry ecosystem analysis
- 3.1.1 Supplier landscape
- 3.1.2 Profit margin
- 3.1.3 Value addition at each stage
- 3.1.4 Factor affecting the value chain
- 3.2 Industry impact forces
- 3.2.1 Growth drivers
- 3.2.1.1 Dominance of franchise & character-based IP driving consumer pull
- 3.2.1.2 Rapid growth of kidult & adult collector segment
- 3.2.1.3 Expansion of digital first & cross-platform IP
- 3.2.1.4 Rising STEM & educational toy demand under licensed branding
- 3.2.2 Industry pitfalls & challenges
- 3.2.2.1 Counterfeiting & unlicensed product competition
- 3.2.2.2 Tariff volatility & China supply chain concentration risk
- 3.2.3 Opportunities
- 3.2.3.1 Untapped emerging market demand in Asia Pacific & Latin America
- 3.2.3.2 Phygital toy integration (AR/VR + physical product) as new revenue stream
- 3.2.1 Growth drivers
- 3.3 Growth potential analysis
- 3.4 Regulatory framework
- 3.4.1 Standards & compliance requirements
- 3.4.2 Regional regulatory frameworks
- 3.4.3 Certification standards
- 3.5 Major market trends and disruptions
- 3.6 Technology/innovation landscape
- 3.6.1 Current trends
- 3.6.2 Emerging trends
- 3.7 Pricing Analysis (driven by primary research)
- 3.7.1 Historical price trend analysis (driven by primary research)
- 3.7.2 Pricing strategy by player type (premium / value / cost- plus) (driven by primary research)
- 3.8 Future market trends
- 3.9 Trade data analysis (driven by paid database) (HS Code- 9503)
- 3.9.1 Import/export volume & value trends (driven by primary research)
- 3.9.2 Key trade corridors & tariff impact (driven by primary research)
- 3.10 Impact of AI & Generative AI on the Market
- 3.10.1 AI- driven disruption of existing business models
- 3.10.2 Gen- AI use cases & adoption roadmap by segment
- 3.10.3 Risks, limitations & regulatory considerations
- 3.11 Porter's analysis
- 3.12 PESTEL analysis
- 3.13 Distribution infrastructure & channel penetration landscape (driven by primary research)
- 3.13.1 Channel coverage by country & format (modern vs. Traditional trade) (driven by primary research)
- 3.13.2 Last- mile infrastructure gaps & emerging channel shifts (driven by primary research)
- 3.14 Consumer behavior analysis
- 3.14.1 Purchasing patterns
- 3.14.2 Preference analysis
- 3.14.3 Regional variations in consumer behavior
- 3.14.4 Impact of e-commerce on buying decisions
Chapter 4 Competitive Landscape, 2025
- 4.1 Introduction
- 4.2 Company market share analysis
- 4.2.1 By Region
- 4.2.1.1 North America
- 4.2.1.2 Europe
- 4.2.1.3 Asia Pacific
- 4.2.1.4 Middle East and Africa
- 4.2.1.5 Latin America
- 4.2.1 By Region
- 4.3 Company matrix analysis
- 4.4 Competitive analysis of major market players
- 4.5 Competitive positioning matrix
- 4.6 Key developments
- 4.6.1 Mergers & acquisitions
- 4.6.2 Partnerships & collaborations
- 4.6.3 New product launches
- 4.6.4 Expansion plans
Chapter 5 Market Estimates & Forecast, By Product Type, 2022 - 2035 (USD Billion, Million Units)
- 5.1 Key trends
- 5.2 Action figures
- 5.2.1 Superhero figures
- 5.2.2 Movie & tv character figures
- 5.2.3 Anime & cartoon figures
- 5.2.4 Collectible figures
- 5.3 Dolls & plush toys
- 5.3.1 Fashion dolls
- 5.3.2 Character plush
- 5.3.3 Interactive dolls
- 5.3.4 Stuffed animals
- 5.4 Arts & crafts
- 5.4.1 Painting & drawing kits
- 5.4.2 Modeling clay & sculpting sets
- 5.4.3 Craft & activity sets
- 5.5 Games & puzzles
- 5.5.1 Board games
- 5.5.2 Card games
- 5.5.3 Jigsaw puzzles
- 5.5.4 Strategy games
- 5.6 Outdoor & sports toys
- 5.6.1 Licensed sports equipment & balls
- 5.6.2 Outdoor playsets & activity toys
- 5.7 Construction sets
- 5.7.1 Building blocks & modular bricks
- 5.7.2 Engineering & mechanical kits
- 5.8 Educational toys
- 5.8.1 Learning games & stem kits
- 5.8.2 Skill development & puzzle learning toys
- 5.9 Others
- 5.9.1 Vehicles & die-cast models
- 5.9.2 Role play toys
- 5.9.3 Musical toys
- 5.9.4 Novelty items
Chapter 6 Market Estimates & Forecast, By License, 2022 - 2035 (USD Billion, Million Units)
- 6.1 Key trends
- 6.2 Entertainment & media IP
- 6.3 Sports & athletic IP
- 6.4 Gaming & esports IP
- 6.5 Fashion & lifestyle brand IP
- 6.6 Others
Chapter 7 Market Estimates & Forecast, By Price range, 2022 - 2035 (USD Billion, Million Units)
- 7.1 Key trends
- 7.2 Low
- 7.3 Medium
- 7.4 High
Chapter 8 Market Estimates & Forecast, By Age group, 2022 - 2035 (USD Billion, Million Units)
- 8.1 Below 1 year
- 8.2 Ages 1-3
- 8.3 Ages 3-5
- 8.4 Ages 5-12
- 8.5 Ages 12+ (kidult & adult collector)
- 8.5.1 Teen segment (ages 12-17)
- 8.5.2 Adult collector segment (ages 18+)
Chapter 9 Market Estimates & Forecast, By End Use, 2022 - 2035 (USD Billion, Million Units)
- 9.1 Individual
- 9.1.1 Personal play
- 9.1.2 Collection & hobby
- 9.2 Commercial
- 9.2.1 Educational institutions
- 9.2.2 Commercial recreational facilities
- 9.2.3 Corporate gifting & promotional use
Chapter 10 Market Estimates & Forecast, By Distribution Channel, 2022 - 2035 (USD Billion, Million Units)
- 10.1 Key trends
- 10.2 Online
- 10.2.1 E-commerce
- 10.2.2 Company websites
- 10.3 Offline
- 10.3.1 Supermarkets/hypermarket
- 10.3.2 Specialty retail stores
- 10.3.3 Others (independent retailer etc.)
Chapter 11 Market Estimates & Forecast, By Region, 2022-2035 (USD Billion) (Million Units)
- 11.1 Key trends
- 11.2 North America
- 11.2.1 U.S.
- 11.2.2 Canada
- 11.3 Europe
- 11.3.1 UK
- 11.3.2 Germany
- 11.3.3 France
- 11.3.4 Italy
- 11.3.5 Spain
- 11.4 Asia Pacific
- 11.4.1 China
- 11.4.2 India
- 11.4.3 Japan
- 11.4.4 South Korea
- 11.4.5 Australia
- 11.5 Latin America
- 11.5.1 Brazil
- 11.5.2 Mexico
- 11.5.3 Argentina
- 11.6 MEA
- 11.6.1 South Africa
- 11.6.2 Saudi Arabia
- 11.6.3 UAE
Chapter 12 Company Profiles
- 12.1 Global Companies
- 12.1.1 Bandai Namco Holdings
- 12.1.1.1 Business Overview
- 12.1.1.2 Financial Data
- 12.1.1.3 Product Landscape
- 12.1.1.4 Strategic Outlook
- 12.1.1.5 SWOT Analysis
- 12.1.2 Funko Inc.
- 12.1.3 Hasbro Inc.
- 12.1.4 LEGO Group
- 12.1.5 Mattel Inc.
- 12.1.6 Spin Master Corp.
- 12.1.7 VTech Holdings Ltd.
- 12.1.1 Bandai Namco Holdings
- 12.2 Regional Companies
- 12.2.1 Basic Fun!
- 12.2.2 Clementoni S.p.A.
- 12.2.3 JAKKS Pacific Inc.
- 12.2.4 Playmobil
- 12.2.5 Ravensburger AG
- 12.2.6 Schleich GmbH
- 12.2.7 Tomy Company Ltd.
- 12.3 Emerging Companies
- 12.3.1 Goliath Games B.V.
- 12.3.2 Jazwares LLC
- 12.3.3 Just Play LLC
- 12.3.4 MGA Entertainment, Inc.
- 12.3.5 Moose Toys
- 12.3.6 WowWee Group
- 12.3.7 ZURU Ltd.

 全球授權玩具市場規模、佔有率、趨勢和成長分析報告(2026-2034)
 授權體育用品市場:2026-2032年全球市場預測(按產品類型、運動項目、授權形式、材料類型、最終用戶和分銷管道分類)
 2026-2030年全球授權運動用品市場
 授權體育用品市場分析及預測(至2035年):類型、產品類型、服務、技術、組件、應用、最終用戶、部署形式、模式和解決方案全球授權體育用品市場規模、佔有率、趨勢和成長分析報告(2026-2034年)
 授權體育用品市場報告:按產品類型、分銷管道、價格範圍、最終用戶和地區分類(2026-2034 年)
 授權體育用品市場規模、佔有率及成長分析(按產品、通路、最終用戶和地區分類)-2026-2033年產業預測
 全球授權玩具市場