


 |
市場調查報告書
商品編碼
2083317
水產養殖監測和自動化系統市場:商業機會、成長要素、產業趨勢分析以及 2026-2035 年預測。Aquaculture Monitoring and Automation Systems Market Opportunity, Growth Drivers, Industry Trend Analysis, and Forecast 2026 - 2035 |
||||||

全球水產養殖監測和自動化系統市場預計到 2025 年將達到 16.4 億美元,年複合成長率為 9.4%,到 2035 年將達到 40.3 億美元。
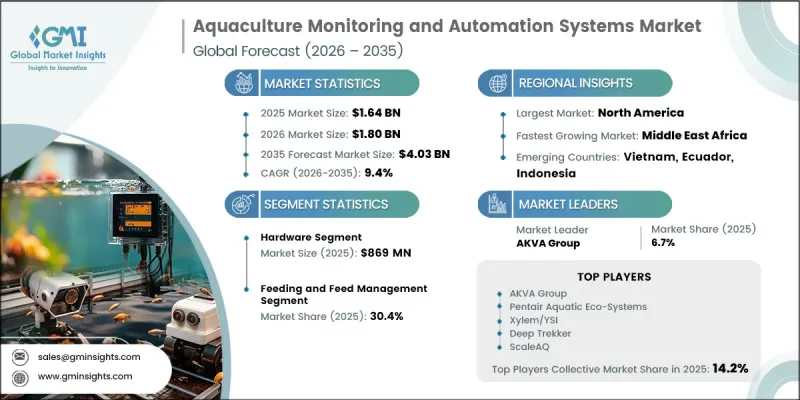
全球水產品供需缺口不斷擴大、水產養殖業勞動力短缺壓力日益增大,以及感測器技術和邊緣運算組件成本持續下降,共同推動了市場成長。這些因素正在加速水產養殖朝向高度數位化轉型。目前,重大技術變革正在進行中,人工智慧驅動的生物量追蹤、魚類聲學行為分析以及基於訂閱的養殖場管理軟體正從試驗計畫轉向大規模商業部署,應用於蝦、吳郭魚、鮭魚和循環水養殖系統(RAS)等生產系統。十多年來,全球野生魚貝類漁獲量一直穩定在每年9000萬至9500萬噸,這限制了供應的進一步擴張,並加劇了對水產養殖作為水產品主要來源的依賴。這種結構性限制進一步凸顯了對先進監測和自動化系統的需求,以支持提高生產力、最佳化資源利用和實現可擴展的全球水產養殖生產。
| 市場範圍 | |
|---|---|
| 開始年份 | 2025 |
| 預測期 | 2026-2035 |
| 初始市場規模 | 16.4億美元 |
| 預測金額 | 40.3億美元 |
| 複合年成長率 | 9.4% |
預計到2025年,硬體部門的銷售額將達到8.69億美元,市佔率為53%。這一主導地位反映出,無論生產方式或養殖品種如何,水質感測器和監測設備作為所有商業水產養殖作業的必要基礎設施,已被廣泛採用。
預計到2025年,飼料及飼料管理系統市場規模將達到4.92億美元,市佔率為30.4%,並持續維持其作為領先系統類別的地位。這一強勁地位源自於飼料轉換率直接影響水產養殖的盈利。在商業性水產養殖作業中,先進的自動化投餵技術和人工智慧驅動的最佳化系統正被擴大應用於提高飼料轉換率、減少廢棄物並提升整體生產效率。
預計到2025年,北美水產養殖監測和自動化系統市場將佔據19%的市場佔有率(價值3.12億美元),其中美國是主要的成長動力,而加拿大正在形成一個更成熟穩定的市場基礎。該地區的成長主要得益於陸基循環水產養殖系統(RAS)設施的擴張以及對水產養殖發展舉措的製度性支持力度加大。對現代化水產養殖基礎設施的投資以及對永續水產品生產的監管支持,將繼續推動該地區的市場擴張。
目錄
第1章:調查方法和範圍
第2章執行摘要
第3章 行業洞察
- 產業生態系分析
- 供應鏈分析
- 零件採購和供應商趨勢
- 分銷通路和系統整合商
- 供應鏈脆弱性與風險緩解
- 影響產業的因素
- 市場促進因素
- 全球水產品的需求不斷成長,供需缺口正在擴大。
- 勞動力短缺和營運成本上升正在加速自動化技術的應用。
- 對環境合規性、可追溯性和永續性認證的監管壓力日益增大。
- 物聯網、人工智慧和邊緣運算等技術的快速發展正在降低系統成本。
- 市場限制因素
- 對感測器基礎設施和自動化系統進行了大量初始資本投資。
- 在惡劣的海洋和鹽水環境中,感測器耐久性和腐蝕性面臨許多挑戰。
- 在水產養殖業仍處於發展階段的地區,缺乏技術專長和難以獲得熟練勞動力。
- 市場機遇
- 循環水產養殖系統(RAS)在全球範圍內的快速擴張創造了新的需求。
- 人工智慧/機器學習整合用於預測疾病檢測和即時生質能最佳化
- 亞太地區和拉丁美洲蝦貝養殖業自動化潛力尚未開發
- 「水產養殖即服務」和基於訂閱的監測平台模式的興起
- 市場促進因素
- 成長潛力分析
- 技術與創新展望
- 物聯網和多參數感測器技術
- 人工智慧和機器視覺在水產養殖監測的應用
- 邊緣運算與連接(LoRaWAN、5G、衛星通訊)
- 水下遙控潛水器與自主無人機技術
- 水產養殖中的數位雙胞胎與仿真技術
- 監理框架
- 全球水產養殖永續性標準(ASC、BAP、GlobalG.AP)
- 區域食品安全和可追溯性法規
- 環境合規、排放監測和廢水標準
- 影響物聯網系統的資料隱私和網路安全法規
- 關鍵市場趨勢與顛覆性因素
- 未來市場趨勢
- 價格分析
- 對過去價格趨勢的分析
- 依球員類型分類的定價策略(高級球員、超值球員、成本加成球員)
- 貿易數據分析
- 水產養殖感測器和控制設備進出口量和進口額趨勢
- 主要貿易走廊和關稅對系統成本的影響
- 人工智慧和生成式人工智慧對市場的影響
- 人工智慧驅動的現有經營模式轉型(從人工監控到自主系統)
- GenAI 各細分領域的應用案例與實施藍圖(飼料最佳化、疾病預測、生物量估算)
- 人工智慧驅動的水產養殖系統的風險、限制和監管考慮因素。
- 生產能力和生產情況
- 按地區和主要生產商分類的安裝能力(循環水養殖設施、養魚網路、池塘養殖密度)
- 運轉率和擴建計畫(計畫建造循環水養殖系統設施、智慧農場改造計畫)
- 投資與資金籌措分析
- 對水產養殖技術領域的創業投資和私募股權投資。
- 政府津貼、補貼和創新計畫(歐盟、聯合國糧農組織、美國國家海洋暨大氣總署)
- 按公司規模分類的研發支出趨勢
- 波特的分析
- PESTLE分析
第4章 競爭情勢
- 介紹
- 企業市佔率分析
- 按地區
- 企業矩陣分析
- 主要市場公司的競爭分析
- 競爭定位矩陣
- 主要進展
- 併購
- 夥伴關係和聯盟
- 新產品發布
- 業務拓展計劃
第5章 市場估算與預測:依產品類型分類,2022-2035年
- 硬體
- 多參數和單參數感測器(溶氧、pH值、鹽度、溫度、濁度、氨)
- 水下攝影機和電腦視覺設備
- 遙控水下航行器(ROV)和自主水下航行器(AUV)
- 控制單元、PLC、RTU 和執行器
- 自動餵料分配器和供料裝置
- 軟體
- 基於雲端的農場管理平台
- 人工智慧和預測分析軟體
- 即時監控儀錶板和SCADA系統
- 行動應用程式和遠端控制介面
- 服務
- 系統整合和安裝服務
- 維護、校準和支援服務
- 諮詢、培訓和農業管理服務
第6章 市場估計與預測:依系統類型分類,2022-2035年
- 水質監測系統
- 溶氧監測系統
- pH值和水溫監測系統
- 鹽度、濁度、氨氮和多參數綜合系統
- 飼餵和飼料管理系統
- 自動顆粒分配器和氣動送料系統
- 人工智慧驅動的飼料最佳化和廢棄物減量系統
- 食慾偵測和基於攝影機的餵食控制系統
- 魚類行為和生物量監測系統
- 電腦視覺和影像處理系統
- 聲學、聲吶和水中聽音器監測系統
- 人工智慧驅動的疾病檢測、壓力識別和預警系統
- 環境控制與自動化系統
- 曝氣和氧氣供應控制系統
- 水循環、過濾和處理自動化系統
- 照明、溫度和氣候控制系統
- 其他
- 收割自動化、分類與分級系統
- 廢棄物管理和廢水監測系統
- 可追溯性、合規性追蹤和數位日誌系統
第7章 市場估計與預測:依農場類型分類,2022-2035年
- 活籠養殖
- 近海養魚系統(海網養殖)
- 內陸湖泊和水庫的籠養系統
- 池塘養殖
- 土池系統
- 池塘襯砌與生物絮團技術(BFT)系統
- 循環水產養殖系統(RAS)
- 淡水循環水系統
- 海洋/海水型循環水養殖系統
- 其他
- 電氣管槽及流通式系統
- 貝類延繩釣養殖和綜合多營養級(IMTA)系統
第8章 市場估算與預測:依類型分類,2022-2035年
- 養魚
- 鮭科魚類(大西洋鮭、鱒魚、北極紅點鮭)
- 吳郭魚和鯰魚
- 鱸魚、鯛魚和地中海魚類
- 其他魚類(鯉魚、鮪魚、黃尾魚)
- 蝦類和甲殼類養殖
- 凡納濱對蝦(Litopenaeus vannamei)
- 黑虎蝦和淡水蝦
- 螃蟹和其他甲殼類動物
- 貝類和軟體動物養殖
- 牡蠣和貽貝
- 蛤蜊、扇貝和其他雙殼類動物
- 海藻和水生植物
- 海帶和褐藻
- 紅藻和鹿角菜膠生產物種
- 其他(觀賞魚、鱷魚、特殊物種)
第9章 市場估價與預測:依最終用戶分類,2022-2035年
- 商業養魚場
- 中小型水產養殖場
- 大型商業水產養殖和公司所有企業
- 研究機構和學術機構
- 其他(政府機構、孵化場、水產養殖合作社)
第10章 市場估價與預測:依地區分類,2022-2035年
- 北美洲
- 美國
- 加拿大
- 歐洲
- 德國
- 英國
- 法國
- 義大利
- 西班牙
- 亞太地區
- 中國
- 印度
- 日本
- 韓國
- 澳洲
- 拉丁美洲
- 巴西
- 墨西哥
- 阿根廷
- 中東和非洲
- UAE
- 沙烏地阿拉伯
- 南非
第11章:公司簡介
- AKVA Group
- Innovasea Systems Inc.
- ScaleAQ
- Deep Trekker Inc.
- Aquabyte
- Signify Holding NV
- ReelData AI
- XpertSea(Kampi)
- CageEye AS
- Bluegrove AS
- BioSort AS
- In-Situ Inc.
- SeaRAS AS
- Skretting-Nutreco
- Cathx Ocean
- Tidal(TidalX AI Inc.)
- AQ1 Systems Pty Ltd
- Manolin Inc.
- YSI, a Xylem brand(Xylem Inc.)
- Aqualytics AS
- Dynamic FishEye(a brand of Dynamic AS)
- Pentair Aquatic Eco-Systems(Pentair Inc.)
The Global Aquaculture Monitoring and Automation Systems Market was valued at USD 1.64 billion in 2025 and is estimated to grow at a CAGR of 9.4% to reach USD 4.03 billion by 2035.
Market growth is driven by a widening global seafood supply-demand gap, increasing pressure on labor availability in aquaculture operations, and continuous reductions in the cost of sensor technologies and edge computing components. These factors are accelerating the shift toward highly digitized aquaculture operations. A major technological transformation is underway, where AI-powered biomass tracking, acoustic fish behavior analysis, and subscription-based farm management software are moving from pilot programs into large-scale commercial deployment across shrimp, tilapia, salmon, and RAS production systems. Global capture fisheries output has remained relatively stable at 90 to 95 million tonnes annually for more than a decade, limiting further supply expansion and increasing reliance on aquaculture as the primary source of seafood growth. This structural constraint is reinforcing the need for advanced monitoring and automation systems to improve productivity, optimize resource use, and support scalable aquaculture production worldwide.
| Market Scope | |
|---|---|
| Start Year | 2025 |
| Forecast Year | 2026-2035 |
| Start Value | $1.64 Billion |
| Forecast Value | $4.03 Billion |
| CAGR | 9.4% |
The hardware segment generated USD 869 million in 2025, accounting for 53% share. This dominance reflects the widespread deployment of water quality sensors and monitoring instruments as essential infrastructure across all commercial aquaculture operations, regardless of production method or species type.
The feeding and feed management systems segment was valued at USD 492 million in 2025, representing 30.4% share, and remained the leading system-type category. Its strong position is driven by the direct impact of feed efficiency on operational profitability in aquaculture production. Advanced automated feeding technologies and AI-enabled optimization systems are increasingly being used to improve feed conversion ratios, reduce waste, and enhance overall production efficiency across commercial fish farming operations.
North America Aquaculture Monitoring and Automation Systems Market accounted for 19% share in 2025, equivalent to USD 312 million, with the United States serving as the primary growth driver and Canada representing a more established and steady market base. Growth in the region is supported by the expansion of land-based RAS facilities and increasing institutional support for aquaculture development initiatives. Investments in modern aquaculture infrastructure and regulatory support for sustainable seafood production continue to strengthen regional market expansion.
Major companies operating in the global aquaculture monitoring and automation systems market include AKVA Group, Pentair Aquatic Eco-Systems, Xylem/YSI, ScaleAQ, Innovasea Systems, Deep Trekker, Aquabyte, CageEye AS, In-Situ Inc., Manolin, and ReelData. Companies operating in the aquaculture monitoring and automation systems market are strengthening their market position by investing in AI-driven analytics, IoT-enabled sensor technologies, and integrated farm management platforms. Market players are focusing on developing real-time monitoring solutions that improve water quality control, optimize feeding efficiency, and enhance fish health management. Strategic collaborations with aquaculture farms, research institutions, and technology providers are supporting faster commercialization and wider adoption of advanced systems. Businesses are also expanding cloud-based service offerings, subscription models, and remote monitoring capabilities to improve scalability and recurring revenue streams.
Table of Contents
Chapter 1 Methodology & Scope
- 1.1 Research approach
- 1.2 Quality Commitments
- 1.2.1 GMI AI policy & data integrity commitment
- 1.2.1.1 Source consistency protocol
- 1.2.1 GMI AI policy & data integrity commitment
- 1.3 Research Trail & Confidence Scoring
- 1.3.1 Research Trail Components
- 1.3.2 Scoring Components
- 1.4 Data Collection
- 1.4.1 Partial list of primary sources
- 1.5 Data mining sources
- 1.5.1 Paid sources
- 1.5.1.1 Sources, by region
- 1.5.1 Paid sources
- 1.6 Base estimates and calculations
- 1.6.1 Base year calculation for any one approach
- 1.7 Forecast model
- 1.7.1 Quantified market impact analysis
- 1.7.1.1 Mathematical impact of growth parameters on forecast
- 1.7.1 Quantified market impact analysis
- 1.8 Research transparency addendum
- 1.8.1 Source attribution framework
- 1.8.2 Quality assurance metrics
- 1.8.2.1 Our commitment to trust
Chapter 2 Executive Summary
- 2.1 Industry 360° synopsis, 2022 - 2035
- 2.2 Key market trends
- 2.2.1 By Region
- 2.2.2 By Offering
- 2.2.3 By System Type
- 2.2.4 By Farm Type
- 2.2.5 By Species
- 2.2.6 By End-user
Chapter 3 Industry Insights
- 3.1 Industry ecosystem analysis
- 3.2 Supply chain analysis
- 3.2.1 Component Sourcing & Supplier Landscape
- 3.2.2 Distribution Channels & System Integrators
- 3.2.3 Supply Chain Vulnerabilities & Risk Mitigation
- 3.3 Industry impact forces
- 3.3.1 Market drivers
- 3.3.1.1 Rising Global Seafood Demand & Widening Supply-Demand Gap
- 3.3.1.2 Labor Scarcity & Rising Operational Costs Accelerating Automation Adoption
- 3.3.1.3 Increasing Regulatory Pressure for Environmental Compliance, Traceability & Sustainability Certification
- 3.3.1.4 Rapid Technological Advancements in IoT, AI, & Edge Computing Reducing System Costs
- 3.3.2 Market restraints
- 3.3.2.1 High Upfront Capital Investment for Sensor Infrastructure & Automation Systems
- 3.3.2.2 Sensor Durability & Corrosion Challenges in Harsh Marine & Saline Environments
- 3.3.2.3 Limited Technical Expertise & Skilled Workforce Availability in Developing Aquaculture Regions
- 3.3.3 Market opportunities
- 3.3.3.1 Rapid Global Expansion of Recirculating Aquaculture Systems (RAS) Creating New Demand
- 3.3.3.2 Integration of AI/ML for Predictive Disease Detection & Real-Time Biomass Optimization
- 3.3.3.3 Untapped Automation Potential in Shrimp & Shellfish Farming Across Asia Pacific & Latin America
- 3.3.3.4 Emergence of Aquaculture-as-a-Service & Subscription-Based Monitoring Platform Models
- 3.3.1 Market drivers
- 3.4 Growth potential analysis
- 3.5 Technology & innovation landscape
- 3.5.1 IoT & Multi-Parameter Sensor Technologies
- 3.5.2 AI & Machine Vision in Aquaculture Monitoring
- 3.5.3 Edge Computing & Connectivity (LoRaWAN, 5G, Satellite)
- 3.5.4 Underwater ROV & Autonomous Drone Technologies
- 3.5.5 Digital Twin & Simulation Technologies for Aquaculture
- 3.6 Regulatory framework
- 3.6.1 Global Aquaculture Sustainability Standards (ASC, BAP, GlobalG.A.P.)
- 3.6.2 Food Safety & Traceability Regulations by Region
- 3.6.3 Environmental Compliance, Discharge Monitoring & Effluent Standards
- 3.6.4 Data Privacy & Cybersecurity Regulations Affecting IoT Systems
- 3.7 Major market trends and disruptions
- 3.8 Future market trends
- 3.9 Pricing analysis (driven by primary research)
- 3.9.1 Historical Price Trend Analysis (Driven by Primary Research)
- 3.9.2 Pricing Strategy by Player Type (Premium / Value / Cost-plus) (Driven by Primary Research)
- 3.10 Trade data analysis (driven by primary research)
- 3.10.1 Import/Export Volume & Value Trends - Aquaculture Sensors & Control Equipment (Driven by Primary Research)
- 3.10.2 Key Trade Corridors & Tariff Impact on System Costs (Driven by Primary Research)
- 3.11 Impact of AI & generative AI on the market
- 3.11.1 AI-Driven Disruption of Existing Business Models (Manual Monitoring - Autonomous Systems)
- 3.11.2 GenAI Use Cases & Adoption Roadmap by Segment (Feed Optimization, Disease Prediction, Biomass Estimation)
- 3.11.3 Risks, Limitations & Regulatory Considerations for AI-Driven Aquaculture Systems
- 3.12 Capacity & production landscape (driven by primary research)
- 3.12.1 Installed Capacity by Region & Key Producer (RAS Facilities, Cage Farm Networks, Pond Farm Density) (Driven by Primary Research)
- 3.12.2 Capacity Utilization Rates & Expansion Pipelines (Planned RAS Builds, Smart Farm Conversion Projects) (Driven by Primary Research)
- 3.13 Investment & funding analysis
- 3.13.1 Venture Capital & Private Equity Investments in Aquaculture Tech
- 3.13.2 Government Grants, Subsidies & Innovation Programs (EU, FAO, NOAA)
- 3.13.3 Corporate R&D Spending Trends by Player Tier
- 3.14 Porter’s analysis
- 3.15 PESTEL analysis
Chapter 4 Competitive Landscape, 2025
- 4.1 Introduction
- 4.2 Company market share analysis
- 4.2.1 By Region
- 4.2.1.1 North America
- 4.2.1.2 Europe
- 4.2.1.3 Asia Pacific
- 4.2.1.4 Latin America
- 4.2.1.5 Middle East and Africa
- 4.2.1 By Region
- 4.3 Company matrix analysis
- 4.4 Competitive analysis of major market players
- 4.5 Competitive positioning matrix
- 4.6 Key developments
- 4.6.1 Mergers & acquisitions
- 4.6.2 Partnerships & collaborations
- 4.6.3 New product launches
- 4.6.4 Expansion plans
Chapter 5 Market Estimates and Forecast, By Offering, 2022 - 2035 (USD Billion) (Thousand Units)
- 5.1 Key trends
- 5.2 Hardware
- 5.2.1 Multi-Parameter & Single-Parameter Sensors (DO, pH, Salinity, Temperature, Turbidity, Ammonia)
- 5.2.2 Underwater Cameras & Computer Vision Devices
- 5.2.3 Remotely Operated Vehicles (ROVs) & Autonomous Underwater Vehicles (AUVs)
- 5.2.4 Control Units, PLCs, RTUs & Actuators
- 5.2.5 Automated Feeding Dispensers & Delivery Devices
- 5.3 Software
- 5.3.1 Cloud-Based Farm Management Platforms
- 5.3.2 AI & Predictive Analytics Software
- 5.3.3 Real-Time Monitoring Dashboards & SCADA Systems
- 5.3.4 Mobile Applications & Remote Control Interfaces
- 5.4 Services
- 5.4.1 System Integration & Installation Services
- 5.4.2 Maintenance, Calibration & Support Services
- 5.4.3 Consulting, Training & Managed Farm Services
Chapter 6 Market Estimates and Forecast, By System Type, 2022 - 2035 (USD Billion) (Thousand Units)
- 6.1 Key trends
- 6.2 Water Quality Monitoring Systems
- 6.2.1 Dissolved Oxygen Monitoring Systems
- 6.2.2 pH & Temperature Monitoring Systems
- 6.2.3 Salinity, Turbidity, Ammonia & Multi-Parameter Combined Systems
- 6.3 Feeding & Feed Management Systems
- 6.3.1 Automated Pellet Dispensers & Pneumatic Feeding Systems
- 6.3.2 AI-Driven Feed Optimization & Waste Minimization Systems
- 6.3.3 Appetite Detection & Camera-Based Feeding Control Systems
- 6.4 Fish Behavior & Biomass Monitoring Systems
- 6.4.1 Computer Vision & Image Processing Systems
- 6.4.2 Acoustic, Sonar & Hydrophone-Based Monitoring Systems
- 6.4.3 AI-Powered Disease Detection, Stress Identification & Early Warning Systems
- 6.5 Environmental Control & Automation Systems
- 6.5.1 Aeration & Oxygenation Control Systems
- 6.5.2 Water Circulation, Filtration & Treatment Automation Systems
- 6.5.3 Lighting, Temperature & Climate Automation Systems
- 6.6 Others
- 6.6.1 Harvest Automation & Grading/Sorting Systems
- 6.6.2 Waste Management & Effluent Monitoring Systems
- 6.6.3 Traceability, Compliance Tracking & Digital Logbook Systems
Chapter 7 Market Estimates and Forecast, By Farm Type, 2022 - 2035 (USD Billion) (Thousand Units)
- 7.1 Key trends
- 7.2 Cage Aquaculture
- 7.2.1 Offshore Marine Cage Systems (Open-Sea Net Pens)
- 7.2.2 Inland Lake & Reservoir Cage Systems
- 7.3 Pond Aquaculture
- 7.3.1 Earthen Pond Systems
- 7.3.2 Lined Pond & Biofloc Technology (BFT) Systems
- 7.4 Recirculating Aquaculture Systems (RAS)
- 7.4.1 Freshwater RAS
- 7.4.2 Marine/Saltwater RAS
- 7.5 Others
- 7.5.1 Raceway & Flow-Through Systems
- 7.5.2 Shellfish Long-Lines & Integrated Multi-Trophic Aquaculture (IMTA) Systems
Chapter 8 Market Estimates and Forecast, By Species, 2022 - 2035 (USD Billion) (Thousand Units)
- 8.1 Key trends
- 8.2 Finfish Farming
- 8.2.1 Salmonids (Atlantic Salmon, Trout, Arctic Char)
- 8.2.2 Tilapia & Catfish
- 8.2.3 Sea Bass, Sea Bream & Mediterranean Species
- 8.2.4 Other Finfish (Carp, Tuna, Yellowtail)
- 8.3 Shrimp & Crustacean Farming
- 8.3.1 White Leg Shrimp (Litopenaeus vannamei)
- 8.3.2 Black Tiger Shrimp & Freshwater Prawns
- 8.3.3 Crab & Other Crustaceans
- 8.4 Shellfish & Mollusks Farming
- 8.4.1 Oysters & Mussels
- 8.4.2 Clams, Scallops & Other Bivalves
- 8.5 Seaweed & Aquatic Plants
- 8.5.1 Kelp & Brown Algae
- 8.5.2 Red Algae & Carrageenan-Producing Species
- 8.6 Others (Ornamental Fish, Alligators, Specialty Species)
Chapter 9 Market Estimates and Forecast, By End-user, 2022 - 2035 (USD Billion) (Thousand Units)
- 9.1 Key trends
- 9.2 Commercial Aquaculture Farms
- 9.2.1 Small & Medium-Sized Farms
- 9.2.2 Large-Scale Commercial & Corporate-Owned Operations
- 9.3 Research & Academic Institutions
- 9.4 Others (Government Bodies, Hatcheries & Aquaculture Cooperatives)
Chapter 10 Market Estimates & Forecast, By Region, 2022 - 2035, (USD Billion) (Thousand Units)
- 10.1 Key trends
- 10.2 North America
- 10.2.1 U.S.
- 10.2.2 Canada
- 10.3 Europe
- 10.3.1 Germany
- 10.3.2 U.K.
- 10.3.3 France
- 10.3.4 Italy
- 10.3.5 Spain
- 10.4 Asia Pacific
- 10.4.1 China
- 10.4.2 India
- 10.4.3 Japan
- 10.4.4 South Korea
- 10.4.5 Australia
- 10.5 Latin America
- 10.5.1 Brazil
- 10.5.2 Mexico
- 10.5.3 Argentina
- 10.6 MEA
- 10.6.1 UAE
- 10.6.2 Saudi Arabia
- 10.6.3 South Africa
Chapter 11 Company Profiles
- 11.1 AKVA Group
- 11.2 Innovasea Systems Inc.
- 11.3 ScaleAQ
- 11.4 Deep Trekker Inc.
- 11.5 Aquabyte
- 11.6 Signify Holding N.V.
- 11.7 ReelData AI
- 11.8 XpertSea (Kampi)
- 11.9 CageEye AS
- 11.10 Bluegrove AS
- 11.11 BioSort AS
- 11.12 In-Situ Inc.
- 11.13 SeaRAS AS
- 11.14 Skretting - Nutreco
- 11.15 Cathx Ocean
- 11.16 Tidal (TidalX AI Inc.)
- 11.17 AQ1 Systems Pty Ltd
- 11.18 Manolin Inc.
- 11.19 YSI, a Xylem brand (Xylem Inc.)
- 11.20 Aqualytics AS
- 11.21 Dynamic FishEye (a brand of Dynamic AS)
- 11.22 Pentair Aquatic Eco-Systems (Pentair Inc.)

 2026年全球數位化工作指導平台市場報告
 智慧包裝自動化市場預測(2034 年)—按包裝類型、自動化解決方案、組件、硬體類型、技術、應用、最終用戶和地區分類的全球分析2026年全球箱體自動化系統市場報告
 2026-2030年全球紡織業自動化市場2034年航太航太機器人與自動化市場預測—全球機器人類型、自動化類型、飛機類型、技術、應用、最終用戶和區域分析人工智慧驅動的工業自動化市場預測至2034年——按組件、技術、產業、應用、最終用戶和地區分類的全球分析2026年全球舞台升降機自動化市場報告洗衣自動化系統市場預測—全球產品類型、系統類型、自動化程度、技術、應用、最終用戶和地區分析—2034年2026年全球自動化外包市場報告2026年全球數位執行器市場報告