


 |
市場調查報告書
商品編碼
2071414
電動汽車連接器市場機會、成長促進因素、產業趨勢分析及2026-2035年預測EV Connector Market Opportunity, Growth Drivers, Industry Trend Analysis, and Forecast 2026 - 2035 |
||||||
全球電動車連接器市場預計到 2025 年將達到 42 億美元,年複合成長率為 15.1%,到 2035 年將達到 171 億美元。
汽車產業的結構性轉型推動了市場擴張。電氣化的發展顯著拓展了電動車連接器在充電基礎設施和車載系統的應用範圍。這種成長不僅源自於銷量的提升,也得益於電動出行平台的多元化,例如搭乘用電池式電動車、商用電動車和電動摩托車,每個平台都需要專門的連接器解決方案。隨著電動車產量的增加,每輛車的連接器數量也進一步增加,尤其是在採用高壓架構的情況下。政府對充電基礎設施的投資也加速了全球的部署。向800V電氣系統的重大技術變革也在改變產業格局,實現更快的充電速度和更高的動力系統效率。汽車製造商正在加速從400V平台向800V平台的過渡,以縮短充電時間並支援高性能電動車,這顯著增加了對先進連接器技術的需求。
| 市場範圍 | |
|---|---|
| 開始年份 | 2025 |
| 預測期 | 2026-2035 |
| 起始金額 | 42億美元 |
| 預測金額 | 171億美元 |
| 複合年成長率 | 15.1% |
預計到2025年,汽車連接器市佔率將達到68%,並在2026年至2035年間以14.5%的複合年成長率成長。這一領域正經歷著向「基於區域的電氣架構」的轉變,這種架構以更集中的運算模型取代了傳統的複雜佈線系統。這種轉變降低了佈線複雜性,減輕了車輛重量,提高了資料傳輸效率,並進一步提升了對先進汽車連接器系統的需求。
預計到2025年,線對線連接器市場佔有率將達到47.1%,並在2026年至2035年間以14.3%的複合年成長率成長。由於其可靠性和用於電力及訊號傳輸的簡易設計,線對線連接器在電動車平台中仍被廣泛應用。儘管隨著緊湊型電子架構的發展,其優勢正在逐漸減弱,但在需要高耐久性的配電系統、傳統佈線配置和汽車環境中,它們仍然至關重要。
美國電動車連接器市場預計到2025年將達到7.455億美元,並在2035年之前以14.8%的複合年成長率成長。市場成長的主要驅動力是特斯拉向NACS充電標準的過渡,這正在影響整個汽車製造商和充電基礎設施營運商的連接器設計策略。這一過渡增加了對雙相容和高壓直流連接器的需求,同時也有助於彌合生態系統碎片化。此外,聯邦政府的新能源汽車基礎設施(NEVI)資金支持了高速公路旁快速充電網路的大規模部署,進一步推動了市場擴張。
目錄
第1章:調查方法
第2章執行摘要
第3章 行業洞察
- 產業生態系分析
- 供應商情況
- 利潤率
- 成本結構
- 每個階段增加的價值
- 影響價值鏈的因素
- 中斷
- 影響產業的因素
- 成長促進因素
- 電動車的迅速普及
- 擴大充電基礎設施
- 向高壓平台過渡
- 車載電子設備密度不斷增加
- 產業潛在風險與挑戰
- 標準細分帶來的複雜性
- 原物料價格波動
- 市場機遇
- 無線充電的興起
- 大型電動車的電氣化
- 進入新興市場
- 智慧連接器整合
- 成長促進因素
- 成長潛力分析
- 技術與創新展望
- 最新科技趨勢
- 新興技術
- 價格分析
- 對過去價格趨勢的分析
- 依球員類型分類的定價策略(高級球員、超值球員、成本加成球員)
- 監理情勢
- 北美洲
- SAE International
- 美國國家公路交通安全管理局(NHTSA)
- 歐洲
- 歐盟委員會
- 歐洲標準化委員會(CEN-CENELEC)
- 亞太地區
- 中國工業及資訊化部(工信部)
- 印度標準局(BIS)
- 拉丁美洲
- 巴西國家計量、品質與技術研究院(INMETRO)
- 墨西哥經濟部(SE)
- 中東和非洲
- 海灣標準化組織(GSO)
- 南非標準局(SABS)
- 北美洲
- 波特的分析
- PESTLE分析
- 專利分析
- 貿易數據分析
- 進出口量及進口額趨勢
- 主要貿易路線及關稅的影響
- 人工智慧和生成式人工智慧對市場的影響
- 利用人工智慧改造現有經營模式
- 按細分市場分類的生成式人工智慧用例和部署藍圖
- 風險、限制和監管考量
- 生產能力和生產情況
- 生產能力:按地區和主要生產商分類
- 運轉率和擴張計劃
- 永續性和環境方面
- 永續計劃
- 減少廢棄物策略
- 生產中的能源效率
- 具有環保意識的舉措
- 考慮碳足跡
- 預測假設和情境分析
- 基本案例:驅動複合年成長率的關鍵宏觀經濟與產業變量
- 樂觀情境:宏觀經濟與產業的順風
- 悲觀情景:宏觀經濟放緩或產業逆風
第4章 競爭情勢
- 介紹
- 企業市佔率分析
- 北美洲
- 歐洲
- 亞太地區
- 拉丁美洲
- 中東和非洲
- 主要市場公司的競爭分析
- 競爭定位矩陣
- 主要進展
- 併購
- 夥伴關係和聯盟
- 新產品發布
- 業務拓展計劃及資金籌措
第5章 市場估算與預測:依連接器類型分類,2022-2035年
- 充電介面連接器
- 車輛連接器
第6章 市場估算與預測:以目前市場規模(t)計算,2022-2035年
- 交流連接器
- 直流連接器
- AC/DC 雙用途連接器
第7章 市場估計與預測:依應用領域分類,2022-2035年
- 收費
- 車身控制和內裝
- 資訊娛樂系統
- 動力傳動系統和引擎管理
- 電池管理系統
- 其他
第8章 市場估算與預測:依電壓分類,2022-2035年
- 低電壓連接器(低於60V)
- 中壓連接器(60V 至 400V)
- 高壓連接器(400V以上)
第9章 市場估計與預測:依連結方式分類,2022-2035年
- 線對線
- 導線連接到電路板
- 基板之間
第10章 市場估價與預測:依地區分類,2022-2035年
- 北美洲
- 美國
- 加拿大
- 歐洲
- 德國
- 法國
- 英國
- 義大利
- 西班牙
- 荷蘭
- 瑞典
- 挪威
- 波蘭
- 比利時
- 亞太地區
- 中國
- 印度
- 日本
- 韓國
- 印尼
- 越南
- 泰國
- 馬來西亞
- 澳洲
- 新加坡
- 拉丁美洲
- 巴西
- 墨西哥
- 阿根廷
- 中東和非洲
- 南非
- 沙烏地阿拉伯
- UAE
第11章:公司簡介
- 世界公司
- Amphenol
- Aptiv
- Hirose Electric
- Molex
- Rosenberger Hochfrequenztechnik
- Sumitomo Electric Industries
- TE Connectivity
- Yazaki
- 當地公司
- Fujikura
- Furukawa Electric
- HUBER+SUHNER
- JST(Japan Solderless Terminal)
- KOSTAL
- Leoni
- Mennekes Elektrotechnik
- Phoenix Contact E-Mobility
- 新興企業
- JONHON(Avic Jonhon Optronic)
- Luxshare-ICT
- SINBON Electronics
- Yonggui Electric Equipment
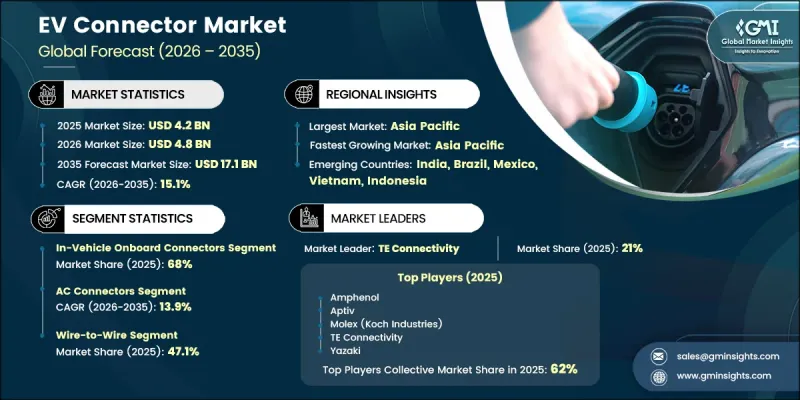
The Global EV Connector Market was valued at USD 4.2 billion in 2025 and is estimated to grow at a CAGR of 15.1% to reach USD 17.1 billion by 2035.
The market expansion is driven by a structural transformation in the automotive industry, where electrification is significantly broadening the application scope of EV connectors across charging infrastructure and in-vehicle systems. Growth is not only volume-driven but also shaped by increasing diversity in electric mobility platforms, including passenger battery electric vehicles, commercial EVs, and electric two-wheelers, each requiring specialized connector solutions. Rising EV production levels are further increasing connector content per vehicle, particularly with the adoption of high-voltage architectures. Government investments in charging infrastructure are accelerating deployment rates globally. A major technological shift toward 800V electrical systems is also reshaping the industry, enabling faster charging speeds and improved drivetrain efficiency. Automakers are increasingly transitioning from 400V to 800V platforms to reduce charging times and support high-performance electric vehicles, which is significantly strengthening demand for advanced connector technologies.
| Market Scope | |
|---|---|
| Start Year | 2025 |
| Forecast Year | 2026-2035 |
| Start Value | $4.2 Billion |
| Forecast Value | $17.1 Billion |
| CAGR | 15.1% |
The in-vehicle onboard connectors segment held a 68% share in 2025 and is expected to grow at a CAGR of 14.5% from 2026 to 2035. This segment is being reshaped by the shift toward zonal electrical architectures, which replace traditional complex wiring systems with more centralized computing models. This transition reduces wiring complexity, lowers vehicle weight, and enhances data transmission efficiency, further strengthening the demand for advanced onboard connector systems.
The wire-to-wire segment accounted for 47.1% share in 2025 and is projected to grow at a CAGR of 14.3% during 2026-2035. Wire-to-wire connectors continue to be widely used in EV platforms due to their reliability and straightforward design for power and signal transfer. Although their dominance is gradually easing due to evolving compact electronic architectures, they remain essential for power distribution systems, legacy wiring setups, and applications requiring high durability in automotive environments.
U.S. EV Connector Market reached USD 745.5 million in 2025 and is projected to grow at a CAGR of 14.8% through 2035. Market growth is being shaped by the transition toward the Tesla NACS charging standard, which is influencing connector design strategies across OEMs and charging infrastructure operators. This shift is increasing demand for dual-compatible and high-voltage DC connectors while helping reduce ecosystem fragmentation. Federal NEVI funding is also supporting large-scale deployment of highway fast-charging networks, further strengthening market expansion.
Major players operating in the EV connector industry include ABB, Amphenol, Aptiv, Harting, Hirose Electric, ITT, Mennekes Elektrotechnik, Molex (Koch Industries), Phoenix Contact, Rosenberger, Sumitomo Electric, TE Connectivity, and Yazaki. Companies in the EV connector market are prioritizing the development of high-voltage and fast-charging compatible connector systems to align with evolving EV architectures. Strong investment in R&D is enabling improved thermal performance, miniaturization, and durability. Strategic partnerships with automakers and charging infrastructure providers help accelerate product standardization and ecosystem compatibility. Manufacturers are expanding production capacities to meet rising EV demand while strengthening supply chain resilience. Integration of smart connectors with enhanced data communication capabilities is also gaining traction.
Table of Contents
Chapter 1 Methodology
- 1.1 Research approach
- 1.2 Quality commitments
- 1.3 GMI AI policy & data integrity commitment
- 1.4 Research trail & confidence scoring
- 1.4.1 Research trail components
- 1.4.2 Scoring components
- 1.5 Data collection
- 1.5.1 Partial list of primary sources
- 1.6 Data mining sources
- 1.6.1 Paid sources
- 1.7 Base estimates and calculations
- 1.7.1 Base year calculation
- 1.8 Forecast model
- 1.9 Research transparency addendum
Chapter 2 Executive Summary
- 2.1 Industry 360° synopsis
- 2.2 Key market trends
- 2.2.1 Regional
- 2.2.2 Connector
- 2.2.3 Current
- 2.2.4 Application
- 2.2.5 Voltage
- 2.2.6 Connection
- 2.3 TAM analysis, 2026-2035
- 2.4 CXO perspectives: Strategic imperatives
Chapter 3 Industry Insights
- 3.1 Industry ecosystem analysis
- 3.1.1 Supplier landscape
- 3.1.2 Profit margin
- 3.1.3 Cost structure
- 3.1.4 Value addition at each stage
- 3.1.5 Factor affecting the value chain
- 3.1.6 Disruptions
- 3.2 Industry impact forces
- 3.2.1 Growth drivers
- 3.2.1.1 Rapid EV adoption growth
- 3.2.1.2 Charging infrastructure expansion
- 3.2.1.3 High-voltage platform shift
- 3.2.1.4 Increasing onboard electronics density
- 3.2.2 Industry pitfalls and challenges
- 3.2.2.1 Standard fragmentation complexity
- 3.2.2.2 Raw material price volatility
- 3.2.3 Market opportunities
- 3.2.3.1 Wireless charging emergence
- 3.2.3.2 Heavy-duty EV electrification
- 3.2.3.3 Emerging market expansion
- 3.2.3.4 Smart connector integration
- 3.2.1 Growth drivers
- 3.3 Growth potential analysis
- 3.4 Technology and innovation landscape
- 3.4.1 Current technological trends
- 3.4.2 Emerging technologies
- 3.5 Pricing analysis (Driven by Primary Research)
- 3.5.1 Historical price trend analysis
- 3.5.2 Pricing strategy by player type (premium / value / cost-plus)
- 3.6 Regulatory landscape
- 3.6.1 North America
- 3.6.1.1 SAE International
- 3.6.1.2 National Highway Traffic Safety Administration (NHTSA)
- 3.6.2 Europe
- 3.6.2.1 European Commission (EC)
- 3.6.2.2 European Committee for Standardization (CEN-CENELEC)
- 3.6.3 Asia Pacific
- 3.6.3.1 Ministry of Industry and Information Technology (MIIT, China)
- 3.6.3.2 Bureau of Indian Standards (BIS)
- 3.6.4 Latin America
- 3.6.4.1 National Institute of Metrology, Quality and Technology (INMETRO - Brazil)
- 3.6.4.2 Mexican Secretariat of Economy (SE)
- 3.6.5 Middle East & Africa
- 3.6.5.1 Gulf Standardization Organization (GSO)
- 3.6.5.2 South African Bureau of Standards (SABS)
- 3.6.1 North America
- 3.7 Porter's analysis
- 3.8 PESTEL analysis
- 3.9 Patent analysis (Driven by Primary Research)
- 3.10 Trade data analysis (Driven by paid database)
- 3.10.1 Import/export volume & value trends
- 3.10.2 Key trade corridors & tariff impact
- 3.11 Impact of AI & Generative AI on the Market
- 3.11.1 AI-driven disruption of existing business models
- 3.11.2 Gen AI use cases & adoption roadmap by segment
- 3.11.3 Risks, limitations & regulatory considerations
- 3.12 Capacity & Production Landscape (Driven by Primary Research)
- 3.12.1 Production Capacity by Region & Key Producer
- 3.12.2 Capacity Utilization Rates & Expansion Pipelines
- 3.13 Sustainability and environmental aspects
- 3.13.1 Sustainable practices
- 3.13.2 Waste reduction strategies
- 3.13.3 Energy efficiency in production
- 3.13.4 Eco-friendly initiatives
- 3.13.5 Carbon footprint considerations
- 3.14 Forecast assumptions & scenario analysis (Driven by primary research)
- 3.14.1 Base Case - key macro & industry variables driving CAGR
- 3.14.2 Optimistic Scenarios - Favorable macro and industry tailwinds
- 3.14.3 Pessimistic Scenario - Macroeconomic slowdown or industry headwinds
Chapter 4 Competitive Landscape, 2025
- 4.1 Introduction
- 4.2 Company market share analysis
- 4.2.1 North America
- 4.2.2 Europe
- 4.2.3 Asia Pacific
- 4.2.4 LATAM
- 4.2.5 MEA
- 4.3 Competitive analysis of major market players
- 4.4 Competitive positioning matrix
- 4.5 Key developments
- 4.5.1 Mergers & acquisitions
- 4.5.2 Partnerships & collaborations
- 4.5.3 New product launches
- 4.5.4 Expansion plans and funding
Chapter 5 Market Estimates & Forecast, By Connector, 2022 - 2035 ($Mn, Mn units)
- 5.1 Key trends
- 5.2 Charging interface connectors
- 5.3 In-vehicle onboard connectors
Chapter 6 Market Estimates & Forecast, By Current, 2022 - 2035 ($Mn, Mn units)
- 6.1 Key trends
- 6.2 AC connectors
- 6.3 DC connectors
- 6.4 Combined AC/DC connectors
Chapter 7 Market Estimates & Forecast, By Application, 2022 - 2035 ($Mn, Mn units)
- 7.1 Key trends
- 7.2 Charging
- 7.3 Body control & interiors
- 7.4 Infotainment systems
- 7.5 Powertrain & engine management
- 7.6 Battery management system
- 7.7 Others
Chapter 8 Market Estimates & Forecast, By Voltage, 2022 - 2035 ($Mn, Mn units)
- 8.1 Key trends
- 8.2 Low voltage connectors (<60V)
- 8.3 Medium voltage connectors (60V-400V)
- 8.4 High voltage connectors (>400V)
Chapter 9 Market Estimates & Forecast, By Connection, 2022 - 2035 ($Mn, Mn units)
- 9.1 Key trends
- 9.2 Wire-to-wire
- 9.3 Wire-to-board
- 9.4 Board-to-board
Chapter 10 Market Estimates & Forecast, By Region, 2022 - 2035 ($Mn, Mn units)
- 10.1 Key trends
- 10.2 North America
- 10.2.1 U.S.
- 10.2.2 Canada
- 10.3 Europe
- 10.3.1 Germany
- 10.3.2 France
- 10.3.3 UK
- 10.3.4 Italy
- 10.3.5 Spain
- 10.3.6 Netherlands
- 10.3.7 Sweden
- 10.3.8 Norway
- 10.3.9 Poland
- 10.3.10 Belgium
- 10.4 Asia Pacific
- 10.4.1 China
- 10.4.2 India
- 10.4.3 Japan
- 10.4.4 South Korea
- 10.4.5 Indonesia
- 10.4.6 Vietnam
- 10.4.7 Thailand
- 10.4.8 Malaysia
- 10.4.9 Australia
- 10.4.10 Singapore
- 10.5 Latin America
- 10.5.1 Brazil
- 10.5.2 Mexico
- 10.5.3 Argentina
- 10.6 MEA
- 10.6.1 South Africa
- 10.6.2 Saudi Arabia
- 10.6.3 UAE
Chapter 11 Company Profiles
- 11.1 Global players
- 11.1.1 Amphenol
- 11.1.2 Aptiv
- 11.1.3 Hirose Electric
- 11.1.4 Molex
- 11.1.5 Rosenberger Hochfrequenztechnik
- 11.1.6 Sumitomo Electric Industries
- 11.1.7 TE Connectivity
- 11.1.8 Yazaki
- 11.2 Regional players
- 11.2.1 Fujikura
- 11.2.2 Furukawa Electric
- 11.2.3 HUBER+SUHNER
- 11.2.4 JST (Japan Solderless Terminal)
- 11.2.5 KOSTAL
- 11.2.6 Leoni
- 11.2.7 Mennekes Elektrotechnik
- 11.2.8 Phoenix Contact E-Mobility
- 11.3 Emerging players
- 11.3.1 JONHON (Avic Jonhon Optronic)
- 11.3.2 Luxshare-ICT
- 11.3.3 SINBON Electronics
- 11.3.4 Yonggui Electric Equipment
 電動車連接器市場 - 全球產業規模、佔有率、趨勢、機會、預測:按充電等級類型、充電速度類型、最終用戶類型、地區和競爭格局分類,2021-2031年
 電動汽車電氣連接器市場報告:趨勢、預測和競爭分析(至2035年)
 2026年全球電動車(EV)連接器市場報告
 全球電動車充電連接器市場規模、佔有率、趨勢和成長分析報告(2026-2034年)
 電動車連接器市場:2026-2032年全球市場預測(按車輛類型、充電方式、網路類型、輸出功率、最終用戶和分銷管道分類)電動車線束和連接器市場:按產品類型、連接類型、電動車、導體材料、電壓等級、車輛類型、應用、最終用戶和銷售管道分類-2026-2032年全球市場預測汽車流體輸送系統快速接頭市場按系統類型、材料、接頭類型、車輛類型、端部接頭類型、應用和製造方法分類,全球預測,2026-2032年
 全球電動車連接器市場(按應用、系統、電壓、連接、推進、組件和地區分類)- 預測至 2032 年
 電動車連接器市場規模及預測 2021 - 2031、全球及地區佔有率、趨勢及成長機會分析報告涵蓋範圍:按類型、連接類型、應用、推進類型、電壓和地理分類
 電動車線束和連接器市場 - 全球和區域分析:按車輛類型、按推進類型、按應用類型、按產品類型、按材料類型、按零件類型、按地區 - 分析和預測(2025-2035 年)