

 |
市場調查報告書
商品編碼
2071356
洗澡玩具市場機會、成長促進因素、產業趨勢分析及2026-2035年預測Bath Toy Market Opportunity, Growth Drivers, Industry Trend Analysis, and Forecast 2026 - 2035 |
||||||

據估計,到 2025 年,全球洗澡玩具市場價值將達到 15 億美元,年複合成長率為 6.2%,到 2035 年將達到 28 億美元。
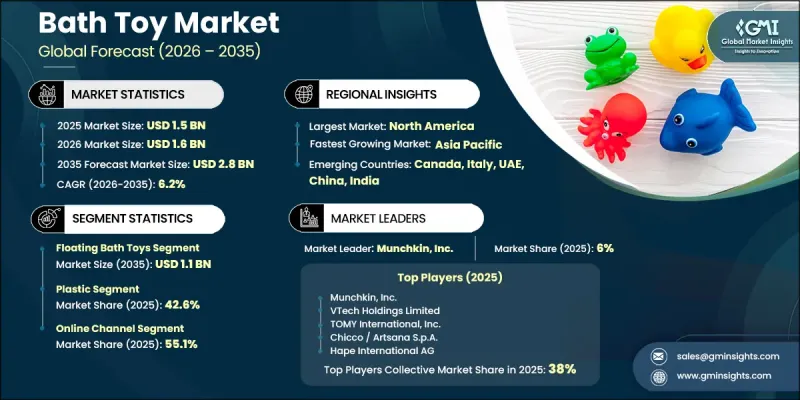
市場擴張受到多種因素的共同影響,包括兒童發展優先事項的調整、父母期望的不斷變化以及對產品安全標準的日益關注。消費者的行為越來越受到對材料品質、環境問題以及玩具和育兒生態系統整體趨勢的關注。雖然傳統的充氣玩具仍然具有文化意義,但產品需求正穩步轉向更具互動性、教育性和永續性的設計。如今的父母比以往任何時候都更了解情況,他們會根據安全認證、發展價值和材料成分來積極評估洗澡玩具,這正在重塑高階和大眾市場的購買決策。同時,可支配收入的成長和對幼兒早期發展投入的增加也推動了穩定的市場需求。此外,數位零售通路的拓展擴大了產品的供應範圍,使製造商能夠接觸到更廣泛的消費者群。因此,設計創新、以學習為基礎的功能以及環保生產正成為市場競爭的核心,洗澡玩具也逐漸成為現代父母日常生活中兼具娛樂性和發展輔助功能的工具。
| 市場範圍 | |
|---|---|
| 開始年份 | 2025 |
| 預測期 | 2026-2035 |
| 初始市場規模 | 15億美元 |
| 預計金額 | 28億美元 |
| 複合年成長率 | 6.2% |
隨著家長在重視孩子娛樂的同時,也越來越重視他們的認知和感官發展,教育功能正成為洗澡玩具市場的主要成長要素。洗澡玩具不再只是被視為玩具,而是被視為支持早期學習、創造力和運動技能發展的工具。這種觀念的轉變促使製造商推出兼具趣味性和系統性學習效果的產品,從而提升了消費者對創新技能培養玩具的興趣。
預計到2025年,漂浮式洗澡玩具市場規模將達6億美元,到2035年將達到11億美元。對於那些偏好簡單易用、趣味性強的兒童洗澡產品的家長來說,漂浮式玩具的需求依然強勁。這類玩具之所以受歡迎,是因為它們使用方便,對嬰幼兒安全,並且能夠幫助孩子儘早熟悉水,進行有趣的互動。作為幫助幼兒養成良好洗澡習慣的重要入門產品,漂浮式洗澡玩具繼續發揮至關重要的作用。
截至2025年,塑膠製品將佔據42.6%的市場。由於塑膠具有成本效益高、經久耐用和設計柔軟性等優點,因此在浴缸玩具製造領域仍被廣泛應用。塑膠易於模製成各種形狀和鮮豔的顏色,並具有優異的防水性能,這些都使其優勢得以延續。製造商之所以繼續青睞塑膠材料,是因為它們既能實現大規模生產,又能保持產品設計兼具功能性和視覺吸引力。
預計到2025年,美國洗澡玩具市佔率將達到79%。美國市場強勁成長得益於每年約360萬的穩定出生率,為兒童照護產品提供了堅實的消費群。家庭在促進兒童安全和發育的產品上的高支出進一步推動了市場需求。消費者對產品的高度認知以及對經過認證、品質有保證的玩具的偏好,持續維持著零售和線上通路的高市場滲透率。
目錄
第1章:調查方法
第2章執行摘要
第3章 行業洞察
- 產業生態系分析
- 影響價值鏈的因素
- 利潤率分析
- 中斷
- 前景
- 製造商
- 中斷
- 供應商情況
- 主要新聞和舉措
- 監理情勢
- 歐盟玩具安全指令(ASTM F963、EN 71、ISO 8124)
- 材料安全和化學品合規性(REACH、RoHS、CPSIA)
- ISO 8124 國際標準
- 化學物質法規(REACH,65號提案)
- 影響因素
- 促進因素
- 產業潛在風險與挑戰
- 機會
- 2025年價格分析
- 2022-2025年歷史價格趨勢分析
- 依球員類型分類的定價策略(高級球員、超值球員、成本加成球員)
- 區域價格波動分析
- 原物料成本對價格的影響
- 消費者購買行為分析
- 人口趨勢
- 影響購買決策的因素
- 消費者產品採納
- 首選分銷管道
- 成長潛力分析
- 波特的分析
- PESTLE分析
- 貿易數據分析
- 進出口量及進口額趨勢
- 主要貿易路線及關稅的影響
- 出口目的地分析
- 原物料進口來源分析
- 人工智慧和生成式人工智慧對市場的影響
- 利用人工智慧改造現有經營模式
- 按細分市場分類的生成式人工智慧用例和部署藍圖
- 風險、限制和監管考量
- 目前分銷基礎設施和通路滲透情況
- 按地區與業態(現代零售與傳統零售)分類的通路覆蓋率
- 缺乏最後一公里基礎設施和不斷變化的管道
第4章 競爭情勢
- 介紹
- 企業市佔率分析
- 企業矩陣分析
- 主要市場公司的競爭分析
- 競爭定位矩陣
- 主要進展
- 併購
- 夥伴關係和聯盟
- 新產品發布
- 業務拓展計劃
第5章 市場估算與預測:依產品類型分類,2022-2035年
- 主要趨勢
- 浮動洗澡玩具
- 附吸盤的洗澡玩具
- 疊疊樂洗澡玩具
- 創意益智洗澡玩具
- 互動電子洗澡玩具
- 其他
第6章 市場估算與預測:依材料類型分類,2022-2035年
- 主要趨勢
- 塑膠
- 橡膠和矽膠
- 發泡體
- 永續且環保
第7章 市場估計與預測:依價格區間分類,2022-2035年
- 主要趨勢
- 價格低廉(10 美元以下)
- 中價位(10美元至30美元)
- 高價位(超過30美元)
第8章 市場估計與預測:依年齡層別分類,2022-2035年
- 主要趨勢
- 1歲以下
- 1-3歲
- 3歲以上
第9章 市場估價與預測:依通路分類,2022-2035年
- 線上
- 電子商務網站
- 公司網站
- 離線
- 大賣場和超級市場
- 百貨公司
- 專賣店
- 其他零售店
第10章 市場估價與預測:依地區分類,2022-2035年
- 北美洲
- 美國
- 加拿大
- 歐洲
- 德國
- 英國
- 法國
- 義大利
- 西班牙
- 亞太地區
- 中國
- 印度
- 日本
- 韓國
- 澳洲
- 拉丁美洲
- 巴西
- 墨西哥
- 阿根廷
- 中東和非洲
- UAE
- 沙烏地阿拉伯
- 南非
第11章:公司簡介
- 世界公司
- Mattel, Inc.
- VTech Holdings Limited
- Hape International AG
- TOMY International, Inc.
- Munchkin, Inc.
- Chicco/Artsana SpA
- 當地公司
- Maison Battat Inc.
- Green Toys, Inc.
- Infantino, LLC
- Luv n'Care, Ltd.
- Playgro Pty Ltd.
- Juratoys SAS
- Skip Hop, Inc.
- Learning Resources Inc.
- Edushape Ltd.
- 新興企業
- Yookidoo Ltd.
- Boon, Inc.
- WOW Toys
- Plan Creations Co., Ltd.
- Djeco
The Global Bath Toy Market was valued at USD 1.5 billion in 2025 and is estimated to grow at a CAGR of 6.2% to reach USD 2.8 billion by 2035.
Market expansion is shaped by a combination of child development priorities, evolving parental expectations, and heightened attention to product safety standards. Consumer behavior is increasingly influenced by awareness of material quality, environmental considerations, and broader trends within the toy and childcare ecosystem. While traditional floating toys continue to hold cultural relevance, product demand is steadily shifting toward more interactive, educational, and sustainability-focused designs. Parents are more informed today and actively evaluate bath toys based on safety certifications, developmental value, and material composition, which is reshaping purchasing decisions across both premium and mass-market segments. In parallel, rising disposable incomes and stronger spending on early childhood development are reinforcing steady demand. Digital retail channels are also expanding product accessibility, allowing manufacturers to reach a wider consumer base. As a result, innovation in design, learning-based functionality, and eco-friendly production is becoming central to market competition, positioning bath toys as both recreational and developmental tools within modern childcare routines.
| Market Scope | |
|---|---|
| Start Year | 2025 |
| Forecast Year | 2026-2035 |
| Start Value | $1.5 Billion |
| Forecast Value | $2.8 Billion |
| CAGR | 6.2% |
Educational features are becoming a key growth driver in the bath toy market, as parents increasingly prioritize cognitive and sensory development alongside entertainment. Bath toys are no longer seen only as playful accessories but are also recognized as tools that support early learning, creativity, and motor skill development. This shift in perception is encouraging manufacturers to introduce products that combine fun with structured learning outcomes, thereby strengthening consumer interest in innovative and skill-oriented toy designs.
The floating bath toys segment generated USD 600 million in 2025 and is projected to reach USD 1.1 billion by 2035. Demand for floating toys remains strong among parents who prefer simple and engaging bath-time products for young children. Their popularity is supported by ease of use, safety for infants, and their ability to encourage early water familiarity and playful interaction. These products continue to serve as an introductory category for establishing positive bathing routines among toddlers.
The plastic-based segment held a 42.6% share in 2025. Plastic remains widely used in bath toy manufacturing due to its cost efficiency, durability, and flexibility in design applications. Its ability to be molded into varied shapes and vibrant colors, along with strong water resistance, supports its continued dominance. Manufacturers continue to favor plastic materials as they enable scalable production while maintaining functional and visually appealing product designs.
United States Bath Toy Market held a 79% share in 2025. Market strength in the country is supported by consistent birth rates of approximately 3.6 million annually, creating a stable consumer base for childcare-related products. Strong household spending on child safety and developmental goods further reinforces demand. High product awareness and preference for certified, quality-assured toys continue to sustain strong market penetration across retail and online channels.
Key companies operating in the global bath toy industry include TOMY International, Inc., Hape International AG, Skip Hop, Inc., Infantino, LLC, Chicco / Artsana S.p.A., Mattel, Inc., VTech Holdings Limited, Boon, Inc., Edushape Ltd., Luv n' Care, Ltd., Green Toys, Inc., Maison Battat Inc., Djeco, Playgro Pty Ltd, Munchkin, Inc., Juratoys SAS, Learning Resources Inc., Plan Creations Co., Ltd., WOW Toys, and Yookidoo Ltd. Companies in the bath toy market are increasingly focusing on product innovation, integrating educational and sensory development features into toy designs to enhance value for parents. Many manufacturers are investing in sustainable and non-toxic materials to align with growing environmental awareness and safety expectations. Strengthening digital distribution networks and expanding e-commerce presence has become a priority to improve global reach. Firms are also leveraging strategic partnerships with childcare brands and retailers to improve visibility and market penetration.
Table of Contents
Chapter 1 Research Methodology
- 1.1 Research approach
- 1.2 Quality Commitments
- 1.2.1 GMI AI policy & data integrity commitment
- 1.2.1.1 Source consistency protocol
- 1.2.1 GMI AI policy & data integrity commitment
- 1.3 Research Trail & Confidence Scoring
- 1.3.1 Research Trail Components
- 1.3.2 Scoring Components
- 1.4 Data Collection
- 1.4.1 Partial list of primary sources
- 1.5 Data mining sources
- 1.5.1 Paid sources
- 1.5.1.1 Sources, by region
- 1.5.1 Paid sources
- 1.6 Base estimates and calculations
- 1.6.1 Base year calculation for any one approach
- 1.7 Forecast model
- 1.7.1 Quantified market impact analysis
- 1.7.1.1 Mathematical impact of growth parameters on forecast
- 1.7.1 Quantified market impact analysis
- 1.8 Research transparency addendum
- 1.8.1 Source attribution framework
- 1.8.2 Quality assurance metrics
- 1.8.3 Our commitment to trust
Chapter 2 Executive Summary
- 2.1 Industry 360° synopsis, 2022 - 2035
- 2.2 Key market trends
- 2.2.1 Regional trends
- 2.2.2 Product type trends
- 2.2.3 Material Type trends
- 2.2.4 Price Range trends
- 2.2.5 Age group trends
- 2.2.6 Distribution channel trends
Chapter 3 Industry Insights
- 3.1 Industry ecosystem analysis
- 3.1.1 Factor affecting the value chain
- 3.1.2 Profit margin analysis
- 3.1.3 Disruptions
- 3.1.4 Future outlook
- 3.1.5 Manufacturers
- 3.1.6 Distributors
- 3.2 Supplier landscape
- 3.3 Key news & initiatives
- 3.4 Regulatory landscape
- 3.4.1 EU Toy Safety Directive (ASTM F963, EN 71, ISO 8124)
- 3.4.2 Material Safety & Chemical Compliance (REACH, RoHS, CPSIA)
- 3.4.3 ISO 8124 International Standards
- 3.4.4 Chemical Restrictions (REACH, Prop 65)
- 3.5 Impact forces
- 3.5.1 Growth drivers
- 3.5.2 Industry pitfalls & challenges
- 3.5.3 Opportunities
- 3.6 Pricing analysis, 2025 (driven by primary research)
- 3.6.1 Historical price trend analysis (2022-2025)
- 3.6.2 Pricing strategy by player type (premium/value/cost-plus)
- 3.6.3 Regional price variation analysis
- 3.6.4 Impact of raw material costs on pricing
- 3.7 Consumer buying behavior analysis
- 3.7.1 Demographic trends
- 3.7.2 Factors affecting buying decisions
- 3.7.3 Consumer product adoption
- 3.7.4 Preferred distribution channel
- 3.8 Growth potential analysis
- 3.9 Porter's analysis
- 3.10 PESTEL analysis
- 3.11 Trade data analysis (driven by paid data base)
- 3.11.1 Import/export volume & value trends
- 3.11.2 Key trade corridors & tariff impact
- 3.11.3 Export destination analysis
- 3.11.4 Import source analysis for raw materials
- 3.12 Impact of AI & generative AI on the market
- 3.12.1 AI-driven disruption of existing business models
- 3.12.2 GenAI use cases & adoption roadmap by segment
- 3.12.3 Risks, limitations & regulatory considerations
- 3.13 Distribution infrastructure & channel penetration landscape (driven by primary research)
- 3.13.1 Channel coverage by region & format (modern vs. Traditional trade)
- 3.13.2 Last-mile infrastructure gaps & emerging channel shifts
Chapter 4 Competitive Landscape, 2025
- 4.1 Introduction
- 4.2 Company market share analysis
- 4.3 Company matrix analysis
- 4.4 Competitive analysis of major market players
- 4.5 Competitive positioning matrix
- 4.6 Key developments
- 4.6.1 Mergers & acquisitions
- 4.6.2 Partnerships & collaborations
- 4.6.3 New product launches
- 4.6.4 Expansion plans
Chapter 5 Market Estimates & Forecast, By Product Type, 2022-2035 (USD Billion) (Million Units)
- 5.1 Key Trends
- 5.2 Floating Bath Toys
- 5.3 Suction Bath Toys
- 5.4 Stacking Bath Toys
- 5.5 Creative & Educational Bath Toys
- 5.6 Interactive & Electronic Bath Toys
- 5.7 Others
Chapter 6 Market Estimates & Forecast, By Material Type, 2022-2035 (USD Billion) (Million Units)
- 6.1 Key Trends
- 6.2 Plastic
- 6.3 Rubber & Silicone
- 6.4 Foam
- 6.5 Sustainable & Eco-Friendly
Chapter 7 Market Estimates & Forecast, By Price Range, 2022-2035 (USD Billion) (Million Units)
- 7.1 Key Trends
- 7.2 Low (Under USD 10)
- 7.3 Medium (Under USD 10-USD 30)
- 7.4 High (Above USD 30)
Chapter 8 Market Estimates & Forecast, By Age Group, 2022-2035 (USD Billion) (Million Units)
- 8.1 Key Trends
- 8.2 Under 1 year
- 8.3 1-3 years
- 8.4 Above 3 years
Chapter 9 Market Estimates & Forecast, By Distribution Channel, 2022 - 2035, (USD Billion) (Million Units)
- 9.1 Key trends
- 9.2 Online
- 9.2.1 E-commerce website
- 9.2.2 Company owned website
- 9.3 Offline
- 9.3.1 Hypermarket/supermarket
- 9.3.2 Departmental stores
- 9.3.3 Specialized stores
- 9.3.4 Other retail stores
Chapter 10 Market Estimates & Forecast, By Region, 2022 - 2035, (USD Billion) (Million Units)
- 10.1 Key trends
- 10.2 North America
- 10.2.1 U.S.
- 10.2.2 Canada
- 10.3 Europe
- 10.3.1 Germany
- 10.3.2 U.K.
- 10.3.3 France
- 10.3.4 Italy
- 10.3.5 Spain
- 10.4 Asia Pacific
- 10.4.1 China
- 10.4.2 India
- 10.4.3 Japan
- 10.4.4 South Korea
- 10.4.5 Australia
- 10.5 Latin America
- 10.5.1 Brazil
- 10.5.2 Mexico
- 10.5.3 Argentina
- 10.6 MEA
- 10.6.1 UAE
- 10.6.2 Saudi Arabia
- 10.6.3 South Africa
Chapter 11 Company Profiles (Business Overview, Financial Data, Product Landscape, Strategic Outlook, SWOT Analysis)
- 11.1 Global players
- 11.1.1 Mattel, Inc.
- 11.1.2 VTech Holdings Limited
- 11.1.3 Hape International AG
- 11.1.4 TOMY International, Inc.
- 11.1.5 Munchkin, Inc.
- 11.1.6 Chicco / Artsana S.p.A.
- 11.2 Regional players
- 11.2.1 Maison Battat Inc.
- 11.2.2 Green Toys, Inc.
- 11.2.3 Infantino, LLC
- 11.2.4 Luv n' Care, Ltd.
- 11.2.5 Playgro Pty Ltd.
- 11.2.6 Juratoys SAS
- 11.2.7 Skip Hop, Inc.
- 11.2.8 Learning Resources Inc.
- 11.2.9 Edushape Ltd.
- 11.3 Emerging players
- 11.3.1 Yookidoo Ltd.
- 11.3.2 Boon, Inc.
- 11.3.3 WOW Toys
- 11.3.4 Plan Creations Co., Ltd.
- 11.3.5 Djeco

 浴室淋浴設備龍頭市場:全球市場預測,2026-2032年
 唇部磨砂膏市場規模、佔有率和成長分析:按產品類型、形態、分銷管道、最終用戶、原料來源和地區分類-2026-2033年產業預測
 高階沐浴及身體保養產品市場報告:趨勢、預測及競爭分析(至2035年)
 電動去角質器市場規模、佔有率和成長分析:按產品類型、電源、分銷管道、最終用戶、應用和地區分類-2026-2033年產業預測
 2026-2030年全球去角質產品及磨砂膏市場
 高階淋浴設備過濾器市場規模、佔有率、成長、全球產業分析、區域趨勢及2026年至2034年預測。
 淋浴設備產品市場:依產品類型、銷售管道、最終用戶和地區分類。沐浴球和冷壓皂市場:按產品類型、分銷管道和地區分類全球淋浴設備產品市場規模、佔有率、趨勢及成長分析報告(2026-2034)
 淋浴設備產品市場報告:依產品類型、通路和地區分類(2026-2034年)