


 |
市場調查報告書
商品編碼
2071339
非致命性武器市場:市場機會、成長要素、產業趨勢分析及2026-2035年預測Non-lethal weapons Market Opportunity, Growth Drivers, Industry Trend Analysis, and Forecast 2026 - 2035 |
||||||

2025 年全球非致命性武器市場規模預計為 91.3 億美元,預計到 2035 年將以 4.6% 的複合年成長率成長至 167.8 億美元。
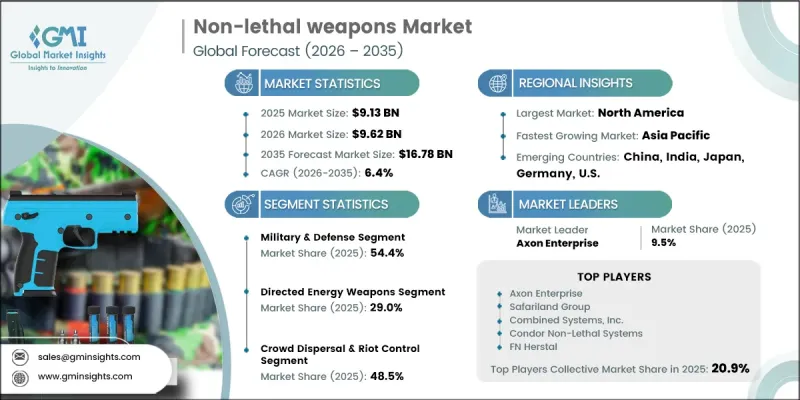
全球對公共安全的日益關注、社會動盪的加劇以及國防和國防安全保障現代化項目投資的增加,推動了市場擴張。各國政府和安全機構擴大採用非致命性解決方案來管理人群、維護法律和秩序,並降低戰術行動中人員傷亡和永久性傷害的風險。技術進步也發揮著至關重要的作用,非致命性系統的精確性、操作控制性和安全性不斷提升。節能系統、聲學裝置和其他先進威懾技術的創新,在提高效能的同時,也減少了附帶損害。軍事、執法機關和邊防安全部門對可靠、擴充性和高效的安全工具的需求日益成長。總而言之,市場正在不斷發展,以應對不斷變化的安全狀況、現代化努力以及對平衡的全球力量策略的需求。
| 市場範圍 | |
|---|---|
| 開始年份 | 2025 |
| 預測期 | 2026-2035 |
| 上市時的市場規模 | 91.3億美元 |
| 預測金額 | 167.8億美元 |
| 複合年成長率 | 4.6% |
到2025年,軍事和國防領域將佔54.4%的佔有率。這一主導地位主要歸功於非致命性系統在維和行動、邊防安全、反叛亂行動和人群控制等領域的日益普及。國防費用的增加和現代化建設的推進,進一步加速了非致命性系統在各軍種的應用。在維持作戰效能的同時最大限度地減少傷亡,也持續推動著這一領域的成長。
2025年,定向能量武器市佔率達29%,維持強勁動能。該領域的成長主要得益於安全和國防行動中對精確、遠程和可控打擊能力的需求不斷成長。這些系統因其能夠提高作戰精度並減少意外損害而備受青睞。對下一代國防技術的持續投入也進一步推動了該領域的成長動能。
預計到2025年,北美非致命性武器市場佔有率將達到32.1%,並繼續保持其作為主要區域市場的地位。該地區市場成長的主要驅動力來自軍方、執法機關和國防安全保障機構的強勁需求,這些機構致力於提升公共安全和作戰準備水準。日益加劇的社會動盪和安全疑慮也進一步推動了非致命性武器的普及。整體,國防和邊防安全系統現代化項目的持續投入也為該地區市場成長提供了支持。
目錄
第1章:調查方法和範圍
第2章執行摘要
第3章 行業洞察
- 產業生態系分析
- 供應商情況
- 利潤率
- 成本結構
- 每個階段增加的價值
- 影響價值鏈的因素
- 中斷
- 影響產業的因素
- 促進因素
- 內亂事件日益增多,對人群控制的需求也日益成長。
- 致命事故減少以及對人權問題的日益關注
- 加大對國防和國防安全保障的投入
- 非致命性武器系統的技術進步
- 對民用自衛產品的需求增加
- 產業潛在風險與挑戰
- 誤用和意外傷害的風險
- 嚴格的規章制度和道德考量
- 市場機遇
- 智慧、互聯和非致命技術的日益普及。
- 新興市場的業務拓展和邊防安全計劃
- 促進因素
- 成長潛力分析
- 監理情勢
- 北美洲
- 歐洲
- 亞太地區
- 拉丁美洲
- 中東和非洲
- 波特的分析
- PESTLE分析
- 技術與創新展望
- 最新科技趨勢
- 新興技術
- 價格趨勢
- 按地區
- 依產品
- 定價策略
- 新興經營模式
- 合規要求
- 專利和智慧財產權分析
第4章 競爭情勢
- 介紹
- 企業市佔率分析
- 按地區
- 北美洲
- 歐洲
- 亞太地區
- 拉丁美洲
- 中東和非洲
- 市場集中度分析
- 按地區
- 主要公司的競爭標竿分析
- 財務績效比較
- 收入
- 利潤率
- R&D
- 產品系列比較
- 產品線寬度
- 科技
- 創新
- 區域擴張比較
- 全球擴張分析
- 服務網路覆蓋
- 按地區分類的市場滲透率
- 競爭定位矩陣
- 領導者
- 挑戰者
- 追蹤者
- 小眾玩家
- 戰略展望矩陣
- 財務績效比較
- 主要進展
- 併購
- 夥伴關係和聯盟
- 技術進步
- 擴張和投資策略
- 數位轉型計劃
- 新興企業競爭公司和新創企業的發展趨勢
第5章 市場估算與預測:依產品類型分類,2022-2035年
- 定向能量武器
- 主動拒止系統(ADS)
- 雷射炫目裝置
- 基於微波的系統
- 其他
- 電擊武器
- 泰瑟槍和電擊式能量裝置(CED)
- 電擊棒
- 史丹巴頓
- 化學刺激物
- 辣椒噴霧(辣椒油樹脂)
- 催淚瓦斯(CS/CN)
- 其他
- 鈍頭彈
- 橡皮子彈
- 豆袋子彈
- 發泡
- 接力棒
- 其他
- 聲波武器
- 遠端聲波裝置(LRAD)
- 聲波感應裝置
- 視覺干擾因素
- 閃光彈和眩暈彈
- 基於雷射的視覺障礙裝置
- 防纏繞系統
- 網槍
- 車輛護欄及攔截裝置
- 固定陷阱
- 其他
- 其他
第6章 市場估算與預測:依最終用戶分類,2022-2035年
- 軍事/國防
- 執法機關
- 民和人身防衛
第7章 市場估計與預測:依應用領域分類,2022-2035年
- 驅散人群並鎮壓騷亂
- 周界安全和區域拒止
- 個人防護/自衛
- 其他
第8章 市場估計與預測:依地區分類,2022-2035年
- 北美洲
- 美國
- 加拿大
- 歐洲
- 德國
- 英國
- 法國
- 西班牙
- 義大利
- 亞太地區
- 中國
- 印度
- 日本
- 澳洲
- 韓國
- 拉丁美洲
- 巴西
- 墨西哥
- 阿根廷
- 中東和非洲
- 南非
- 沙烏地阿拉伯
- UAE
第9章:公司簡介
- 全球主要公司
- Axon Enterprise
- Safariland Group
- Combined Systems, Inc.
- Condor Non-Lethal Systems
- FN Herstal
- 該地區的主要公司
- 北美洲
- General Dynamics
- FLIR Systems
- L3Harris Technologies
- 亞太地區
- Amaron Systems
- Magforce
- Eurasia Non-Lethal Systems
- 歐洲
- Rheinmetall Defence
- Brugger &Thomet
- 北美洲
- 小眾玩家/顛覆者
- Defentec GmbH
- Nonlethal Technologies Ltd.
The Global Non-Lethal Weapons Market was valued at USD 9.13 billion in 2025 and is estimated to grow at a CAGR of 4.6% to reach USD 16.78 billion by 2035.
Market expansion is driven by rising global concerns related to public safety, increasing incidents of civil unrest, and growing investments in defense and homeland security modernization programs. Governments and security agencies are increasingly adopting less-lethal solutions to manage crowds, maintain law and order, and reduce the risk of fatalities or permanent injuries during tactical operations. Technological advancements are also playing a critical role, with continuous improvements in precision, operational control, and safety performance of non-lethal systems. Innovations in energy-based systems, acoustic devices, and other advanced deterrent technologies are enhancing effectiveness while reducing collateral damage. The demand for reliable, scalable, and efficient security tools is increasing across military, law enforcement, and border protection applications. Overall, the market is evolving in response to changing security dynamics, modernization initiatives, and the need for balanced force application strategies worldwide.
| Market Scope | |
|---|---|
| Start Year | 2025 |
| Forecast Year | 2026-2035 |
| Start Value | $9.13 Billion |
| Forecast Value | $16.78 Billion |
| CAGR | 4.6% |
The military and defense segment held a 54.4% share in 2025. This dominance is attributed to the growing use of less-lethal systems for peacekeeping missions, border protection, counter-insurgency operations, and controlled crowd management activities. Increased defense spending and modernization initiatives are further strengthening adoption across armed forces. The emphasis on minimizing injuries while maintaining operational effectiveness continues to support segment expansion.
The directed energy weapons segment accounted for 29% share in 2025, maintaining a strong position in the market. Growth in this category is supported by increasing deployment across security and defense operations that require precise, long-range, and controlled engagement capabilities. These systems are valued for their ability to reduce unintended damage while improving operational accuracy. Rising investment in next-generation defense technologies continues to reinforce segment momentum.
North America Non-Lethal Weapons Market captured 32.1% share in 2025 and remains a key regional contributor. Growth in the region is driven by strong demand from military forces, law enforcement agencies, and homeland security organizations focused on enhancing public safety and operational preparedness. Increasing occurrences of civil disturbances and rising security concerns are further encouraging adoption. Continuous investment in modernization programs across defense and border protection systems is also supporting regional market growth.
Key companies operating in the Global Non-Lethal Weapons Market include Rheinmetall Defence, Axon, Safariland Group, General Dynamics, Brugger & Thomet, FN Herstal, Combined Systems, Inc., Condor Non-Lethal Systems, Defentec GmbH, EnforceTac GmbH, Eurasia Non-Lethal Systems, FLIR Systems, Laser Technology GmbH, Magforce, NEXTER Systems, Nonlethal Technologies Ltd., POLICE Systems Ltd., Amaron Systems, Harris Corporation (L3 Technologies), and Trellisware Technologies. Companies in the non-lethal weapons market are strengthening their competitive position through continuous technological innovation, strategic defense collaborations, and expansion of product portfolios. A key focus is placed on developing advanced systems with improved accuracy, safety, and operational control to meet evolving security requirements. Firms are investing heavily in research and development to enhance directed energy systems, acoustic technologies, and advanced crowd-control solutions. Partnerships with defense agencies, law enforcement bodies, and homeland security organizations are helping companies secure long-term contracts and improve market penetration. Expansion into emerging defense markets is also a key strategy, supported by localized production and distribution networks. Companies are further emphasizing compliance with regulatory frameworks and international safety standards to ensure broader adoption.
Table of Contents
Chapter 1 Methodology and Scope
- 1.1 Market scope and definition
- 1.2 Research design
- 1.2.1 Research approach
- 1.2.2 Data collection methods
- 1.3 Data mining sources
- 1.3.1 Global
- 1.3.2 Regional/Country
- 1.4 Base estimates and calculations
- 1.4.1 Base year calculation
- 1.4.2 Key trends for market estimation
- 1.5 Primary research and validation
- 1.5.1 Primary sources
- 1.6 Forecast model
- 1.7 Research assumptions and limitations
Chapter 2 Executive Summary
- 2.1 Industry 360° synopsis, 2022 - 2035
- 2.2 Key market trends
- 2.2.1 Product Type trends
- 2.2.2 Application trends
- 2.2.3 End-user industry trends
- 2.2.4 Regional trends
- 2.3 TAM Analysis, 2026-2035
- 2.4 CXO perspectives: Strategic imperatives
Chapter 3 Industry Insights
- 3.1 Industry ecosystem analysis
- 3.1.1 Supplier Landscape
- 3.1.2 Profit Margin
- 3.1.3 Cost structure
- 3.1.4 Value addition at each stage
- 3.1.5 Factor affecting the value chain
- 3.1.6 Disruptions
- 3.2 Industry impact forces
- 3.2.1 Growth drivers
- 3.2.1.1 Increasing incidents of civil unrest and crowd control requirements
- 3.2.1.2 Growing focus on reducing fatalities and human rights concerns
- 3.2.1.3 Rising defense and homeland security investments
- 3.2.1.4 Technological advancements in non-lethal weapon systems
- 3.2.1.5 Increasing demand for civilian self-defense products
- 3.2.2 Industry pitfalls and challenges
- 3.2.2.1 Risk of misuse and accidental injuries
- 3.2.2.2 Stringent regulations and ethical concerns
- 3.2.3 Market opportunities
- 3.2.3.1 Growing adoption of smart and connected non-lethal technologies
- 3.2.3.2 Expansion in emerging economies and border security programs
- 3.2.1 Growth drivers
- 3.3 Growth potential analysis
- 3.4 Regulatory landscape
- 3.4.1 North America
- 3.4.2 Europe
- 3.4.3 Asia Pacific
- 3.4.4 Latin America
- 3.4.5 Middle East & Africa
- 3.5 Porter's analysis
- 3.6 PESTEL analysis
- 3.7 Technology and Innovation landscape
- 3.7.1 Current technological trends
- 3.7.2 Emerging technologies
- 3.8 Price trends
- 3.8.1 By region
- 3.8.2 By product
- 3.9 Pricing Strategies
- 3.10 Emerging Business Models
- 3.11 Compliance Requirements
- 3.12 Patent and IP analysis
Chapter 4 Competitive Landscape, 2025
- 4.1 Introduction
- 4.2 Company market share analysis
- 4.2.1 By region
- 4.2.1.1 North America
- 4.2.1.2 Europe
- 4.2.1.3 Asia Pacific
- 4.2.1.4 Latin America
- 4.2.1.5 Middle East & Africa
- 4.2.2 Market concentration analysis
- 4.2.1 By region
- 4.3 Competitive benchmarking of key players
- 4.3.1 Financial performance comparison
- 4.3.1.1 Revenue
- 4.3.1.2 Profit margin
- 4.3.1.3 R&D
- 4.3.2 Product portfolio comparison
- 4.3.2.1 Product range breadth
- 4.3.2.2 Technology
- 4.3.2.3 Innovation
- 4.3.3 Geographic presence comparison
- 4.3.3.1 Global footprint analysis
- 4.3.3.2 Service network coverage
- 4.3.3.3 Market penetration by region
- 4.3.4 Competitive positioning matrix
- 4.3.4.1 Leaders
- 4.3.4.2 Challengers
- 4.3.4.3 Followers
- 4.3.4.4 Niche players
- 4.3.5 Strategic outlook matrix
- 4.3.1 Financial performance comparison
- 4.4 Key developments
- 4.4.1 Mergers and acquisitions
- 4.4.2 Partnerships and collaborations
- 4.4.3 Technological advancements
- 4.4.4 Expansion and investment strategies
- 4.4.5 Digital transformation initiatives
- 4.5 Emerging/ startup competitors landscape
Chapter 5 Market Estimates and Forecast, By Product Type, 2022 - 2035 (USD Billion)
- 5.1 Key trends
- 5.2 Directed Energy Weapons
- 5.2.1 Active Denial Systems (ADS)
- 5.2.2 Laser Dazzlers
- 5.2.3 Microwave-Based Systems
- 5.2.4 Others
- 5.3 Electroshock Weapons
- 5.3.1 Tasers & Conducted Energy Devices (CEDs)
- 5.3.2 Stun Guns
- 5.3.3 Stun Batons
- 5.4 Chemical Irritants
- 5.4.1 Pepper Spray (Oleoresin Capsicum)
- 5.4.2 Tear Gas (CS/CN)
- 5.4.3 Others
- 5.5 Blunt Impact Munitions
- 5.5.1 Rubber Bullets
- 5.5.2 Bean Bag Rounds
- 5.5.3 Foam Projectiles
- 5.5.4 Baton Rounds
- 5.5.5 Others
- 5.6 Acoustic Weapons
- 5.6.1 Long Range Acoustic Devices (LRAD)
- 5.6.2 Sonic Hailing Devices
- 5.7 Optical Distracters
- 5.7.1 Flashbangs & Stun Grenades
- 5.7.2 Laser-Based Optical Distractors
- 5.8 Entanglement Systems
- 5.8.1 Net Guns
- 5.8.2 Vehicle Barriers & Stopping Equipment
- 5.8.3 Immobilization Traps
- 5.8.4 Others
- 5.9 Others
Chapter 6 Market Estimates and Forecast, By End User, 2022 - 2035 (USD Billion)
- 6.1 Key trends
- 6.2 Military & Defense
- 6.3 Law Enforcement
- 6.4 Civilian & Personal Defense
Chapter 7 Market Estimates and Forecast, By Application, 2022 - 2035 (USD Billion)
- 7.1 Key trends
- 7.2 Crowd Dispersal & Riot Control
- 7.3 Perimeter Security & Area Denial
- 7.4 Personal Protection & Self-Defense
- 7.5 Others
Chapter 8 Market Estimates and Forecast, By Region, 2022 - 2035 (USD Billion)
- 8.1 Key trends
- 8.2 North America
- 8.2.1 U.S.
- 8.2.2 Canada
- 8.3 Europe
- 8.3.1 Germany
- 8.3.2 UK
- 8.3.3 France
- 8.3.4 Spain
- 8.3.5 Italy
- 8.4 Asia Pacific
- 8.4.1 China
- 8.4.2 India
- 8.4.3 Japan
- 8.4.4 Australia
- 8.4.5 South Korea
- 8.5 Latin America
- 8.5.1 Brazil
- 8.5.2 Mexico
- 8.5.3 Argentina
- 8.6 Middle East and Africa
- 8.6.1 South Africa
- 8.6.2 Saudi Arabia
- 8.6.3 UAE
Chapter 9 Company Profiles
- 9.1 Global Key Players
- 9.1.1 Axon Enterprise
- 9.1.2 Safariland Group
- 9.1.3 Combined Systems, Inc.
- 9.1.4 Condor Non-Lethal Systems
- 9.1.5 FN Herstal
- 9.2 Regional key players
- 9.2.1 North America
- 9.2.1.1 General Dynamics
- 9.2.1.2 FLIR Systems
- 9.2.1.3 L3Harris Technologies
- 9.2.2 Asia Pacific
- 9.2.2.1 Amaron Systems
- 9.2.2.2 Magforce
- 9.2.2.3 Eurasia Non-Lethal Systems
- 9.2.2.4 Europe
- 9.2.2.5 Rheinmetall Defence
- 9.2.2.6 Brugger & Thomet
- 9.2.1 North America
- 9.3 Niche Players/Disruptors
- 9.3.1 Defentec GmbH
- 9.3.2 Nonlethal Technologies Ltd.

 化學非致命武器市場報告:趨勢、預測和競爭分析(至2035年)
 全球非致命武器市場規模、佔有率、趨勢和成長分析報告(2026-2034年)
 非致命性武器市場-2026-2032年全球市場預測全球非致命性武器市場:2026-2036年
 2026年全球催淚瓦斯市場報告2026年全球非致命性生化武器市場報告2026年全球非致命性自衛武器系統市場報告2026年全球非致命武器市場報告
 全球非致命武器市場:市場規模、佔有率和趨勢分析(按產品、最終用途和地區分類),細分市場預測(2026-2033 年)非致命性武器市場規模、佔有率、成長及全球產業分析:按類型和應用分類,區域洞察及2026-2034年預測