

 |
市場調查報告書
商品編碼
2071327
家用吸塵器市場商機、成長要素、產業趨勢分析及2026-2035年預測。Household Vacuum Cleaner Market Opportunity, Growth Drivers, Industry Trend Analysis, and Forecast 2026 - 2035 |
||||||

預計到 2025 年,全球家用吸塵器市場價值將達到 203 億美元,並預計以 6.1% 的複合年成長率成長,到 2035 年達到 367 億美元。
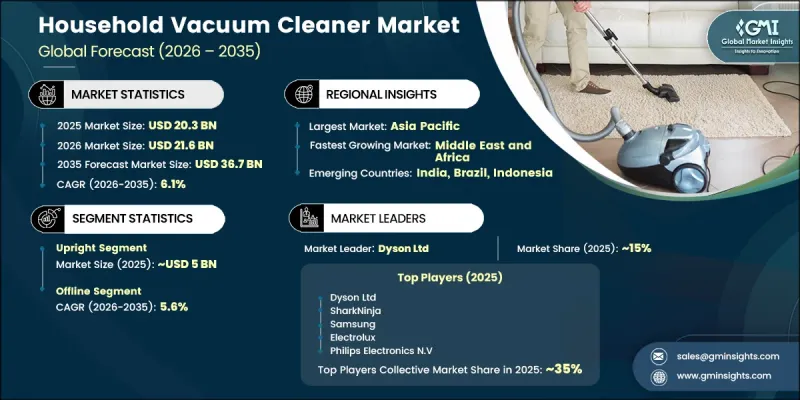
市場成長主要受家庭收入成長、快速都市化以及產品設計和清潔效率不斷提升的驅動。人們對室內空氣品質和衛生意識的提高也顯著促進了全球家庭對產品的接受度。隨著時間的推移,消費者需求已從傳統的有線立式和水平式吸塵器轉向無線和機器人吸塵器,其中高階和中階市場均呈現強勁成長勢頭。成熟市場的更換需求持續支撐著強勁的銷售,而開發中國家的初期產品上市正在擴大消費群。在已開發地區,快速的技術創新和新機型性能的提升正在縮短更換週期。相較之下,新興市場則受益於零售網路的擴張和品牌滲透率的提高。亞太地區由於都市區的快速成長,仍然是重要的成長區域,而北美和西歐則在高級產品滲透率的支撐下保持著強勁的銷售勢頭。機器人吸塵器是成長最快的細分市場,反映出消費者對自動化和智慧家庭整合的濃厚興趣。
| 市場範圍 | |
|---|---|
| 開始年份 | 2025 |
| 預測期 | 2026-2035 |
| 上市時的市場規模 | 203億美元 |
| 預測金額 | 367億美元 |
| 複合年成長率 | 6.1% |
預計到2025年,立式吸塵器市場規模將達到50億美元,並在2035年之前以4.8%的複合年成長率成長。由於其強大的吸力和徹底清潔的特性,該細分市場的需求持續保持穩定。儘管小型自動化吸塵器越來越受歡迎,但重視大容量集塵機和穩定吸力的消費者仍然偏好直立式吸塵器。
預計到2025年,線下銷售管道將佔據65.1%的市場佔有率,並在2035年之前以5.6%的複合年成長率成長。該管道之所以保持主導地位,是因為消費者在購買前更傾向於實際體驗產品特性,例如吸力、人體工學設計和噪音水平。尤其對於高階產品而言,商店展示和上手體驗仍對購買決策產生重要影響。成熟的零售網路對於提升品牌知名度和提高全球市場的銷售轉換率仍然至關重要。
美國家用吸塵器市場預計到2025年將達到32億美元,並在2035年之前以5.2%的複合年成長率成長。市場成長的主要驅動力是消費性電子產品的高滲透率、對智慧互聯清潔解決方案的強勁需求以及成熟的零售和電子商務生態系統。消費者越來越傾向於偏好具備無線操作、智慧導航和高效過濾系統等先進功能的吸塵器。能源效率標準和認證項目也在影響消費者的購買決策,尤其是在高階市場。同時,大型零售連鎖店持續為領先品牌提供強而有力的分銷支援。
目錄
第1章:調查方法
第2章執行摘要
第3章 行業洞察
- 產業生態系分析
- 供應商情況
- 製造商
- 中斷
- 零售商
- 利潤率分析
- 每個階段增加的價值
- 影響價值鏈的因素
- 影響產業的因素
- 促進因素
- 都市化和家庭可支配所得的增加
- 馬達效率、電池性能和機器人導航方面的技術創新。
- 人們對室內空氣品質和過敏原管理的認知不斷提高
- 產業潛在風險與挑戰
- 電子廢棄物的產生及永續性合規壓力
- 激烈的價格競爭
- 機會
- 促進因素
- 成長潛力分析
- 技術與創新展望
- 最新科技趨勢
- 新興技術
- 價格趨勢
- 按地區
- 依產品類型
- 貿易數據分析
- 監理情勢
- 標準和合規要求
- 區域監理框架
- 認證標準
- 波特的分析
- PESTLE分析
- 人工智慧和生成式人工智慧對市場的影響
- 利用人工智慧改造現有經營模式
- 按細分市場分類的生成式人工智慧用例和部署藍圖
- 風險、限制和監管考量
- 消費行為分析
- 人口趨勢
- 影響購買決策的因素
- 消費者產品採納
- 首選分銷管道
- 理想價格範圍
第4章 競爭情勢
- 介紹
- 企業市佔率分析
- 按地區
- 企業矩陣分析
- 主要市場公司的競爭分析
- 競爭定位矩陣
- 主要進展
- 併購
- 夥伴關係和聯盟
- 新產品發布
- 業務拓展計劃
第5章 市場估算與預測:依產品類型分類,2022-2035年
- 機器人吸塵器
- 棒式/手持式
- 直立
- 罐
- 乾濕兩用
- 其他
第6章 市場估計與預測:依技術分類,2022-2035年
- 傳統的
- 智慧/互聯
第7章 市場估計與預測:依電源類型分類,2022-2035年
- 帶繩子
- 無線
第8章 市場估算與預測:以桶型分類,2022-2035年
- 已裝袋
- 無袋
第9章 市場估價與預測:依通路分類,2022-2035年
- 線上
- 公司網站
- 電子商務網站
- 離線
- 超級市場和大賣場
- 專賣店
- 其他
第10章 市場估價與預測:依地區分類,2022-2035年
- 北美洲
- 美國
- 加拿大
- 歐洲
- 德國
- 英國
- 法國
- 義大利
- 西班牙
- 瑞典
- 荷蘭
- 亞太地區
- 中國
- 印度
- 日本
- 韓國
- 澳洲
- 印尼
- 拉丁美洲
- 巴西
- 墨西哥
- 阿根廷
- 中東和非洲
- 沙烏地阿拉伯
- UAE
- 南非
第11章:公司簡介
- 世界公司
- Philips Electronics NV
- Dyson Ltd
- SharkNinja
- Samsung
- Electrolux
- LG Electronics Inc
- Panasonic Corporation
- BSH Home Appliances Group
- 當地公司
- Ecovacs
- Roborock
- Dreame Technology
- Midea
- Hoover
- Miele
- iRobot
-
- Bissell
- Rowenta
- Vorwerk & Co. Interhold AG
- Eureka
- Black+Decker
- Shojiki
The Global Household Vacuum Cleaner Market was valued at USD 20.3 billion in 2025 and is estimated to grow at a CAGR of 6.1% to reach USD 36.7 billion by 2035.
Market growth is driven by rising household incomes, rapid urbanization, and continuous improvements in product design and cleaning efficiency. Increasing awareness of indoor air quality and hygiene is also contributing significantly to product adoption across global households. Over time, consumer demand has shifted from traditional corded upright and canister models toward cordless and robotic vacuum cleaners, which are gaining strong traction in both premium and mid-range categories. Replacement demand in mature markets continues to support steady sales, while first-time adoption in developing economies is expanding the consumer base. In developed regions, shorter replacement cycles are being driven by rapid technological upgrades and improved performance features in newer models. In contrast, emerging markets are benefiting from expanding retail networks and rising brand penetration. Asia Pacific remains a key growth region due to rapid urban household expansion, while North America and Western Europe continue to contribute strong revenue supported by premium product adoption. Robotic vacuum cleaners represent the fastest-growing segment, reflecting strong consumer interest in automation and smart home integration.
| Market Scope | |
|---|---|
| Start Year | 2025 |
| Forecast Year | 2026-2035 |
| Start Value | $20.3 Billion |
| Forecast Value | $36.7 Billion |
| CAGR | 6.1% |
The upright vacuum cleaner segment generated USD 5 billion in 2025 and is expected to grow at a CAGR of 4.8% through 2035. This segment continues to maintain relevance due to its strong suction performance and suitability for deep cleaning applications. Consumers preferring high-capacity dust collection and consistent cleaning power continue to favor upright models despite the rising popularity of compact and automated alternatives.
The offline distribution channel accounted for 65.1% share in 2025 and is projected to grow at a CAGR of 5.6% through 2035. This channel remains dominant as consumers prefer physical evaluation of product features such as suction strength, ergonomics, and noise levels before purchase. In-store demonstrations and hands-on product experiences continue to influence buying decisions, especially for high-end models. Established retail networks remain critical for brand visibility and sales conversion across global markets.
United States Household Vacuum Cleaner Market reached USD 3.2 billion in 2025 and is expected to grow at a CAGR of 5.2% through 2035. Market growth is supported by high appliance ownership rates, strong demand for smart and connected cleaning solutions, and a mature retail and e-commerce ecosystem. Consumer preferences are increasingly shaped by advanced features such as cordless operation, intelligent navigation, and high-efficiency filtration systems. Energy efficiency standards and certification programs also influence purchasing decisions, particularly in the premium segment, while large retail chains continue to provide strong distribution support for leading brands.
Key companies operating in the Global Household Vacuum Cleaner Market include Dyson Ltd, SharkNinja, Philips Electronics N.V, Samsung, Electrolux, LG Electronics Inc, Panasonic Corporation, BSH Home Appliances Group, Ecovacs, Roborock, Dreame Technology, Midea, Hoover, Miele, iRobot, Bissell, Rowenta, Vorwerk & Co. Interhold AG, Eureka, Black+Decker, and Shojiki. Companies in the household vacuum cleaner market are strengthening their competitive position through continuous product innovation, smart technology integration, and expansion of distribution channels. A major focus is placed on developing cordless, robotic, and AI-enabled vacuum cleaners that enhance convenience, efficiency, and automation in household cleaning. Manufacturers are investing heavily in research and development to improve suction performance, battery life, filtration systems, and noise reduction capabilities. Strategic partnerships with e-commerce platforms and retail chains are helping companies improve product visibility and accessibility. Firms are also expanding into smart home ecosystems by integrating vacuum cleaners with connected devices and mobile applications. Geographic expansion into emerging markets is another key strategy supported by localized production and marketing efforts. In addition, companies are enhancing after-sales services, warranty programs, and customer engagement initiatives to strengthen brand loyalty.
Table of Contents
Chapter 1 Research Methodology
- 1.1 Research approach
- 1.2 Quality Commitments
- 1.2.1 GMI AI policy & data integrity commitment
- 1.2.1.1 Source consistency protocol
- 1.2.1 GMI AI policy & data integrity commitment
- 1.3 Research trail & confidence scoring
- 1.3.1 Research trail components
- 1.3.2 Scoring components
- 1.4 Data Collection
- 1.4.1 Partial list of primary sources
- 1.5 Data mining sources
- 1.5.1 Paid sources
- 1.5.1.1 Sources, by region
- 1.5.1 Paid sources
- 1.6 Base estimates and calculations
- 1.6.1 Base year calculation
- 1.7 Forecast model
- 1.7.1 Quantified market impact analysis
- 1.7.1.1 Mathematical impact of growth parameters on forecast
- 1.7.1 Quantified market impact analysis
- 1.8 Research transparency addendum
- 1.8.1 Source attribution framework
- 1.8.2 Quality assurance metrics
- 1.8.3 Our commitment to trust
Chapter 2 Executive Summary
- 2.1 Industry 360° synopsis
- 2.2 Business trends
- 2.3 Regional
- 2.4 Product type
- 2.5 Technology
- 2.6 Power type
- 2.7 Bucket type
- 2.8 Distribution channel
Chapter 3 Industry Insights
- 3.1 Industry ecosystem analysis
- 3.1.1 Supplier landscape
- 3.1.2 Manufacturers
- 3.1.3 Distributors
- 3.1.4 Retailers
- 3.1.5 Profit margin analysis
- 3.1.6 Value addition at each stage
- 3.1.7 Factor affecting the value chain
- 3.2 Industry impact forces
- 3.2.1 Growth drivers
- 3.2.1.1 Urbanization and rising household disposable income
- 3.2.1.2 Technological innovation in motor efficiency, battery performance, and robotic navigation
- 3.2.1.3 Heightened awareness of indoor air quality and allergen management
- 3.2.2 Industry pitfalls & challenges
- 3.2.2.1 Electronic waste generation and sustainability compliance pressure
- 3.2.2.2 Intense price competition
- 3.2.3 Opportunities
- 3.2.1 Growth drivers
- 3.3 Growth potential analysis
- 3.4 Technology and innovation landscape
- 3.4.1 Current technological trends
- 3.4.2 Emerging technologies
- 3.5 Price trends
- 3.5.1 By region
- 3.5.2 By product type
- 3.6 Trade data analysis
- 3.7 Regulatory landscape
- 3.7.1 Standards and compliance requirements
- 3.7.2 Regional regulatory frameworks
- 3.7.3 Certification standards
- 3.8 Porter's analysis
- 3.9 PESTEL analysis
- 3.10 Impact of AI & generative AI on the market
- 3.10.1 AI-driven disruption of existing business models
- 3.10.2 GenAI use cases & adoption roadmap by segment
- 3.10.3 Risks, limitations & regulatory considerations
- 3.11 Consumer behavior analysis
- 3.11.1 Demographic trends
- 3.11.2 Factors affecting buying decision
- 3.11.3 Consumer product adoption
- 3.11.4 Preferred distribution channel
- 3.11.5 Preferred price range
Chapter 4 Competitive Landscape, 2025
- 4.1 Introduction
- 4.2 Company market share analysis
- 4.2.1 By Region
- 4.2.1.1 North America
- 4.2.1.2 Europe
- 4.2.1.3 Asia Pacific
- 4.2.1.4 Latin America
- 4.2.1.5 Middle East & Africa
- 4.2.1 By Region
- 4.3 Company matrix analysis
- 4.4 Competitive analysis of major market players
- 4.5 Competitive positioning matrix
- 4.6 Key developments
- 4.6.1 Mergers & acquisitions
- 4.6.2 Partnerships & collaborations
- 4.6.3 New product launches
- 4.6.4 Expansion plans
Chapter 5 Market Estimates & Forecast, By Product Type, 2022 - 2035, (USD Billion) (Units)
- 5.1 Key trends
- 5.2 Robotic Vacuum Cleaners
- 5.3 Stick/Handheld
- 5.4 Upright
- 5.5 Canister
- 5.6 Wet & Dry
- 5.7 Others
Chapter 6 Market Estimates & Forecast, By Technology, 2022 - 2035, (USD Billion) (Units)
- 6.1 Key trends
- 6.2 Conventional
- 6.3 Smart/Connected
Chapter 7 Market Estimates & Forecast, By Power Type, 2022 - 2035, (USD Billion) (Units)
- 7.1 Key trends
- 7.2 Corded
- 7.3 Cordless
Chapter 8 Market Estimates & Forecast, By Bucket Type, 2022 - 2035, (USD Billion) (Units)
- 8.1 Key trends
- 8.2 Bagged
- 8.3 Bagless
Chapter 9 Market Estimates & Forecast, By Distribution Channel, 2022 - 2035, (USD Billion) (Units)
- 9.1 Key trends
- 9.2 Online
- 9.2.1 Company Websites
- 9.2.2 E-commerce Websites
- 9.3 Offline
- 9.3.1 Supermarkets and Hypermarkets
- 9.3.2 Specialty Stores
- 9.3.3 Others
Chapter 10 Market Estimates & Forecast, By Region, 2022 - 2035, (USD Billion) (Units)
- 10.1 Key trends
- 10.2 North America
- 10.2.1 U.S
- 10.2.2 Canada
- 10.3 Europe
- 10.3.1 Germany
- 10.3.2 UK
- 10.3.3 France
- 10.3.4 Italy
- 10.3.5 Spain
- 10.3.6 Sweden
- 10.3.7 Netherlands
- 10.4 Asia Pacific
- 10.4.1 China
- 10.4.2 India
- 10.4.3 Japan
- 10.4.4 South Korea
- 10.4.5 Australia
- 10.4.6 Indonesia
- 10.5 Latin America
- 10.5.1 Brazil
- 10.5.2 Mexico
- 10.5.3 Argentina
- 10.6 Middle East and Africa
- 10.6.1 Saudi Arabia
- 10.6.2 UAE
- 10.6.3 South Africa
Chapter 11 Company Profiles
- 11.1 Global Players
- 11.1.1 Philips Electronics N.V
- 11.1.2 Dyson Ltd
- 11.1.3 SharkNinja
- 11.1.4 Samsung
- 11.1.5 Electrolux
- 11.1.6 LG Electronics Inc
- 11.1.7 Panasonic Corporation
- 11.1.8 BSH Home Appliances Group
- 11.2 Regional Players
- 11.2.1 Ecovacs
- 11.2.2 Roborock
- 11.2.3 Dreame Technology
- 11.2.4 Midea
- 11.2.5 Hoover
- 11.2.6 Miele
- 11.2.7 iRobot
- 11.3 Emerging Players & Innovators
- 11.3.1 Bissell
- 11.3.2 Rowenta
- 11.3.3 Vorwerk & Co. Interhold AG
- 11.3.4 Eureka
- 11.3.5 Black+Decker
- 11.3.6 Shojiki


