

 |
市場調查報告書
商品編碼
2071305
知識圖譜市場商業機會、成長要素、產業趨勢分析及2026-2035年預測。Knowledge Graph Market Opportunity, Growth Drivers, Industry Trend Analysis, and Forecast 2026 - 2035 |
||||||

全球知識圖譜市場預計到 2025 年將價值 15 億美元,預計到 2035 年將以 19.4% 的複合年成長率成長至 84 億美元。
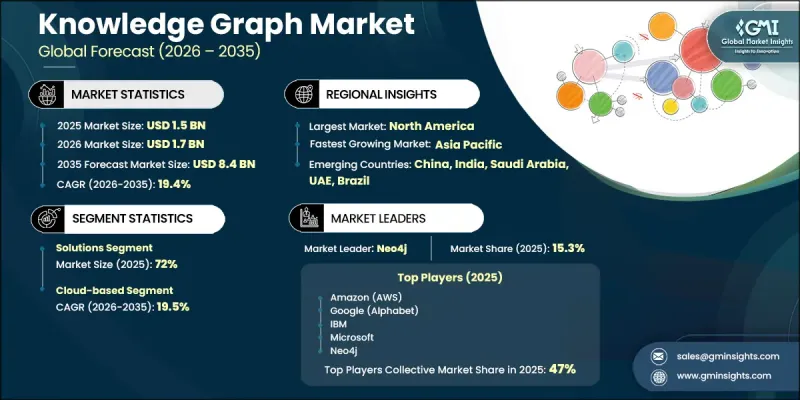
企業快速採用生成式人工智慧 (AI) 是推動市場擴張的主要因素,也顯著提升了對結構化、情境豐富的資料管理工具的需求。傳統的大規模語言模型往往受限於事實準確性、領域專業化和可解釋性等方面的挑戰,這加速了向知識圖譜驅動系統的轉變。塑造這一行業的關鍵發展之一是基於 GraphRAG 的架構的日益普及,將知識圖譜與大規模語言模型融合在一起。這些框架透過將基於向量的相似性搜尋與基於圖的遍歷相結合來提高推理準確性,使 AI 系統能夠解釋相互關聯的資料實體之間的關係,而不是孤立的輸入資料。推動這項轉變的企業的主要需求是需要大規模、透明、可審計和可解釋的 AI 輸出,尤其是在組織、監管和營運資料結構極其複雜的環境中。同時,來自數位互動、內部系統和連網設備的結構化和非結構化資料量正在迅速成長,這使得傳統的資料管理方法不足以映射關係並理解其含義。
| 市場範圍 | |
|---|---|
| 開始年份 | 2025 |
| 預測期 | 2026-2035 |
| 初始市場規模 | 15億美元 |
| 預測金額 | 84億美元 |
| 複合年成長率 | 19.4% |
預計到2025年,解決方案領域將佔據72%的市場佔有率,並在2035年之前以18.6%的複合年成長率成長。这一主導地位的驱动力源于企业对能够构建、链接和分析复杂且相互关联的数据集的平台日益增长的需求。企业正在广泛採用知识图谱解决方案,以增强语义搜尋、改进数据整合、支持商業智慧并提升人工智慧驱动的决策能力。 GraphRAG框架、企業人工智慧系統和語義資料基礎設施的日益普及進一步推動了市場需求。解決方案類別包括企業知識圖譜平台、圖資料資料庫、視覺化工具和進階圖分析系統,所有這些協同工作,共同支援可擴展的資料智慧營運。
預計到2025年,大型企業市佔率將達到73.2%,並在2035年之前以18.6%的複合年成長率成長。大型企業仍然是主要採用者,這得益於其複雜的數據生態系統以及在數位轉型和人工智慧技術方面的大量投資。这些公司正越来越多地採用知识图谱系统来整合数据源、增强企业搜尋能力、提升客户洞察并支持跨职能决策。大型企業對GraphRAG架構和其他先進人工智慧框架的採用尤其顯著,這主要是由於他們需要高度結構化、可擴展的知識管理系統來支援企業級智慧營運。
美國知識圖譜市場預計到2025年將達到5.265億美元,並在2035年之前以18.1%的複合年成長率成長。美國正透過對人工智慧、雲端運算和進階分析平台的大力投資,引領全球知識圖譜的應用。基於GraphRAG的系統將知識圖譜與大規模語言模型整合,並擴大用於提升企業人工智慧輸出的上下文理解能力、準確性和可解釋性。知識圖譜的應用範圍正在金融服務、醫療保健、零售和公共部門等機構中擴展,其應用包括智慧搜尋、詐欺偵測和企業知識管理。對數據驅動決策的日益依賴,以及持續的人工智慧創新和企業數位轉型,將繼續加速市場滲透。
目錄
第1章:調查方法
第2章執行摘要
第3章 行業洞察
- 產業生態系分析
- 供應商情況
- 利潤率
- 成本結構
- 每個階段增加的價值
- 影響價值鏈的因素
- 中斷
- 影響產業的因素
- 促進因素
- 企業人工智慧推動 GraphRAG 的普及應用
- 非結構化互聯資料的爆炸性成長
- 對可解釋人工智慧決策的需求
- 語意資料架構的擴展
- 產業潛在風險與挑戰
- 實施成本高且複雜
- 熟練的圖形專家短缺
- 市場機遇
- GraphRAG與企業級LLM的整合
- 中小企業知識獲取即服務 (KGaaS) 的成長
- 產業專用的知識圖譜解決方案
- 引入即時流知識圖譜
- 促進因素
- 成長潛力分析
- 技術與創新展望
- 最新科技趨勢
- 新興技術
- 成本細分分析
- 監理情勢
- 北美洲
- 美國國家標準與技術研究院(NIST)
- 人工智慧與數據法(加拿大)
- 歐洲
- 一般資料保護規則(德國)
- 義大利資料保護局(義大利)
- 亞太地區
- 個人資訊保護法(中國)
- 《數位個人資料保護法》(印度)
- 拉丁美洲
- 巴西通用資料保護法
- 國家數位戰略(墨西哥)
- 中東和非洲
- 阿拉伯聯合大公國個人資料保護法(杜拜)
- 個人資料保護法(沙烏地阿拉伯)
- 北美洲
- 波特的分析
- PESTLE分析
- 專利分析
- 人工智慧和生成式人工智慧對市場的影響
- 利用人工智慧改造現有經營模式
- 按細分市場分類的生成式人工智慧用例和部署藍圖
- 風險、限制和監管考量
- 永續性和環境方面
- 永續計劃
- 減少廢棄物策略
- 生產中的能源效率
- 具有環保意識的舉措
- 考慮碳足跡
- 預測假設和情境分析
- 基本案例:驅動複合年成長率的關鍵宏觀經濟與產業變量
- 樂觀情境:宏觀經濟與產業的順風
- 悲觀情景:宏觀經濟放緩或產業逆風
第4章 競爭情勢
- 介紹
- 企業市佔率分析
- 北美洲
- 歐洲
- 亞太地區
- LATAM
- 中東和非洲
- 主要市場公司的競爭分析
- 競爭定位矩陣
- 主要進展
- 併購
- 夥伴關係和聯盟
- 新產品發布
- 業務拓展計劃及資金籌措
- 4.6 按公司規模分類的基準
- 排名分類標準與遴選標準
- 按銷售額、地區和創新能力分類的層級定位矩陣。
第5章 市場估算與預測:依產品類型分類,2022-2035年
- 解決方案
- 企業知識圖譜平台
- 圖資料庫引擎
- 知識管理工具集
- 圖形視覺化和探索工具
- 圖表分析與查詢工具
- 服務
- 專業服務
- 託管服務
第6章 市場估價與預測:依車型分類,2022-2035年
- 標記屬性圖(LPG)
- RDF/三層存儲
- 基於本體/OWL
第7章 市場估算與預測:依部署模式分類,2022-2035年
- 基於雲端的
- 現場
- 混合
第8章 市場估計與預測:依應用領域分類,2022-2035年
- 語義搜尋和資訊搜尋
- 詐欺偵測和風險管理
- 建議統
- 數據分析和商業智慧
- 資料管治和主資料管理(MDM)
- 虛擬助理和問答系統
- 其他
第9章 市場估計與預測:依組織規模分類,2022-2035年
- 大公司
- 中小企業
第10章 市場估價與預測:依最終用途分類,2022-2035年
- BFSI
- 醫療保健和生命科學
- 政府/公共部門
- 資訊科技/通訊
- 媒體與娛樂
- 製造業
- 其他
第11章 市場估價與預測:按地區分類,2022-2035年
- 北美洲
- 美國
- 加拿大
- 歐洲
- 德國
- 英國
- 法國
- 義大利
- 西班牙
- 瑞典
- 瑞士
- 荷蘭
- 亞太地區
- 中國
- 印度
- 日本
- 韓國
- 澳洲
- 新加坡
- 馬來西亞
- 印尼
- 泰國
- LATAM
- 巴西
- 墨西哥
- 阿根廷
- 中東和非洲
- UAE
- 南非
- 沙烏地阿拉伯
第12章:公司簡介
- 世界公司
- Amazon Web Services(AWS)
- Google(Alphabet)
- IBM
- Microsoft
- Neo4j
- Ontotext
- Oracle
- Stardog
- TigerGraph
- 當地公司
- ArangoDB
- Baidu
- eccenca
- Graphwise
- Metaphacts
- SAP
- Tencent
- 新興企業
- Diffbot
- Fluree PBC
- Memgraph
- RelationalAI
The Global Knowledge Graph Market was valued at USD 1.5 billion in 2025 and is estimated to grow at a CAGR of 19.4% to reach USD 8.4 billion by 2035.
Market expansion is influenced by the rapid enterprise-wide adoption of generative AI, which has significantly increased demand for structured, context-rich data management tools. Conventional large language models are often limited by challenges related to factual accuracy, domain specialization, and explainability, which has accelerated the shift toward knowledge graph-enabled systems. A key development shaping the industry is the rising adoption of GraphRAG-based architectures that merge knowledge graphs with large language models. These frameworks enhance reasoning accuracy by combining vector-based similarity retrieval with graph-based traversal, allowing AI systems to interpret relationships across interconnected data entities rather than isolated inputs. The core enterprise requirement driving adoption is the need for transparent, auditable, and explainable AI outputs at scale, particularly in environments where organizational, regulatory, and operational data structures are highly complex. At the same time, organizations are generating rapidly expanding volumes of structured and unstructured data from digital interactions, internal systems, and connected devices, making traditional data management approaches insufficient for relationship mapping and semantic understanding.
| Market Scope | |
|---|---|
| Start Year | 2025 |
| Forecast Year | 2026-2035 |
| Start Value | $1.5 Billion |
| Forecast Value | $8.4 Billion |
| CAGR | 19.4% |
The solutions segment held a 72% share in 2025 and is expected to grow at a CAGR of 18.6% through 2035. This segment leads due to increasing enterprise demand for platforms that enable structuring, linking, and analyzing complex and interconnected datasets. Organizations are widely deploying knowledge graph solutions to enhance semantic search, improve data integration, support business intelligence, and strengthen AI-driven decision-making capabilities. Rising adoption of GraphRAG frameworks, enterprise AI systems, and semantic data infrastructures is further reinforcing demand. The solutions category includes enterprise knowledge graph platforms, graph databases, visualization tools, and advanced graph analytics systems that collectively support scalable data intelligence operations.
The large enterprises segment accounted for 73.2% share in 2025 and is projected to grow at a CAGR of 18.6% through 2035. Large organizations remain the primary adopters due to their complex data ecosystems and significant investments in digital transformation and artificial intelligence technologies. These enterprises are increasingly implementing knowledge graph systems to unify data sources, enhance enterprise search capabilities, improve customer insights, and support cross-functional decision-making. Adoption of GraphRAG architectures and other advanced AI frameworks is particularly strong among large firms, driven by the need for highly structured and scalable knowledge management systems that support enterprise-wide intelligence operations.
U.S. Knowledge Graph Market was valued at USD 526.5 million in 2025 and is projected to grow at a CAGR of 18.1% through 2035. The country leads global adoption due to strong investments in artificial intelligence, cloud computing, and advanced analytics platforms. Knowledge graphs integrated with large language models through GraphRAG-based systems are increasingly used to improve contextual understanding, accuracy, and explainability of enterprise AI outputs. Adoption is expanding across financial services, healthcare, retail, and public sector organizations, where applications include intelligent search, fraud detection, and enterprise knowledge management. Growing reliance on data-driven decision-making continues to accelerate market penetration, supported by ongoing AI innovation and enterprise digitalization efforts.
Major players operating in the global knowledge graph market include IBM, Microsoft, Amazon Web Services (AWS), Google (Alphabet), Oracle, SAP, Neo4j, Ontotext, Stardog, and TigerGraph. Companies in the knowledge graph market are strengthening their competitive positioning through continuous innovation in graph-based AI architectures that enhance semantic understanding and reasoning capabilities. They are increasingly integrating knowledge graph platforms with large language models to support advanced GraphRAG frameworks that improve factual accuracy and contextual intelligence. Cloud-native deployment strategies are being prioritized to enable scalable and flexible enterprise adoption across industries. Vendors are also investing in automation-driven data integration tools that simplify ingestion from diverse structured and unstructured sources. Strategic partnerships with AI developers and cloud service providers are expanding ecosystem reach and accelerating solution deployment. In addition, companies are focusing on enhancing interoperability with existing enterprise systems to reduce integration complexity.
Table of Contents
Chapter 1 Methodology
- 1.1 Research approach
- 1.2 Quality Commitments
- 1.2.1 GMI AI policy & data integrity commitment
- 1.2.1.1 Source consistency protocol
- 1.2.1 GMI AI policy & data integrity commitment
- 1.3 Research Trail & Confidence Scoring
- 1.3.1 Research Trail Components
- 1.3.2 Scoring Components
- 1.4 Data Collection
- 1.4.1 Partial list of primary sources
- 1.5 Data mining sources
- 1.5.1 Paid sources
- 1.5.1.1 Sources, by region
- 1.5.1 Paid sources
- 1.6 Base estimates and calculations
- 1.6.1 Base year calculation
- 1.7 Forecast model
- 1.7.1 Quantified market impact analysis
- 1.7.1.1 Mathematical impact of growth parameters on forecast
- 1.7.1 Quantified market impact analysis
- 1.8 Research transparency addendum
- 1.8.1 Source attribution framework
- 1.8.2 Quality assurance metrics
- 1.8.3 Our commitment to trust
Chapter 2 Executive Summary
- 2.1 Industry 360° synopsis
- 2.2 Key market trends
- 2.2.1 Regional
- 2.2.2 Offering
- 2.2.3 Model type
- 2.2.4 Deployment model
- 2.2.5 Application
- 2.2.6 Organization size
- 2.2.7 End use
- 2.3 TAM analysis, 2026-2035
- 2.4 CXO perspectives: Strategic imperatives
Chapter 3 Industry Insights
- 3.1 Industry ecosystem analysis
- 3.1.1 Supplier landscape
- 3.1.2 Profit margin
- 3.1.3 Cost structure
- 3.1.4 Value addition at each stage
- 3.1.5 Factor affecting the value chain
- 3.1.6 Disruptions
- 3.2 Industry impact forces
- 3.2.1 Growth drivers
- 3.2.1.1 Enterprise AI driving GraphRAG adoption
- 3.2.1.2 Rising unstructured interconnected data explosion
- 3.2.1.3 Need for explainable AI decisions
- 3.2.1.4 Expansion of semantic data architectures
- 3.2.2 Industry pitfalls and challenges
- 3.2.2.1 High implementation cost and complexity
- 3.2.2.2 Shortage of skilled graph professionals
- 3.2.3 Market opportunities
- 3.2.3.1 GraphRAG integration with enterprise LLMs
- 3.2.3.2 Growth of KGaaS for SMEs
- 3.2.3.3 Industry-specific knowledge graph solutions
- 3.2.3.4 Real-time streaming knowledge graphs adoption
- 3.2.1 Growth drivers
- 3.3 Growth potential analysis
- 3.4 Technology and innovation landscape
- 3.4.1 Current technological trends
- 3.4.2 Emerging technologies
- 3.5 Cost breakdown analysis
- 3.6 Regulatory landscape
- 3.6.1 North America
- 3.6.1.1 National Institute of Standards and Technology (U.S.)
- 3.6.1.2 Artificial Intelligence and Data Act (Canada)
- 3.6.2 Europe
- 3.6.2.1 General Data Protection Regulation (Germany)
- 3.6.2.2 Italian Data Protection Authority (Italy)
- 3.6.3 Asia Pacific
- 3.6.3.1 Personal Information Protection Law (China)
- 3.6.3.2 Digital Personal Data Protection Act (India)
- 3.6.4 Latin America
- 3.6.4.1 General Data Protection Law (Brazil)
- 3.6.4.2 National Digital Strategy (Mexico)
- 3.6.5 Middle East & Africa
- 3.6.5.1 UAE Personal Data Protection Law (Dubai)
- 3.6.5.2 Personal Data Protection Law (Saudi Arabia)
- 3.6.1 North America
- 3.7 Porter's analysis
- 3.8 PESTEL analysis
- 3.9 Patent analysis (Driven by primary research)
- 3.10 Impact of AI & Generative AI on the Market
- 3.10.1 AI-driven disruption of existing business models
- 3.10.2 Gen AI use cases & adoption roadmap by segment
- 3.10.3 Risks, limitations & regulatory considerations
- 3.11 Sustainability and environmental aspects
- 3.11.1 Sustainable practices
- 3.11.2 Waste reduction strategies
- 3.11.3 Energy efficiency in production
- 3.11.4 Eco-friendly initiatives
- 3.11.5 Carbon footprint considerations
- 3.12 Forecast assumptions & scenario analysis (Driven by primary research)
- 3.12.1 Base Case - key macro & industry variables driving CAGR
- 3.12.2 Optimistic Scenarios - Favorable macro and industry tailwinds
- 3.12.3 Pessimistic Scenario - Macroeconomic slowdown or industry headwinds
Chapter 4 Competitive Landscape, 2025
- 4.1 Introduction
- 4.2 Company market share analysis
- 4.2.1 North America
- 4.2.2 Europe
- 4.2.3 Asia Pacific
- 4.2.4 LATAM
- 4.2.5 MEA
- 4.3 Competitive analysis of major market players
- 4.4 Competitive positioning matrix
- 4.5 Key developments
- 4.5.1 Mergers & acquisitions
- 4.5.2 Partnerships & collaborations
- 4.5.3 New product launches
- 4.5.4 Expansion plans and funding
- 4.6 4.6 Company tier benchmarking
- 4.6.1 Tier classification criteria & qualifying thresholds
- 4.6.2 Tier positioning matrix by revenue, geography & innovation
Chapter 5 Market Estimates & Forecast, By Offering, 2022 - 2035 ($Mn)
- 5.1 Key trends
- 5.2 Solutions
- 5.2.1 Enterprise knowledge graph platforms
- 5.2.2 Graph database engines
- 5.2.3 Knowledge management toolsets
- 5.2.4 Graph visualization & exploration tools
- 5.2.5 Graph analytics & querying tools
- 5.3 Services
- 5.3.1 Professional services
- 5.3.2 Managed services
Chapter 6 Market Estimates & Forecast, By Model Type, 2022 - 2035 ($Mn)
- 6.1 Key trends
- 6.2 Labeled Property Graph (LPG)
- 6.3 RDF / Triple Store
- 6.4 Ontology-Based / OWL
Chapter 7 Market Estimates & Forecast, By Deployment Model, 2022 - 2035 ($Mn)
- 7.1 Key trends
- 7.2 Cloud-based
- 7.3 On-premises
- 7.4 Hybrid
Chapter 8 Market Estimates & Forecast, By Application, 2022 - 2035 ($Mn)
- 8.1 Key trends
- 8.2 Semantic search & information retrieval
- 8.3 Fraud detection & risk management
- 8.4 Recommendation systems
- 8.5 Data analytics & business intelligence
- 8.6 Data governance & master data management (MDM)
- 8.7 Virtual assistants & question answering systems
- 8.8 Others
Chapter 9 Market Estimates & Forecast, By Organization Size, 2022 - 2035 ($Mn)
- 9.1 Key trends
- 9.2 Large enterprises
- 9.3 Small & medium enterprises (SMEs)
Chapter 10 Market Estimates & Forecast, By End Use, 2022 - 2035 ($Mn)
- 10.1 Key trends
- 10.2 BFSI
- 10.3 Healthcare & Life Sciences
- 10.4 Government & public sector
- 10.5 IT & telecommunications
- 10.6 Media & entertainment
- 10.7 Manufacturing
- 10.8 Others
Chapter 11 Market Estimates & Forecast, By Region, 2022 - 2035 ($Mn)
- 11.1 Key trends
- 11.2 North America
- 11.2.1 U.S.
- 11.2.2 Canada
- 11.3 Europe
- 11.3.1 Germany
- 11.3.2 UK
- 11.3.3 France
- 11.3.4 Italy
- 11.3.5 Spain
- 11.3.6 Sweden
- 11.3.7 Switzerland
- 11.3.8 Netherlands
- 11.4 Asia Pacific
- 11.4.1 China
- 11.4.2 India
- 11.4.3 Japan
- 11.4.4 South Korea
- 11.4.5 Australia
- 11.4.6 Singapore
- 11.4.7 Malaysia
- 11.4.8 Indonesia
- 11.4.9 Thailand
- 11.5 LATAM
- 11.5.1 Brazil
- 11.5.2 Mexico
- 11.5.3 Argentina
- 11.6 MEA
- 11.6.1 UAE
- 11.6.2 South Africa
- 11.6.3 Saudi Arabia
Chapter 12 Company Profiles
- 12.1 Global players
- 12.1.1 Amazon Web Services (AWS)
- 12.1.2 Google (Alphabet)
- 12.1.3 IBM
- 12.1.4 Microsoft
- 12.1.5 Neo4j
- 12.1.6 Ontotext
- 12.1.7 Oracle
- 12.1.8 Stardog
- 12.1.9 TigerGraph
- 12.2 Regional players
- 12.2.1 ArangoDB
- 12.2.2 Baidu
- 12.2.3 eccenca
- 12.2.4 Graphwise
- 12.2.5 Metaphacts
- 12.2.6 SAP
- 12.2.7 Tencent
- 12.3 Emerging players
- 12.3.1 Diffbot
- 12.3.2 Fluree PBC
- 12.3.3 Memgraph
- 12.3.4 RelationalAI

 知識圖譜市場預測至2034年-按組件、部署模式、圖類型、應用、最終用戶和地區分類的全球分析
 2026-2030年全球工業知識圖譜市場
 全球知識圖譜市場(至 2032 年):按解決方案(企業知識圖譜平台、圖資料庫引擎、知識管理工具集)和模型類型(RDF、三元組儲存、標記屬性圖)分類
 2026年知識圖譜全球市場報告
 知識圖譜市場:2026-2032年全球市場預測(以交付方式、技術、資料類型、部署方式、組織規模、應用程式和產業分類)
 知識圖譜市場分析及預測(至 2035 年):按類型、產品、服務、技術、組件、應用、部署、最終用戶和解決方案分類
 全球知識圖譜市場