


 |
市場調查報告書
商品編碼
2071303
飲料包裝器材市場商機、成長要素、產業趨勢分析及2026-2035年預測。Beverage Packaging Machine Market Opportunity, Growth Drivers, Industry Trend Analysis, and Forecast 2026 - 2035 |
||||||

全球飲料包裝器材市場預計到 2025 年將價值 184 億美元,並將以 5.4% 的複合年成長率成長,到 2035 年達到 312 億美元。
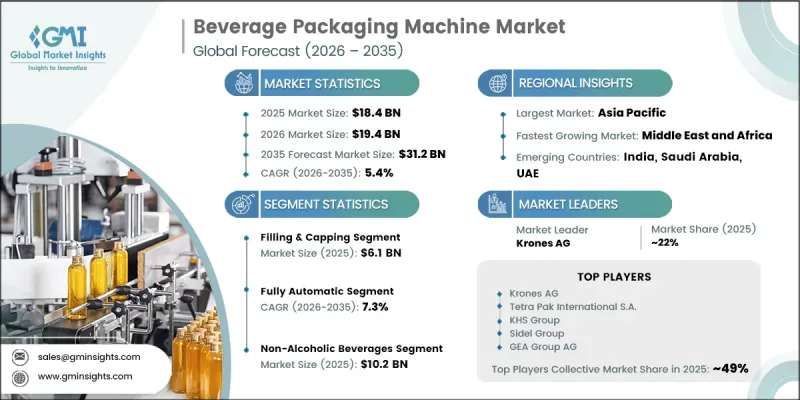
全球包裝飲料消費量的成長以及向自動化、高效生產系統的轉變,是推動市場成長的主要因素。飲料製造商正穩步採用先進的包裝機械,以提高營運效率、降低人事費用和維護成本,並確保即使在大規模生產環境下也能確保產品品質的穩定性。瓶裝水、碳酸飲料、果汁、乳類飲料以及即飲飲料等非酒精飲料的產量成長,進一步加速了全球對包裝設備的需求。此外,高速灌裝、貼標、輸送和碼垛系統的普及也提高了生產線的效率。對永續性關注促使製造商投資於節能減排的包裝技術。同時,自動化、機器人和數位控制系統的整合正在推動飲料生產設施的現代化,提高生產精度和加工能力。總而言之,隨著全球飲料製造企業對擴充性、高效且技術主導的包裝解決方案的需求不斷成長,市場正在快速發展。
| 市場範圍 | |
|---|---|
| 開始年份 | 2025 |
| 預測期 | 2026-2035 |
| 上市時的市場規模 | 184億美元 |
| 預測金額 | 312億美元 |
| 複合年成長率 | 5.4% |
預計到2025年,灌裝和封蓋產業的市場規模將達到61億美元,並在2035年之前以4.9%的複合年成長率成長。該行業之所以能保持領先地位,是因為它在確保整個飲料生產線上實現精準填充、衛生操作和一致的包裝性能方面發揮著主導的作用。此外,它也被廣泛應用於對速度和產品品質要求大規模生產環境。對自動化、大批量填充系統的強勁需求持續推動全球飲料加工廠對這些系統的採用。
預計到2025年,全自動化包裝市佔率將達到63.2%,並在2026年至2035年間以7.3%的複合年成長率成長。該細分市場的主導地位主要得益於工業自動化的持續發展以及對能夠最大限度減少人工干預的高速包裝系統日益成長的需求。製造商青睞全自動化解決方案,因為它們能夠提供穩定的產量、更高的柔軟性和更有效率的生產。機器人技術、基於物聯網的監控系統以及預測性維護技術的整合進一步推動了市場需求。大規模飲料生產設施的擴張也顯著促進了該細分市場的成長。
預計到2025年,中國飲料包裝器材市場規模將達到29億美元,並在2035年之前以5.6%的複合年成長率成長。中國市場領先地位的驅動力在於其龐大的飲料生產能力、不斷成長的包裝飲料消費量以及加工設施工業自動化技術的快速發展。多種飲料品類的活躍生產持續推動先進包裝機械的需求。製造商正積極投資高性能灌裝、貼標和輸送系統,以提高營運效率,並滿足國內消費和出口導向生產的需求。
目錄
第1章:調查方法和範圍
第2章執行摘要
第3章 行業洞察
- 產業生態系分析
- 供應商情況
- 利潤率
- 每個階段增加的價值
- 影響價值鏈的因素
- 影響產業的因素
- 促進因素
- 全球包裝飲料消費量成長
- 飲料製造工廠自動化技術的進步
- 人們越來越關注永續包裝和高效的生產流程。
- 潛在風險和挑戰
- 與先進包裝設備相關的大量資本投資
- 原料和包裝材料成本的波動
- 機會
- 智慧包裝領域對自動化和機器人技術整合的需求日益成長。
- 新興國家飲料製造業的擴張
- 促進因素
- 成長潛力分析
- 未來市場趨勢
- 技術與創新展望
- 最新科技趨勢
- 新興技術
- 監理情勢
- 標準和合規要求
- 區域監理框架
- 認證標準
- 波特的分析
- PESTLE分析
- 價格分析
- 依模型分析歷史價格趨勢(2019-2024)
- 依球員類型分類的定價策略(高級球員、超值球員、成本加成球員)
- 按最終用戶群體(大型製造商與手工藝生產商)分類的價格敏感度
- 貿易數據分析
- 按機械類型分類的進出口量和進口額趨勢
- 主要貿易路線及關稅影響(中歐、美拉、亞洲內部)
- 貿易政策轉變與反傾銷措施對整車製造商出口的影響
- 人工智慧和生成式人工智慧對市場的影響
- 利用人工智慧改造現有經營模式(預測性維護、生產線最佳化)
- 按設備細分市場分類的生成式人工智慧用例和部署藍圖
- 利用數位雙胞胎和人工智慧最佳化流程切換。
- 人工智慧在食品加工機械中的風險、限制與監管考量
- 生產能力和生產情況
- 設備產能:按地區和主要生產商分類
- 運轉率和擴張計劃
第4章 競爭情勢
- 介紹
- 企業市佔率分析
- 按地區
- 企業矩陣分析
- 主要市場公司的競爭分析
- 競爭定位矩陣
- 主要進展
- 併購
- 夥伴關係和聯盟
- 新產品發布
- 業務拓展計劃
第5章 市場估算與預測:依產品類型分類,2022-2035年
- 灌裝封蓋機
- 標籤和編碼機
- 碼垛和拆垛設備
- 輸送和搬運設備
- 清潔和消毒設備
- 包裝/裝訂機
- 其他
第6章 市場估算與預測:依自動化程度分類,2022-2035年
- 手動的
- 半自動
- 全自動
第7章 市場估價與預測:依飲料類型分類,2022-2035年
- 酒精飲料
- 不含酒精的飲料
- 乳類飲料
第8章 市場估價與預測:依包裝類型分類,2022-2035年
- 瓶子
- 坎
- 紙盒
- 包裝袋和軟包裝
- 其他
第9章 市場估價與預測:依包裝材料分類,2022-2035年
- 玻璃
- 金屬
- 紙板
- 塑膠
- 其他
第10章 市場估價與預測:依通路分類,2022-2035年
- 直銷
- 間接銷售
第11章 市場估價與預測:按地區分類,2022-2035年
- 北美洲
- 美國
- 加拿大
- 歐洲
- 德國
- 英國
- 法國
- 義大利
- 西班牙
- 亞太地區
- 中國
- 印度
- 日本
- 韓國
- 澳洲
- 拉丁美洲
- 巴西
- 墨西哥
- 阿根廷
- 中東和非洲
- 沙烏地阿拉伯
- UAE
- 南非
第12章:公司簡介
- 世界頂尖公司
- Krones AG
- Tetra Pak International SA
- Sidel Group
- GEA Group AG
- KHS Group
- Coesia SpA
- 巴里·韋米勒公司
- 該地區的領先企業
- ProMach
- IMA Group(Industria Macchine Automatiche)
- Serac Group
- Syntegon Technology GmbH
- SMI SpA(SMIGROUP)
- Newamstar Packaging Machinery Co., Ltd.
- CFT Group SpA
- 新興企業和專業公司
- Douglas Machine Inc.
- EconoCorp Inc.
- Cama Group Srl
- Accutek Packaging Equipment Companies
- IC Filling Systems Ltd.
- Combi Packaging Systems LLC
- Massman Automation Designs LLC
The Global Beverage Packaging Machine Market was valued at USD 18.4 billion in 2025 and is estimated to grow at a CAGR of 5.4% to reach USD 31.2 billion by 2035.
Growth in this market is driven by rising global consumption of packaged beverages and the increasing shift toward automated and high-efficiency production systems. Beverage manufacturers are steadily adopting advanced packaging machinery to enhance operational productivity, reduce labor and maintenance costs, and ensure consistent product quality across large-scale production environments. Expansion in the production of non-alcoholic beverages such as bottled water, carbonated soft drinks, juices, dairy-based drinks, and ready-to-drink formats is further accelerating demand for packaging equipment worldwide. The industry is also witnessing strong adoption of high-speed systems used for filling, labeling, conveying, and palletizing, which are improving production line efficiency. Sustainability concerns are encouraging manufacturers to invest in energy-efficient and waste-reducing packaging technologies. In parallel, the integration of automation, robotics, and digital control systems is modernizing beverage production facilities and improving accuracy and throughput. Overall, the market is evolving rapidly due to increasing demand for scalable, efficient, and technology-driven packaging solutions across global beverage manufacturing operations.
| Market Scope | |
|---|---|
| Start Year | 2025 |
| Forecast Year | 2026-2035 |
| Start Value | $18.4 Billion |
| Forecast Value | $31.2 Billion |
| CAGR | 5.4% |
The filling and capping segment generated USD 6.1 billion in 2025 and is projected to grow at a CAGR of 4.9% through 2035. This segment maintains its leadership due to its critical role in ensuring precise filling operations, hygienic handling, and consistent packaging performance across beverage production lines. It is widely utilized in large-scale manufacturing environments where operational speed and product integrity are essential. Strong demand for automated high-capacity filling systems continues to reinforce its widespread adoption across global beverage processing facilities.
The fully automatic segment accounted for 63.2% share in 2025 and is anticipated to grow at a CAGR of 7.3% during 2026-2035. This segment leads due to the growing shift toward industrial automation and the need for high-speed packaging systems that minimize manual intervention. Manufacturers prefer fully automated solutions for their ability to deliver consistent output, improved flexibility, and enhanced production efficiency. The integration of robotics, IoT-based monitoring systems, and predictive maintenance technologies is further strengthening demand. Expansion of large-scale beverage production facilities is also contributing significantly to segment growth.
China Beverage Packaging Machine Market captured USD 2.9 billion in 2025, and is expected to grow at a CAGR of 5.6% through 2035. The country's dominance is supported by extensive beverage manufacturing capacity, increasing consumption of packaged drinks, and rapid industrial automation across processing facilities. Strong production activity across multiple beverage categories continues to drive demand for advanced packaging machinery. Manufacturers are actively investing in high-performance filling, labeling, and conveying systems to improve operational efficiency and support both domestic consumption and export-oriented production requirements.
Major companies operating in the Global Beverage Packaging Machine Market include Krones AG, Tetra Pak International S.A., Sidel Group, KHS Group, GEA Group AG, Coesia S.p.A., Barry-Wehmiller Companies, Syntegon Technology GmbH, Serac Group, IMA Group (Industria Macchine Automatiche), ProMach, CFT Group S.p.A., SMI S.p.A. (SMIGROUP), Newamstar Packaging Machinery Co., Ltd., Douglas Machine Inc., EconoCorp Inc., Cama Group S.r.l., Accutek Packaging Equipment Companies, IC Filling Systems Ltd., Combi Packaging Systems LLC, and Massman Automation Designs LLC. Companies in the beverage packaging machine market are strengthening their market position through a combination of technology advancement, operational efficiency improvements, and global expansion strategies. A primary focus is placed on developing highly automated and intelligent packaging systems that integrate robotics, IoT-enabled monitoring, and predictive maintenance capabilities. Manufacturers are also investing in energy-efficient and sustainable machinery designs to align with evolving environmental standards and reduce production waste. Strategic partnerships with beverage producers are helping companies expand their customer base and improve service responsiveness. Continuous product innovation aimed at enhancing speed, precision, and flexibility in packaging operations remains a key priority.
Table of Contents
Chapter 1 Methodology & Scope
- 1.1 Market scope and definition
- 1.2 Research design
- 1.2.1 Research approach
- 1.2.2 Data collection methods
- 1.3 Data mining sources
- 1.3.1 Global
- 1.3.2 Regional/Country
- 1.4 Base estimates and calculations
- 1.4.1 Base year calculation
- 1.4.2 Key trends for market estimation
- 1.5 Primary research and validation
- 1.5.1 Primary sources
- 1.6 Forecast model
- 1.7 Research assumptions and limitations
Chapter 2 Executive Summary
- 2.1 Industry 360° synopsis
- 2.2 Key market trends
- 2.2.1 Regional
- 2.2.2 Product type
- 2.2.3 Automation level
- 2.2.4 Beverage type
- 2.2.5 Packaging format
- 2.2.6 Packaging material
- 2.2.7 Distribution channel
Chapter 3 Industry Insights
- 3.1 Industry ecosystem analysis
- 3.1.1 Supplier landscape
- 3.1.2 Profit margin
- 3.1.3 Value addition at each stage
- 3.1.4 Factor affecting the value chain
- 3.2 Industry impact forces
- 3.2.1 Growth drivers
- 3.2.1.1 Rising consumption of packaged beverages globally
- 3.2.1.2 Growing automation across beverage manufacturing facilities
- 3.2.1.3 Increasing focus on sustainable packaging and efficient production processes
- 3.2.2 Pitfalls & Challenges
- 3.2.2.1 High capital investment associated with advanced packaging machinery
- 3.2.2.2 Fluctuating raw material and packaging material costs
- 3.2.3 Opportunities
- 3.2.3.1 Rising demand for smart packaging automation and robotics integration
- 3.2.3.2 Expansion of beverage manufacturing in emerging economies
- 3.2.1 Growth drivers
- 3.3 Growth potential analysis
- 3.4 Future market trends
- 3.5 Technology and innovation landscape
- 3.5.1 Current technological trends
- 3.5.2 Emerging technologies
- 3.6 Regulatory landscape
- 3.6.1 Standards and compliance requirements
- 3.6.2 Regional regulatory frameworks
- 3.6.3 Certification standards
- 3.7 Porter's analysis
- 3.8 PESTEL analysis
- 3.9 Pricing analysis (driven by primary research)
- 3.9.1 Historical price trend analysis by machine type (2019-2024) (driven by primary research)
- 3.9.2 Pricing strategy by player type (premium / value / cost-plus) (driven by primary research)
- 3.9.3 Price sensitivity by end-user segment (large manufacturers vs. craft producers) (driven by primary research)
- 3.10 Trade data analysis (driven by paid database)
- 3.10.1 Import/export volume & value trends by machine type (HS code 8422) (driven by paid database)
- 3.10.2 Key trade corridors & tariff impact (China-EU, US-LATAM, intra-Asia) (driven by paid database)
- 3.10.3 Trade policy shifts & anti-dumping measures affecting OEM exports (driven by paid database)
- 3.11 Impact of AI & generative AI on the market
- 3.11.1 AI-driven disruption of existing business models (predictive maintenance, line optimization)
- 3.11.2 GenAI use cases & adoption roadmap by machine segment
- 3.11.3 Digital twins & AI-powered changeover optimization
- 3.11.4 Risks, limitations & regulatory considerations for AI in food-grade machinery
- 3.12 Capacity & production landscape (driven by primary research)
- 3.12.1 Installed capacity by region & key producer (driven by primary research)
- 3.12.2 Capacity utilization rates & expansion pipelines (driven by primary research)
Chapter 4 Competitive Landscape, 2025
- 4.1 Introduction
- 4.2 Company market share analysis
- 4.2.1 By Region
- 4.2.1.1 North America
- 4.2.1.2 Europe
- 4.2.1.3 Asia Pacific
- 4.2.1.4 Latin America
- 4.2.1.5 Middle East & Africa
- 4.2.1 By Region
- 4.3 Company matrix analysis
- 4.4 Competitive analysis of major market players
- 4.5 Competitive positioning matrix
- 4.6 Key developments
- 4.6.1 Mergers & acquisitions
- 4.6.2 Partnerships & collaborations
- 4.6.3 New product launches
- 4.6.4 Expansion plans
Chapter 5 Market Estimates & Forecast, By Product Type, 2022 - 2035, (USD Billion) (Thousand Units)
- 5.1 Key trends
- 5.2 Filling and capping machine
- 5.3 Labeling and coding machine
- 5.4 Palletizing and depalletizing machine
- 5.5 Conveying and handling machine
- 5.6 Cleaning and sterilizing machine
- 5.7 Wrapping and bundling machine
- 5.8 Others
Chapter 6 Market Estimates & Forecast, By Automation Level, 2022 - 2035, (USD Billion) (Thousand Units)
- 6.1 Key trends
- 6.2 Manual
- 6.3 Semi-automatic
- 6.4 Fully automatic
Chapter 7 Market Estimates & Forecast, By Beverage Type, 2022 - 2035, (USD Billion) (Thousand Units)
- 7.1 Key trends
- 7.2 Alcoholic beverages
- 7.3 Non-alcoholic beverages
- 7.4 Dairy beverages
Chapter 8 Market Estimates & Forecast, By Packaging Format, 2022 - 2035, (USD Billion) (Thousand Units)
- 8.1 Key trends
- 8.2 Bottles
- 8.3 Cans
- 8.4 Cartons
- 8.5 Pouches & flexible formats
- 8.6 Others
Chapter 9 Market Estimates & Forecast, By Packaging Material, 2022 - 2035, (USD Billion) (Thousand Units)
- 9.1 Key trends
- 9.2 Glass
- 9.3 Metal
- 9.4 Paperboard
- 9.5 Plastic
- 9.6 Others
Chapter 10 Market Estimates & Forecast, By Distribution Channel, 2022 - 2035, (USD Billion) (Thousand Units)
- 10.1 Key trends
- 10.2 Direct sales
- 10.3 Indirect sales
Chapter 11 Market Estimates & Forecast, By Region, 2022 - 2035, (USD Billion) (Thousand Units)
- 11.1 Key trends
- 11.2 North America
- 11.2.1 U.S.
- 11.2.2 Canada
- 11.3 Europe
- 11.3.1 Germany
- 11.3.2 UK
- 11.3.3 France
- 11.3.4 Italy
- 11.3.5 Spain
- 11.4 Asia Pacific
- 11.4.1 China
- 11.4.2 India
- 11.4.3 Japan
- 11.4.4 South Korea
- 11.4.5 Australia
- 11.5 Latin America
- 11.5.1 Brazil
- 11.5.2 Mexico
- 11.5.3 Argentina
- 11.6 MEA
- 11.6.1 Saudi Arabia
- 11.6.2 UAE
- 11.6.3 South Africa
Chapter 12 Company Profiles
- 12.1 Top Global Players
- 12.1.1 Krones AG
- 12.1.2 Tetra Pak International S.A.
- 12.1.3 Sidel Group
- 12.1.4 GEA Group AG
- 12.1.5 KHS Group
- 12.1.6 Coesia S.p.A.
- 12.1.7 Barry-Wehmiller Companies
- 12.2 Regional Champions
- 12.2.1 ProMach
- 12.2.2 IMA Group (Industria Macchine Automatiche)
- 12.2.3 Serac Group
- 12.2.4 Syntegon Technology GmbH
- 12.2.5 SMI S.p.A. (SMIGROUP)
- 12.2.6 Newamstar Packaging Machinery Co., Ltd.
- 12.2.7 CFT Group S.p.A.
- 12.3 Emerging & Specialized Players
- 12.3.1 Douglas Machine Inc.
- 12.3.2 EconoCorp Inc.
- 12.3.3 Cama Group S.r.l.
- 12.3.4 Accutek Packaging Equipment Companies
- 12.3.5 IC Filling Systems Ltd.
- 12.3.6 Combi Packaging Systems LLC
- 12.3.7 Massman Automation Designs LLC

 飲料包裝市場預測至2034年-按材料、包裝類型、飲料類型、技術和地區分類的全球分析
 非酒精飲料包裝市場規模、佔有率和成長分析:按包裝類型、材料類型、飲料類型、應用、最終用戶、分銷管道和地區分類-2026-2033年產業預測
 飲料包裝市場:2026-2032年全球市場預測(依飲料類型、材料類型、包裝形式、營運模式、包裝功能及通路分類)
 全球飲料容器市場規模、佔有率、趨勢和成長分析報告(2026-2034)2034年環保飲料包裝市場預測-按產品類型、材料類型、包裝形式、飲料類型、最終用戶、通路和地區分類的全球分析
 飲料包裝市場報告:按材料、產品、應用和地區分類(2026-2034年)
 飲料容器市場規模、佔有率和趨勢分析報告:按材料、容器類型、最終用途、地區和細分市場預測(2026-2033 年)全球飲料包裝市場規模、佔有率、趨勢和成長分析報告(2026-2034年)
 飲料包裝市場:按產品類型、應用和地區分類
 2026年全球飲料包裝市場報告