

 |
市場調查報告書
商品編碼
2071246
煤灰利用及處置市場機會、成長要素、產業趨勢分析及2026-2035年預測。Coal Ash Utilization and Disposal Market Opportunity, Growth Drivers, Industry Trend Analysis, and Forecast 2026 - 2035 |
||||||
預計到 2025 年,全球煤灰有效利用和處置市場價值將達到 149 億美元,並預計以 6.5% 的複合年成長率成長,到 2035 年達到 284 億美元。
煤灰利用和處置產業的成長是由基礎設施建設、以永續性為重點的資源管理措施以及日益增加的環境修復活動共同推動的。建築業對煤灰的需求依然強勁,煤灰作為一種被廣泛接受的水泥基填料,既能提高成本效益,又能滿足永續性。促進負責任的煤灰處理和處置實踐的法律規範進一步加速了市場擴張。快速發展地區建設活動的活性化持續增強了對煤灰衍生材料的需求,同時製造商也擴大將水泥基填料納入其長期脫碳策略。從經濟角度來看,煤灰在多種工業應用中比傳統替代品具有顯著的成本優勢。在水泥生產中,飛灰是一種價格具有競爭力的傳統水泥基原料替代品,同時也能維持混合配方中的性能標準。此外,政府資助的基礎建設項目中擴大使用飛灰增強型建築材料和煤灰衍生回填料,這為全球煤灰利用和處置市場創造了更多成長機會。
| 市場範圍 | |
|---|---|
| 開始年份 | 2025 |
| 預測期 | 2026-2035 |
| 上市時的市場規模 | 149億美元 |
| 預計金額 | 284億美元 |
| 複合年成長率 | 6.5% |
按材料類型分類,預計到2025年,飛灰市場佔有率將達到53.9%,並在2035年之前以7%的複合年成長率成長。其強大的市場地位得益於其卓越的性能、穩定的供應鏈以及在各種工業應用領域的廣泛認可。飛灰之所以被廣泛應用,是因為它既能改善材料性能,又能支援高效率的生產流程。穩定的品質和大規模的供應持續提升了其商業性吸引力,從而促進了已開發市場和新興市場對粉煤灰的持續需求。這種材料仍然是眾多建築和基礎設施應用中不可或缺的組成部分,進一步鞏固了其在行業中的主導地位。
2025年,水泥和混凝土應用領域的市場規模將達到48億美元,佔市場佔有率的32.2%。預計到2035年,該領域將以7.3%的複合年成長率成長。需求成長的驅動力在於,人們越來越重視在維持建築材料生產經濟效益的同時減少碳排放。將飛灰摻入水泥和混凝土混合料中,可以幫助製造商減少對傳統水泥成分的依賴,同時保持所需的性能。隨著永續性目標在建設產業中日益重要,使用煤灰衍生材料預計將繼續成為平衡環境目標與營運成本控制的關鍵策略。
預計到2025年,北美煤灰利用和處置市場佔有率將達到43.2%。該地區市場成長的驅動力主要來自煤灰儲存、監測和處置相關法規的製定。場地管理、地下水監測和封場作業等方面的合規要求不斷更新,為專注於煤灰處理、修復、工程和處置解決方案的服務供應商創造了巨大的商機。隨著電力營運商持續推動合規措施,對專業管理服務和大規模修復項目的需求預計將繼續成為推動區域市場擴張的關鍵因素。
目錄
第1章:調查方法和範圍
第2章執行摘要
第3章 行業洞察
- 產業生態系分析
- 原物料供應及採購分析
- 生產能力評估
- 供應鏈韌性與風險因素
- 配電網路分析
- 影響產業的因素
- 促進因素
- 產業潛在風險與挑戰
- 監理情勢
- 成長潛力分析
- 波特的分析
- PESTLE分析
- 煤灰有效利用與處置的成本結構分析
- 新機會和趨勢
- 未開發市場和應用領域的成長
- 投資分析及未來展望
- 生產能力和生產情況
- 各地區及主要生產商的產能
- 運轉率和擴張計劃
- 人工智慧和生成式人工智慧對市場的影響
- 利用人工智慧最佳化生產
- 預測性維護和故障檢測
第4章 競爭情勢
- 介紹
- 企業市佔率分析:按地區分類
- 北美洲
- 歐洲
- 亞太地區
- 中東和非洲
- 拉丁美洲
- 主要市場公司的競爭分析
- 競爭定位矩陣
- 主要進展
- 併購
- 夥伴關係和聯盟
- 新產品發布
- 業務拓展計劃及資金籌措
- 按公司規模進行基準測試
- 排名分類標準與遴選標準
- 按銷售額、地區和創新能力分類的層級定位矩陣。
第5章 市場規模及預測:依灰燼類型分類,2022-2035年
- 飛灰
- 底灰
- 鍋爐渣
- 脫硫石膏
- FBC 灰
- 其他
第6章 市場規模及預測:依方法論分類,2022-2035年
- 使用狀態
- 丟棄
第7章 市場規模及預測:依應用領域分類,2022-2035年
- 水泥和混凝土
- 磚塊
- 道路建設和基礎設施
- 牆板及石膏製品
- 礦山修復
- 農業
- 廢棄物穩定化處理
- 其他
第8章 市場規模及預測:依服務類型分類,2022-2035年
- 收集和處理
- 運輸/物流
- 礦物選礦/加工
- 廢棄物處理和掩埋管理
- 池塘關閉和修復
第9章 市場規模及預測:依地區分類,2022-2035年
- 北美洲
- 美國
- 加拿大
- 墨西哥
- 歐洲
- 德國
- 英國
- 義大利
- 法國
- 波蘭
- 捷克共和國
- 土耳其
- 亞太地區
- 中國
- 印度
- 日本
- 澳洲
- 韓國
- 印尼
- 馬來西亞
- 越南
- 中東和非洲
- 沙烏地阿拉伯
- UAE
- 摩洛哥
- 南非
- 埃及
- 拉丁美洲
- 巴西
- 智利
- 阿根廷
- 哥倫比亞
第10章:公司簡介
- ASH GROVE
- Ashtech India
- Burns &McDonnell
- Casila Infracon
- CEMEX
- Charah Solutions
- Clean Harbors
- DTE Energy
- Eco Material Technologies
- Enviri Corporation
- GEOCYCLE
- Heidelberg Materials
- ICM Marshall
- JAYCEE BUILDCORP LLP
- REFEX
- RPM Solutions
- Salt River Materials Group
- Titan America
- 威立雅北美公司
- WM Intellectual Property Holdings
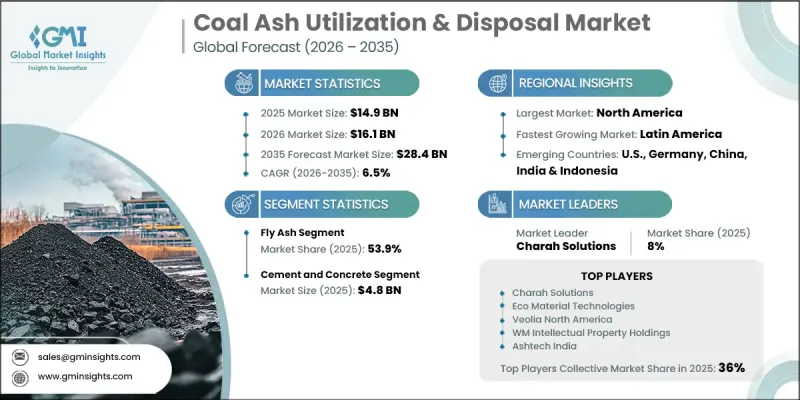
The Global Coal Ash Utilization and Disposal Market was valued at USD 14.9 billion in 2025 and is estimated to grow at a CAGR of 6.5% to reach USD 28.4 billion by 2035.
Growth in the coal ash utilization and disposal industry is driven by the combined influence of infrastructure development, sustainability-focused resource management initiatives, and increasing environmental remediation activities. Demand remains strong across the construction sector, where coal ash serves as a widely accepted supplementary cementitious material that supports both cost efficiency and sustainability objectives. Regulatory frameworks promoting responsible ash handling and disposal practices are further accelerating market expansion. Growing construction activity in rapidly developing regions continues to strengthen demand for coal ash-derived materials, while manufacturers are increasingly incorporating supplementary cementitious materials into long-term decarbonization strategies. From an economic perspective, coal ash offers significant cost advantages compared to conventional raw material alternatives in several industrial applications. Within cement production, fly ash provides a competitively priced substitute for traditional cementitious inputs while maintaining performance standards in blended formulations. In addition, government-funded infrastructure development projects are increasing the use of fly ash-enhanced construction materials and ash-derived fill products, creating additional growth opportunities across the global coal ash utilization and disposal market.
| Market Scope | |
|---|---|
| Start Year | 2025 |
| Forecast Year | 2026-2035 |
| Start Value | $14.9 Billion |
| Forecast Value | $28.4 Billion |
| CAGR | 6.5% |
Among material types, the fly ash segment held a 53.9% share in 2025 and is anticipated to grow at a CAGR of 7% through 2035. Its strong market presence is supported by favorable performance characteristics, reliable supply availability, and broad acceptance across multiple industrial applications. Fly ash is widely utilized due to its ability to enhance material properties while supporting efficient production processes. Consistent quality and large-scale availability continue to reinforce its commercial attractiveness, contributing to sustained demand across developed and emerging markets alike. The material remains a critical component in a wide range of construction and infrastructure-related applications, further strengthening its leadership position within the industry.
The cement and concrete application segment generated USD 4.8 billion in 2025, representing 32.2% share. The segment is forecast to grow at a CAGR of 7.3% through 2035. Demand growth is being fueled by increasing emphasis on reducing carbon emissions while maintaining economic efficiency in construction material production. The incorporation of fly ash into cement and concrete formulations enables manufacturers to reduce reliance on conventional cement components while preserving required performance characteristics. As sustainability targets become increasingly important across the construction sector, the use of coal ash-derived materials is expected to remain a key strategy for balancing environmental objectives with operational cost management.
North America Coal Ash Utilization and Disposal Market held 43.2% share in 2025. Market growth across the region is supported by evolving environmental regulations governing ash storage, monitoring, and disposal practices. Updated compliance requirements related to site management, groundwater oversight, and closure activities are creating substantial opportunities for service providers specializing in ash handling, remediation, engineering, and disposal solutions. As utility operators continue implementing regulatory compliance measures, demand for professional management services and large-scale remediation projects is expected to remain a significant driver of regional market expansion.
Key participants operating in the global coal ash utilization and disposal market include ASH GROVE, Ashtech India, Burns & McDonnell, Casila Infracon, CEMEX, Charah Solutions, Clean Harbors, DTE Energy, Eco Material Technologies, Enviro Corporation, GEOCYCLE, Heidelberg Materials, ICM Marshall, JAYCEE BUILDCORP LLP, REFEX, RPM Solutions, Salt River Materials Group, Titan America, Veolia North America, and WM Intellectual Property Holdings. Companies competing in the coal ash utilization and disposal industry are adopting a range of strategic initiatives to strengthen their market presence and improve competitive positioning. Market participants are expanding processing and recycling capabilities to maximize the commercial value of coal ash-derived products while meeting evolving environmental standards. Investments in advanced beneficiation technologies, material recovery systems, and sustainable disposal solutions are helping companies enhance operational efficiency and product quality. Strategic collaborations with utilities, construction material manufacturers, and infrastructure developers are also enabling firms to secure long-term supply agreements and expand customer reach.
Table of Contents
Chapter 1 Methodology & Scope
- 1.1 Research approach
- 1.2 Quality commitments
- 1.2.1 GMI AI policy & data integrity commitment
- 1.2.1.1 Source consistency protocol
- 1.2.1 GMI AI policy & data integrity commitment
- 1.3 Research trail & confidence scoring
- 1.3.1 Research trail components
- 1.3.2 Scoring components
- 1.4 Data collection
- 1.4.1 Partial list of primary sources
- 1.5 Data mining sources
- 1.5.1 Paid sources
- 1.5.1.1 Sources, by region
- 1.5.1 Paid sources
- 1.6 Base estimates and calculations
- 1.6.1 Base year calculation for any one approach
- 1.7 Market estimates & forecasts parameters
- 1.8 Forecast model
- 1.8.1 Quantified market impact analysis
- 1.8.1.1 Mathematical impact of growth parameters on forecast
- 1.8.1 Quantified market impact analysis
- 1.9 Research transparency addendum
- 1.9.1 Source attribution framework
- 1.9.2 Quality assurance metrics
- 1.9.3 Our commitment to trust
- 1.10 Market definitions
Chapter 2 Executive Summary
- 2.1 Industry synopsis, 2022 - 2035
- 2.1.1 Business trends
- 2.1.2 Ash type trends
- 2.1.3 Method trends
- 2.1.4 Application trends
- 2.1.5 Service type trends
- 2.1.6 Regional trends
Chapter 3 Industry Insights
- 3.1 Industry ecosystem analysis
- 3.1.1 Raw material availability & sourcing analysis
- 3.1.2 Manufacturing capacity assessment
- 3.1.3 Supply chain resilience & risk factors
- 3.1.4 Distribution network analysis
- 3.2 Industry impact forces
- 3.2.1 Growth drivers
- 3.2.2 Industry pitfalls & challenges
- 3.3 Regulatory landscape
- 3.4 Growth potential analysis
- 3.5 Porter's analysis
- 3.5.1 Bargaining power of suppliers
- 3.5.2 Bargaining power of buyers
- 3.5.3 Threat of new entrants
- 3.5.4 Threat of substitutes
- 3.6 PESTEL analysis
- 3.6.1 Political factors
- 3.6.2 Economic factors
- 3.6.3 Social factors
- 3.6.4 Technological factors
- 3.6.5 Legal factors
- 3.6.6 Environmental factors
- 3.7 Cost structure analysis of coal ash utilization & disposal
- 3.8 Emerging opportunities & trends
- 3.9 Growth in untapped markets & applications
- 3.10 Investment analysis & future prospects
- 3.11 Capacity & production landscape (Driven by Primary Research)
- 3.11.1 Capacity by region & key producer (Driven by Primary Research)
- 3.11.2 Capacity utilization rates & expansion pipelines (Driven by Primary Research)
- 3.12 Impact of AI & Generative AI on the market (Driven by Primary Research)
- 3.12.1 AI-Driven production optimization (Driven by Primary Research)
- 3.12.2 Predictive maintenance & fault detection (Driven by Primary Research)
Chapter 4 Competitive Landscape, 2026
- 4.1 Introduction
- 4.2 Company market share analysis, by region, 2025
- 4.2.1 North America
- 4.2.2 Europe
- 4.2.3 Asia Pacific
- 4.2.4 Middle East & Africa
- 4.2.5 Latin America
- 4.3 Competitive analysis of major market players
- 4.4 Competitive positioning matrix
- 4.5 Key developments
- 4.5.1 Mergers & acquisitions
- 4.5.2 Partnerships & collaborations
- 4.5.3 New product launches
- 4.5.4 Expansion plans & funding
- 4.6 Company tier benchmarking
- 4.6.1 Tier classification criteria & qualifying thresholds
- 4.6.2 Tier positioning matrix by revenue, geography & innovation
Chapter 5 Market Size and Forecast, By Ash Type, 2022 - 2035 (USD Million)
- 5.1 Key trends
- 5.2 Fly ash
- 5.3 Bottom ash
- 5.4 Boiler slag
- 5.5 FGD gypsum
- 5.6 FBC ash
- 5.7 Others
Chapter 6 Market Size and Forecast, By Method, 2022 - 2035 (USD Million)
- 6.1 Key trends
- 6.2 Utilization
- 6.3 Disposal
Chapter 7 Market Size and Forecast, By Application, 2022 - 2035 (USD Million)
- 7.1 Key trends
- 7.2 Cement & concrete
- 7.3 Bricks & blocks
- 7.4 Road construction & infrastructure
- 7.5 Wallboard & gypsum products
- 7.6 Mine reclamation
- 7.7 Agriculture
- 7.8 Waste stabilization
- 7.9 Others
Chapter 8 Market Size and Forecast, By Service Type, 2022 - 2035 (USD Million)
- 8.1 Key trends
- 8.2 Collection & handling
- 8.3 Transportation & logistics
- 8.4 Beneficiation & processing
- 8.5 Disposal & landfill management
- 8.6 Pond closure & remediation
Chapter 9 Market Size and Forecast, By Region, 2022 - 2035 (USD Million)
- 9.1 Key trends
- 9.2 North America
- 9.2.1 U.S.
- 9.2.2 Canada
- 9.2.3 Mexico
- 9.3 Europe
- 9.3.1 Germany
- 9.3.2 UK
- 9.3.3 Italy
- 9.3.4 France
- 9.3.5 Poland
- 9.3.6 Czech Republic
- 9.3.7 Turkey
- 9.4 Asia Pacific
- 9.4.1 China
- 9.4.2 India
- 9.4.3 Japan
- 9.4.4 Australia
- 9.4.5 South Korea
- 9.4.6 Indonesia
- 9.4.7 Malaysia
- 9.4.8 Vietnam
- 9.5 Middle East & Africa
- 9.5.1 Saudi Arabia
- 9.5.2 UAE
- 9.5.3 Morocco
- 9.5.4 South Africa
- 9.5.5 Egypt
- 9.6 Latin America
- 9.6.1 Brazil
- 9.6.2 Chile
- 9.6.3 Argentina
- 9.6.4 Colombia
Chapter 10 Company Profiles
- 10.1 ASH GROVE
- 10.2 Ashtech India
- 10.3 Burns & McDonnell
- 10.4 Casila Infracon
- 10.5 CEMEX
- 10.6 Charah Solutions
- 10.7 Clean Harbors
- 10.8 DTE Energy
- 10.9 Eco Material Technologies
- 10.10 Enviri Corporation
- 10.11 GEOCYCLE
- 10.12 Heidelberg Materials
- 10.13 ICM Marshall
- 10.14 JAYCEE BUILDCORP LLP
- 10.15 REFEX
- 10.16 RPM Solutions
- 10.17 Salt River Materials Group
- 10.18 Titan America
- 10.19 Veolia North America
- 10.20 WM Intellectual Property Holdings
 羧酸鹽療法市場-全球產業規模、佔有率、趨勢、機會、預測:按類型、應用、最終用戶、地區和競爭對手分類,2021-2031年
 咖啡美容產品市場規模、佔有率和成長分析:按產品類型、咖啡成分類型、性質、配方類型、最終用戶、分銷管道和地區分類-2026-2033年產業預測
 咖啡美容產品市場:商機、成長要素、產業趨勢分析及2026-2035年預測
 羧基療法全球市場規模、佔有率、趨勢和成長分析報告(2026-2034)咖啡美容產品市場規模、佔有率、成長率及全球市場分析:按產品類型、應用和地區分類的洞察,以及2026-2034年的預測全球咖啡美容產品市場規模、佔有率、趨勢和成長分析報告(2026-2034年)化妝品和香水零售連鎖市場-全球產業規模、佔有率、趨勢、機會和預測(按產品類型、包裝類型、分銷管道、地區和競爭格局分類,2021-2031年)菸鹼醯胺化妝品市場-全球產業規模、佔有率、趨勢、機會、預測:依產品、集中度、通路、地區和競爭格局分類,2021-2031年視網醇美容產品市場-全球產業規模、佔有率、趨勢、機會和預測(按產品類型、銷售管道、地區和競爭格局分類,2021-2031年)
 折疊式化妝鏡市場依照明類型、放大倍率、價格範圍、最終用戶和通路分類-2026-2032年全球預測